. 2021 Oct 20;41(42):8826-8838.
doi: 10.1523/JNEUROSCI.1105-21.2021. Epub 2021 Sep 7.

Common and Unique Inhibitory Control Signatures of Action-Stopping and Attentional Capture Suggest That Actions Are Stopped in Two Stages

Affiliations

Common and Unique Inhibitory Control Signatures of Action-Stopping and Attentional Capture Suggest That Actions Are Stopped in Two Stages

Joshua R Tatz et al. J Neurosci. .

Abstract

The ability to stop an already initiated action is paramount to adaptive behavior. Much scientific debate in the field of human action-stopping currently focuses on two interrelated questions. (1) Which cognitive and neural processes uniquely underpin the implementation of inhibitory control when actions are stopped after explicit stop signals, and which processes are instead commonly evoked by all salient signals, even those that do not require stopping? (2) Why do purported (neuro)physiological signatures of inhibition occur at two different latencies after stop signals? Here, we address both questions via two preregistered experiments that combined measurements of corticospinal excitability, EMG, and whole-scalp EEG. Adult human subjects performed a stop signal task that also contained "ignore" signals: equally salient signals that did not require stopping but rather completion of the Go response. We found that both stop- and ignore signals produced equal amounts of early-latency inhibition of corticospinal excitability and EMG, which took place ∼150 ms following either signal. Multivariate pattern analysis of the whole-scalp EEG data further corroborated that this early processing stage was shared between stop- and ignore signals, as neural activity following the two signals could not be decoded from each other until a later time period. In this later period, unique activity related to stop signals emerged at frontocentral scalp sites, reflecting an increased stop signal P3. These findings suggest a two-step model of action-stopping, according to which an initial, universal inhibitory response to the saliency of the stop signal is followed by a slower process that is unique to outright stopping.SIGNIFICANCE STATEMENT Humans often have to stop their ongoing actions when indicated by environmental stimuli (stop signals). Successful action-stopping requires both the ability to detect these salient stop signals and to subsequently inhibit ongoing motor programs. Because of this tight entanglement of attentional control and motor inhibition, identifying unique neurophysiological signatures of action-stopping is difficult. Indeed, we report that recently proposed early-latency signatures of motor inhibition during action-stopping are also found after salient signals that do not require stopping. However, using multivariate pattern analysis of scalp-recorded neural data, we also identified subsequent neural activity that uniquely distinguished action-stopping from saliency detection. These results suggest that actions are stopped in two stages: the first common to all salient events and the second unique to action-stopping.

Keywords: EEG; EMG; attentional capture; inhibitory control; motor inhibition; stop signal task.


Figures

Figure 1.
Figure 1.
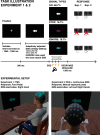
Task diagram. Top, Time course of the behavioral task. Following presentation of the GO stimulus, the arrow changed to magenta or cyan on a minority of trials (16.7% for each color). These signaled to the participant to try to cancel their response (STOP signal) or to continue with the indicated response (IGNORE signal). Bottom left, The setup for Experiment 1, which involved recording MEPs from the right hand while the feet were used to respond. Bottom right, The setup for Experiment 2, in which we recorded EEG from the scalp and EMG from both hands involved in the task.
Figure 2.
Figure 2.
Behavioral RT results from Experiments 1 (left) and 2 (right). Horizontal black brackets represent comparisons made using paired t tests. We report both Frequentist (p values with Holm–Bonferroni correction) and Bayesian (Bayes factor) results. Horizontal black bars represent the group mean RT. Points represent individual participant mean RTs. Error bars indicate SEM. SSRT was estimated via the integration method (Verbruggen et al., 2019) and not statistically compared with the other, directly observed RTs. ***p < 0.001; *p < 0.05. Strong H1: BF > 10; Anec. H1: BF > 1, H1: alternative.
Figure 3.
Figure 3.
Mean normalized MEPs for each Signal type at each TMS Stimulation Time. Horizontal black brackets represent comparisons made using paired t tests. We report both Frequentist (p values with Holm–Bonferroni correction) and Bayesian (Bayes factor) results. Horizontal black bars represent the group mean MEP. Points represent individual participant's mean normalized MEPs. Error bars indicate SEM. Left, Comparisons between Go, Stop (including both successful and failed stop trials), and Ignore trials. Right, Comparisons between Successful Stop, Failed Stop, and Ignore trials. ***p < 0.001; **p < 0.01; *p < 0.05; n.s., p > 0.10. Strong H1/H0: BF > 10; Mod. H1/H0: BF > 3; Anec. H1/H0: BF > 1; H1: alternative; H0: null hypothesis.
Figure 4.
Figure 4.
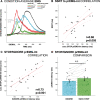
EMG data results. Top left, A, EMG traces for all conditions. Arrows on the left indicate prEMG-int latency for the successful STOP and IGNORE condition. Top right, B, Group-level correlation between successful STOP prEMG-int latency and SSRT. Bottom left, C, Group-level correlation between successful STOP and IGNORE prEMG-int latency. Bottom right, D, Successful STOP and IGNORE prEMG-int latency comparison.
Figure 5.
Figure 5.
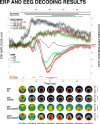
ERP and EEG decoding results. Top plot, Condition ERPs at frontocentral electrode sites FCz/Cz (left scale) and decoding performance for the contrasts of interest (right scale, 0.5 = chance-level decoding). Color bars above the figure represent time periods with significant above-chance whole-scalp MVPA decoding (color-coded identically to the legends). Color bars below the figure represent significant differences in the frontocentral ERP (orange represents SS vs FS; red represents FS vs IGNORE; green represents SS vs IGNORE). Bottom plot, Topographical distribution for SS, IGNORE, and SS-IGNORE ERP; and forward-estimated decoding estimates of SS versus IGNORE decoding.

Similar articles

Cited by

References

    1. Aron AR, Robbins TW, Poldrack RA (2014) Inhibition and the right inferior frontal cortex: one decade on. Trends Cogn Sci 18:177–185. 10.1016/j.tics.2013.12.003 - DOI - PubMed
    1. Aron AR, Durston S, Eagle DM, Logan GD, Stinear CM, Stuphorn V (2007) Converging evidence for a fronto-basal-ganglia network for inhibitory control of action and cognition. J Neurosci 27:11860–11864. 10.1523/JNEUROSCI.3644-07.2007 - DOI - PMC - PubMed
    1. Badry R, Mima T, Aso T, Nakatsuka M, Abe M, Fathi D, Foly N, Nagiub H, Nagamine T, Fukuyama H (2009) Suppression of human cortico-motoneuronal excitability during the Stop signal task. Clin Neurophysiol 120:1717–1723. 10.1016/j.clinph.2009.06.027 - DOI - PubMed
    1. Benjamini Y, Hochberg Y (1995) Controlling the false discovery rate: a practical and powerful approach to multiple testing. J R Stat Soc B 57:289–300. 10.1111/j.2517-6161.1995.tb02031.x - DOI
    1. Bissett PG, Logan GD (2014) Selective stopping? Maybe not. J Exp Psychol Gen 143:455–472. 10.1037/a0032122 - DOI - PMC - PubMed

Publication types

LinkOut - more resources