. 2021 Dec;27(12):1528-1544.
doi: 10.1261/rna.078576.120. Epub 2021 Sep 7.

The kinesin KIF1C transports APC-dependent mRNAs to cell protrusions

Affiliations

The kinesin KIF1C transports APC-dependent mRNAs to cell protrusions

Xavier Pichon et al. RNA. 2021 Dec.

Abstract

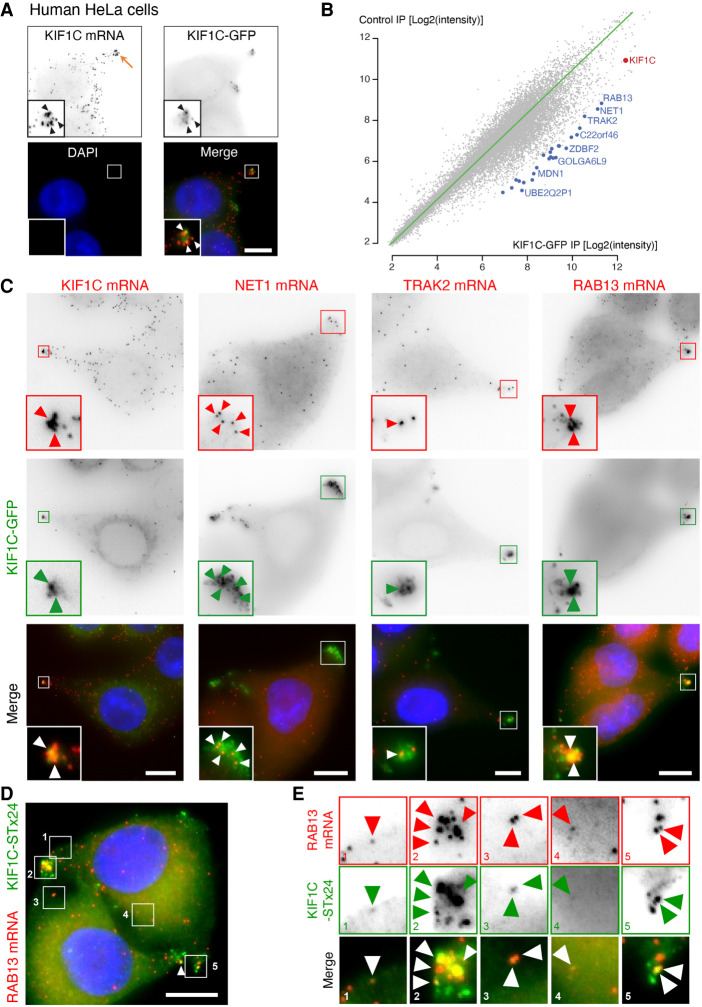
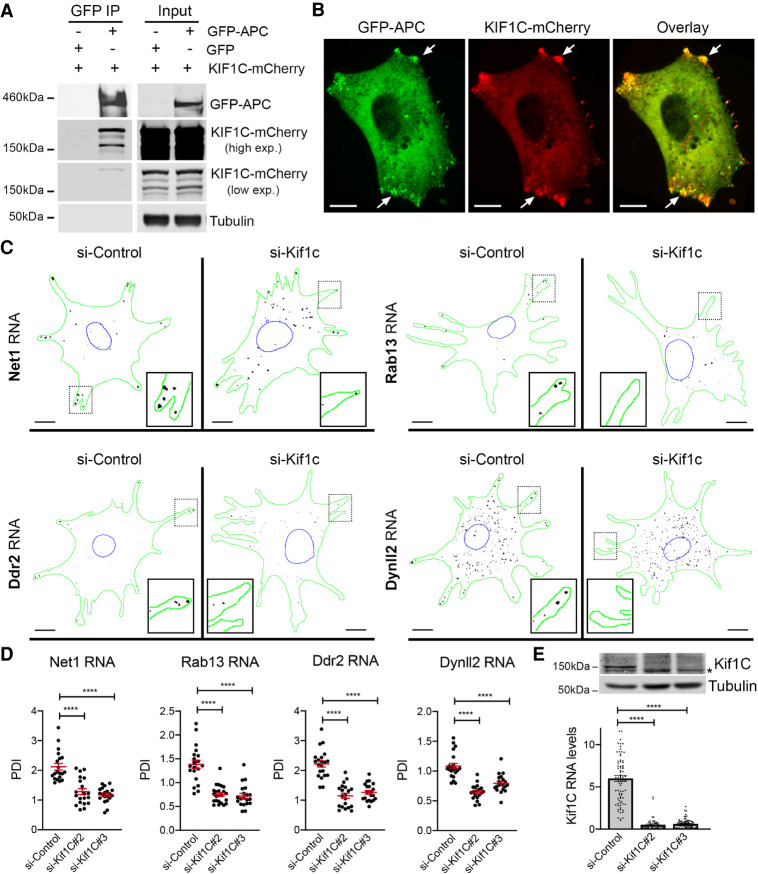
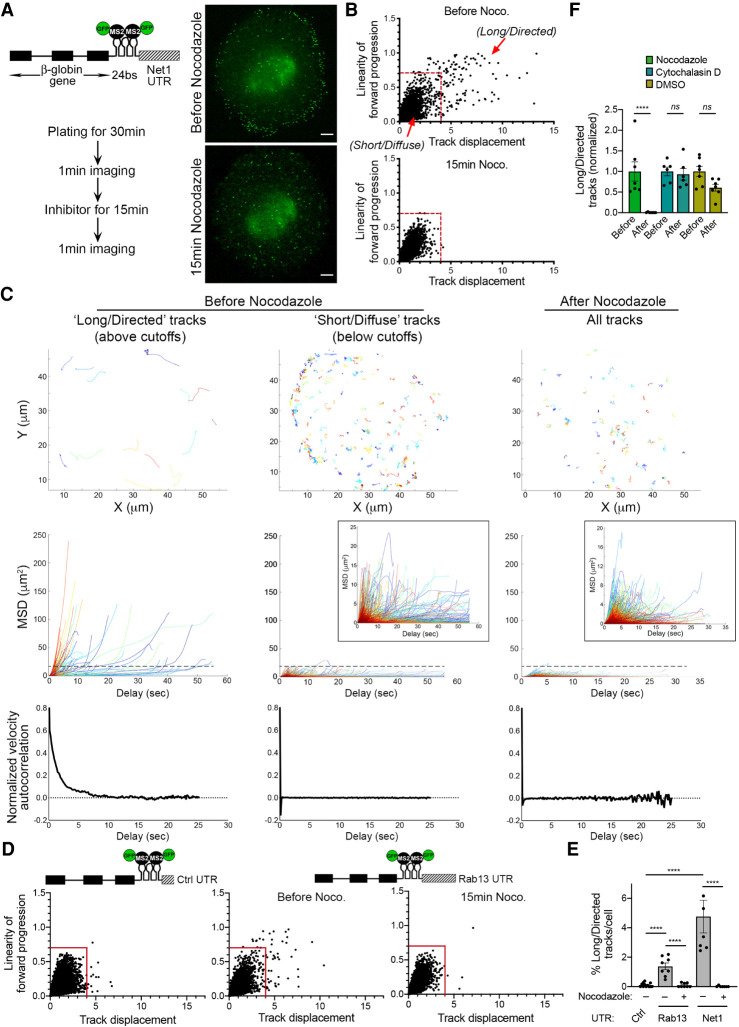
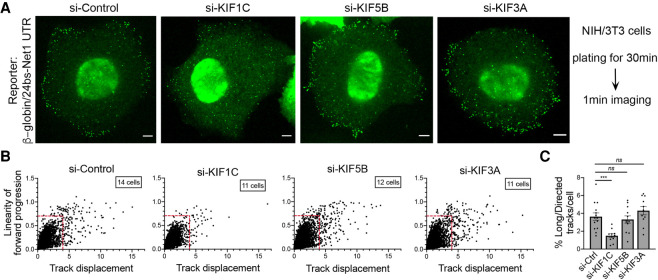
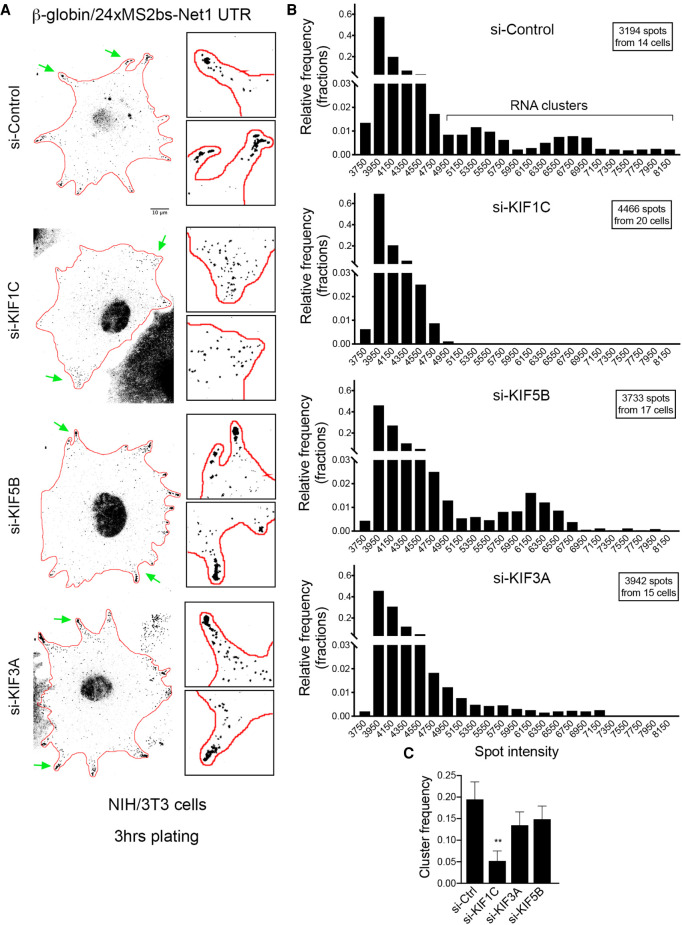
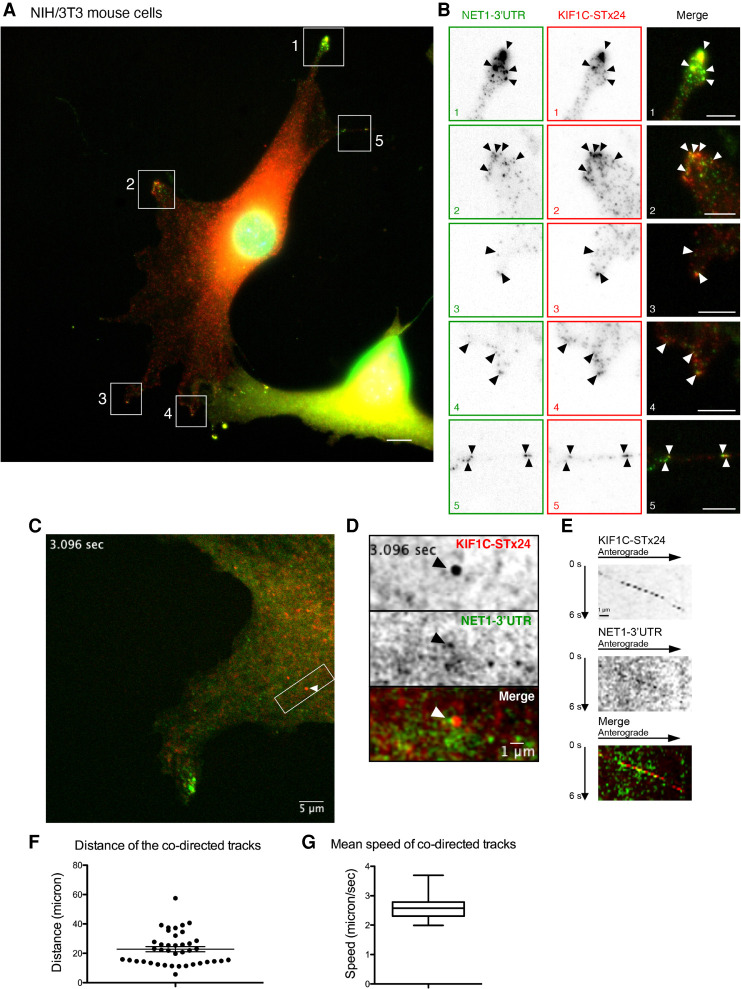
RNA localization and local translation are important for numerous cellular functions. In mammals, a class of mRNAs localize to cytoplasmic protrusions in an APC-dependent manner, with roles during cell migration. Here, we investigated this localization mechanism. We found that the KIF1C motor interacts with APC-dependent mRNAs and is required for their localization. Live cell imaging revealed rapid, active transport of single mRNAs over long distances that requires both microtubules and KIF1C. Two-color imaging directly revealed single mRNAs transported by single KIF1C motors, with the 3'UTR being sufficient to trigger KIF1C-dependent RNA transport and localization. Moreover, KIF1C remained associated with peripheral, multimeric RNA clusters and was required for their formation. These results reveal a widespread RNA transport pathway in mammalian cells, in which the KIF1C motor has a dual role in transporting RNAs and clustering them within cytoplasmic protrusions. Interestingly, KIF1C also transports its own mRNA, suggesting a possible feedback loop acting at the level of mRNA transport.

Keywords: RNA localization; RNA transport; cytoplasmic protrusions; local translation.


Figures

FIGURE 1.
FIGURE 1.
Identification of mRNAs associated with the KIF1C motor. (A) The KIF1C kinesin colocalizes with its mRNA in protrusions of HeLa cells. Images are micrographs of a H9 FlipIn HeLa cell line stably expressing a KIF1C-GFP cDNA. (Top left) KIF1C mRNA detected by smFISH with probes against the endogenous mRNA; (top right) KIF1C-GFP protein; (bottom left) DNA stained with DAPI; (bottom right) merge of the two signals with the KIF1C-GFP protein in green and KIF1C mRNA in red. Orange arrow: a cell protrusion. Blue: DNA stained with DAPI. Scale bar: 10 microns. Insets represent zooms of the boxed areas in the merge panel. White and black arrowheads indicate the colocalization of KIF1C mRNA with KIF1C-GFP protein. (B) Transcripts associating with the KIF1C-GFP protein. The graph depicts the microarray signal intensity of RNAs detected in a KIF1C-GFP pull-down (x-axis), versus the control IP (y-axis). Each dot represents an mRNA. Red dot: KIF1C mRNA; blue dot: mRNAs enriched in the KIF1C-GFP IP. N = 2. (C) Colocalization of KIF1C-GFP with KIF1C, NET1, TRAK2, and RAB13 mRNAs. Images are micrographs of HeLa H9 Flip-In cells stably expressing a KIF1C-GFP cDNA, labeled by smiFISH with probes against the indicated mRNAs. (Top) Cy3 fluorescent signals corresponding to endogenous KIF1C, NET1, TRAK2, and RAB13 mRNAs. (Middle) KIF1C-GFP signal. (Lower) Merge with the Cy3 signal in red and GFP signal in green. Blue: DNA stained with DAPI. Scale bar: 10 microns. Arrowheads indicate accumulation of single mRNA molecules at cell protrusions. (D) Single-molecule colocalization of KIF1C-ST-x24 with RAB13 mRNAs. Images are micrographs of Hela cells stably expressing KIF1C-STx24 and scFv-GFP. Red: Cy3 fluorescent signals corresponding to RAB13 mRNAs labeled by smiFISH with probes against endogenous RAB13 mRNA. Green: GFP signal corresponding to single molecules of KIF1C protein. Blue: DNA stained with DAPI. Scale bar: 10 microns. (E) Insets represent zooms of the numbered areas from panel D. Legend as in D. Arrowheads indicate molecules of RAB13 mRNA and KIF1C-STx24 protein. Micrographs show cells representative of the population.
FIGURE 2.
FIGURE 2.
KIF1C associates with APC and is required for the localization of APC-dependent mRNAs to cytoplasmic protrusions. (A) Coimmunoprecipitation of KIF1C with APC. GFP or GFP-APC were immunoprecipitated from cells also expressing KIF1C-mCherry and analyzed by western blot to detect the indicated proteins. Results are representative of three independent experiments. (B) Colocalization of GFP-APC and KIF1C-mCherry at cytoplasmic protrusions (arrows). Images are representative of multiple cells observed in two independent experiments. Scale bar: 10 microns. (C) Depletion of Kif1c prevents mRNA accumulation in protrusions. Images are micrographs of NIH/3T3 cells labeled by smFISH with probes against Net1, Rab13, Ddr2, and Dynll2 mRNAs, following treatment with siRNAs against Kif1C (panels si-Kif1c) or a control sequence (panel si-Control). Scale bars: 10 microns. Green: outline of the cells; blue: outline of the nuclei; black: smFISH signals. Insets represent magnifications of the boxed areas. (D) Quantification of mRNA localization of cells described in C. Graphs represent the intracellular distribution of the indicated mRNAs as measured by PDI index, with and without treatment of cells with the indicated siRNAs. Red bars represent the mean and 95% confidence interval. Points indicate individual cells observed in two independent experiments. (E) Detection of Kif1C protein (upper panels) or Kif1C RNA levels (lower graph) from cells treated with the indicated siRNAs. Stars in D and E are P-values: (****) P < 0.0001, (***) P < 0.001, estimated by analysis of variance with Bonferroni's multiple comparisons test.
FIGURE 3.
FIGURE 3.
Reporter mRNAs containing Net1 and Rab13 3′UTRs display long, directed microtubule-dependent displacements. (A) Schematic of the mRNA reporter construct containing the β-globin coding sequence followed by 24xMS2 binding sites and the mouse Net1 3′UTR (β24bs/Net1). Images are snapshots of live NIH/3T3 before or after nocodazole treatment, following the experimental scheme detailed on the left. High speed imaging was performed over 1 min to track individual RNA movements. See Supplemental Movies S1, S2 for time lapse imaging. The cells stably expressed the β24bs/Net1 reporter mRNA and MCP-GFP (Green). Scale bar: 5 microns. (B) The graphs plot the displacement over the linearity of forward progression (defined as the mean straight line speed divided by the mean speed) of single RNA tracks from cells treated as described in A. Red lines indicate the thresholds used to separate “long/directed” from “short/diffuse” tracks. N = 6–7 cells. (C) Analysis of “long/directed” or “short/diffuse” tracks, from untreated cells, or of all tracks from nocodazole-treated cells, from B. Individual raw tracks from a representative cell are displayed in the upper panels. Mean square displacement (MSD) (middle panels) and velocity autocorrelation (bottom panels) of tracks are shown. N = 180 (long/directed); 4427 (short/diffuse); 3795 (after nocodazole) tracks from seven cells. Note that “long/directed” tracks exhibit higher MSD (>15 µm2, dashed black line), than “short/diffuse” or nocodazole-treated tracks, as well as positive velocity autocorrelation. Insets of MSD plots present zooms of y-axis scale. (D) Single RNA molecules of the β24bs/Control 3′UTR (Ctrl) or the β24bs/Rab13 3′UTR reporters were tracked over 1 min period in cells treated or not with nocodazole. Graphs plot the displacements of individual tracks (x-axis) over the linearity of their forward progression (y-axis). Red lines indicate the thresholds used to filter tracks of molecules undergoing directed movement. N = 8–12 cells. (E) The graph depicts the percentage of long/directed tracks of the indicated reporters per cell following treatment with nocodazole. Stars represent P-values: (****) P < 0.0001, estimated using one-way analysis of variance with Sidak's multiple comparisons test. Error bars: standard error of the mean. (F) The bar plot depicts the percentage of long/directed tracks per cell before and after treatment with the indicated compounds. Average values of respective “Before” values were set to 1. N = 6–7. Stars represent P-values: (****) P < 0.0001, ns: nonsignificant, estimated using one-way analysis of variance with Tukey's multiple comparisons test. Error bars: standard error of the mean.
FIGURE 4.
FIGURE 4.
Reporter mRNAs containing the Net1 3′UTR require the Kif1c motor for long, linear microtubule-dependent displacements. (A) Images are snapshots of live NIH/3T3 cells taken 30 min after plating. The cells stably expressed the β24bs/Net1 mRNA reporter and MCP-GFP (Green) and were treated with the indicated siRNAs. The green spots correspond to single mRNAs detected with the MCP-GFP. High speed imaging was performed over 1 min to track individual RNA movements. See Supplemental Movies S5–S8 for time lapse imaging. Scale bars are 5 microns. (B) Graphs plot the displacements of individual RNA tracks (x-axis) over the linearity of their forward progression (y-axis) (defined as the mean straight line speed divided by the mean speed), using the movies of cells as shown in A. Red lines indicate the thresholds used to filter tracks of molecules undergoing directed movement (based on Fig. 3). (C) Graph depicts the percentage of directed tracks per cell following treatment with the indicated siRNAs (see panel B). N = 11–14 cells. Stars represent P-values: (***) P < 0.001, ns: nonsignificant, estimated using one-way analysis of variance with Dunnett's multiple comparisons test. Error bars: standard error of the mean.
FIGURE 5.
FIGURE 5.
Kif1c is required for the peripheral clustering of reporter mRNAs containing the Net1 3′UTR in live mouse fibroblasts. (A) Images are micrographs of live NIH/3T3 cells taken 3 h after plating and expressing MCP-GFP and the β24bs/Net1 reporter mRNA. Cells were treated with the siRNAs indicated on the left. Scale bar is 10 microns. Boxed insets are magnifications of the areas indicated by green arrows. (B) Frequency histograms of the intensities of the β24bs/Net1 reporter mRNA spots following treatment with the indicated siRNAs, measured from images as shown in A, from N = 14–20 cells. The majority of molecules fall under a single lower intensity peak, likely indicative of single molecules, while a smaller fraction exhibits higher intensities indicative of higher order clusters. (C) Graph depicts the mRNA cluster frequency per cell following treatment of cells with the indicated siRNAs. Clusters correspond to β24bs/Net1 mRNA spots of intensities higher than 4950, measured from the graphs shown in B. N = 14–20 cells. Stars represent P-values: (**) P < 0.01, estimated using one-way analysis of variance with Dunnett's multiple comparisons test. Error bars: standard error of the mean.
FIGURE 6.
FIGURE 6.
The KIF1C motor transports mRNAs containing the Net1 3′UTR to cell protrusions. (A) Images are micrographs of fixed NIH/3T3 cells expressing the β24bs/Net1 reporter mRNA, MCP-GFP (green), KIF1C-STx24 protein, and scFv-mScarletI (red). Single molecules of the β 24bs/Net1 reporter mRNA are visible in green, while single molecules of KIF1C-STx24 protein are red. The numbered white boxes are magnified in B. Blue: DNA stained with DAPI. Scale bar is 5 microns. (B) Insets represent magnifications of the boxed areas from the image shown in A. (Left) MCP-GFP signals labeling β24bs/Net1 mRNAs; (middle) scFv-mScarletI labeling KIF1C-STx24 protein; (right) merge with mRNAs in green and KIF1C-STx24 in red. Black and white arrowheads indicate colocalization of single molecules of β24bs/Net1 mRNAs and KIF1C-STx24. Scale bar is 5 microns. (C) Snapshot of a live NIH/3T3 cell expressing β24bs/Net1 mRNA, MCP-GFP (green), KIF1C-STx24 protein, and scFv-mScarletI (red). Snapshot is extracted from Supplemental Movie S9. The white arrowhead indicates a cotransport event of a single molecule of β24bs/Net1 mRNA (green) with a KIF1C-STx24 protein (red). The boxed area is magnified in panels D and E. Scale bar is 5 microns. (D) Magnification of the boxed area in panel C, highlighting a cotransport event. (Top) KIF1C-STx24; (middle) β24bs/Net1 mRNA; (bottom) merged panel with the β24bs/Net1 mRNA in green and KIF1C-STx24 in red. Scale bar is 1 micron. (E) Kymograph from Supplemental Movie S9, showing the trajectory of a single molecule of KIF1C-STx24 (top panel), a single molecule of β24bs/Net1 mRNA (middle panel), and the merge (bottom panel). The cellular area shown corresponds to panel D. (F) The graph depicts the distance traveled by cotransported molecules of KIF1C-STx24 and β24bs/Net1 mRNA. Each data point is a track (40 tracks in total), and the mean and 95% confidence intervals are shown by horizontal lines. Source data are provided in Supplemental Table S4. (G) Boxplot depicting the mean speed of cotransported molecules of KIF1C-STx24 and β24bs/Net1 mRNA in NIH/3T3 cells. Speed is microns/second. The vertical bars display the first and last quartile, the box corresponds to the second and third quartiles, and the horizontal line to the mean (40 tracks in total). Source data are provided in Supplemental Table S4.

Similar articles

Cited by

References

    1. Bahmanyar S, Nelson WJ, Barth AIM. 2009. Role of APC and its binding partners in regulating microtubules in mitosis. Adv Exp Med Biol 656: 65–74. 10.1007/978-1-4419-1145-2_6 - DOI - PMC - PubMed
    1. Baltz AG, Munschauer M, Schwanhäusser B, Vasile A, Murakawa Y, Schueler M, Youngs N, Penfold-Brown D, Drew K, Milek M, et al. 2012. The mRNA-bound proteome and its global occupancy profile on protein-coding transcripts. Mol Cell 46: 674–690. 10.1016/j.molcel.2012.05.021 - DOI - PubMed
    1. Barth AIM, Caro-Gonzalez HY, Nelson WJ. 2008. Role of adenomatous polyposis coli (APC) and microtubules in directional cell migration and neuronal polarization. Semin Cell Dev Biol 19: 245–251. 10.1016/j.semcdb.2008.02.003 - DOI - PMC - PubMed
    1. Baumann S, Komissarov A, Gili M, Ruprecht V, Wieser S, Maurer SP. 2020. A reconstituted mammalian APC-kinesin complex selectively transports defined packages of axonal mRNAs. Sci Adv 6: eaaz1588. 10.1126/sciadv.aaz1588 - DOI - PMC - PubMed
    1. Berleth T, Burri M, Thoma G, Bopp D, Richstein S, Frigerio G, Noll M, Nüsslein-Volhard C. 1988. The role of localization of bicoid RNA in organizing the anterior pattern of the Drosophila embryo. EMBO J 7: 1749–1756. 10.1002/j.1460-2075.1988.tb03004.x - DOI - PMC - PubMed

Publication types