. 2021 Sep 14;118(37):e2014701118.
doi: 10.1073/pnas.2014701118.

Massive and rapid predominantly volcanic CO2 emission during the end-Permian mass extinction

Affiliations

Massive and rapid predominantly volcanic CO2 emission during the end-Permian mass extinction

Ying Cui et al. Proc Natl Acad Sci U S A. .

Abstract

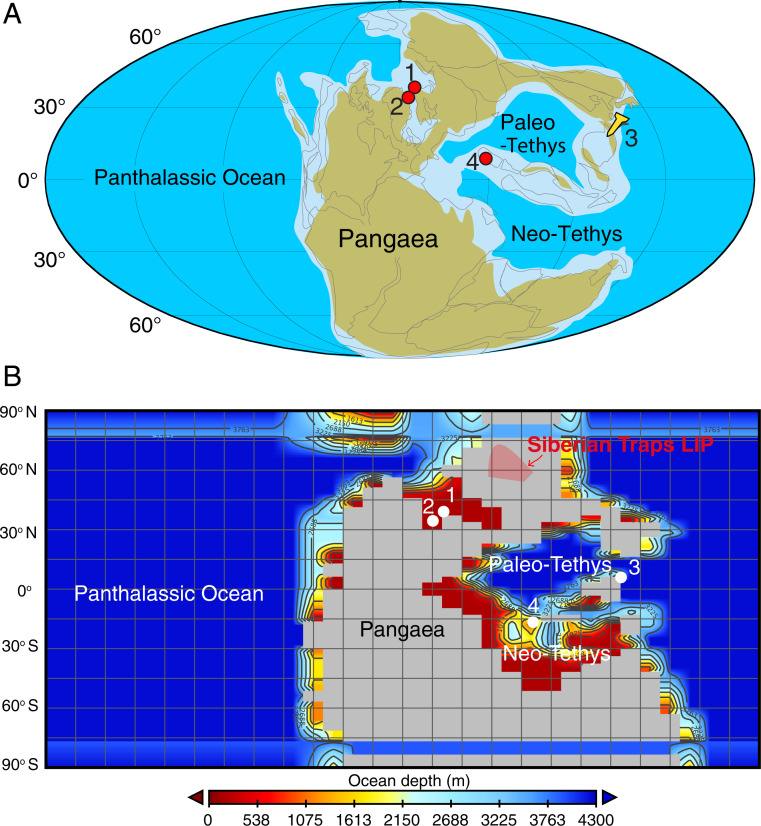
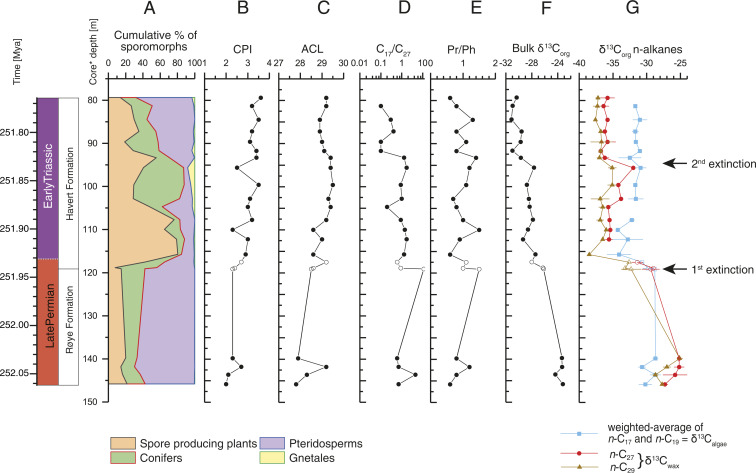
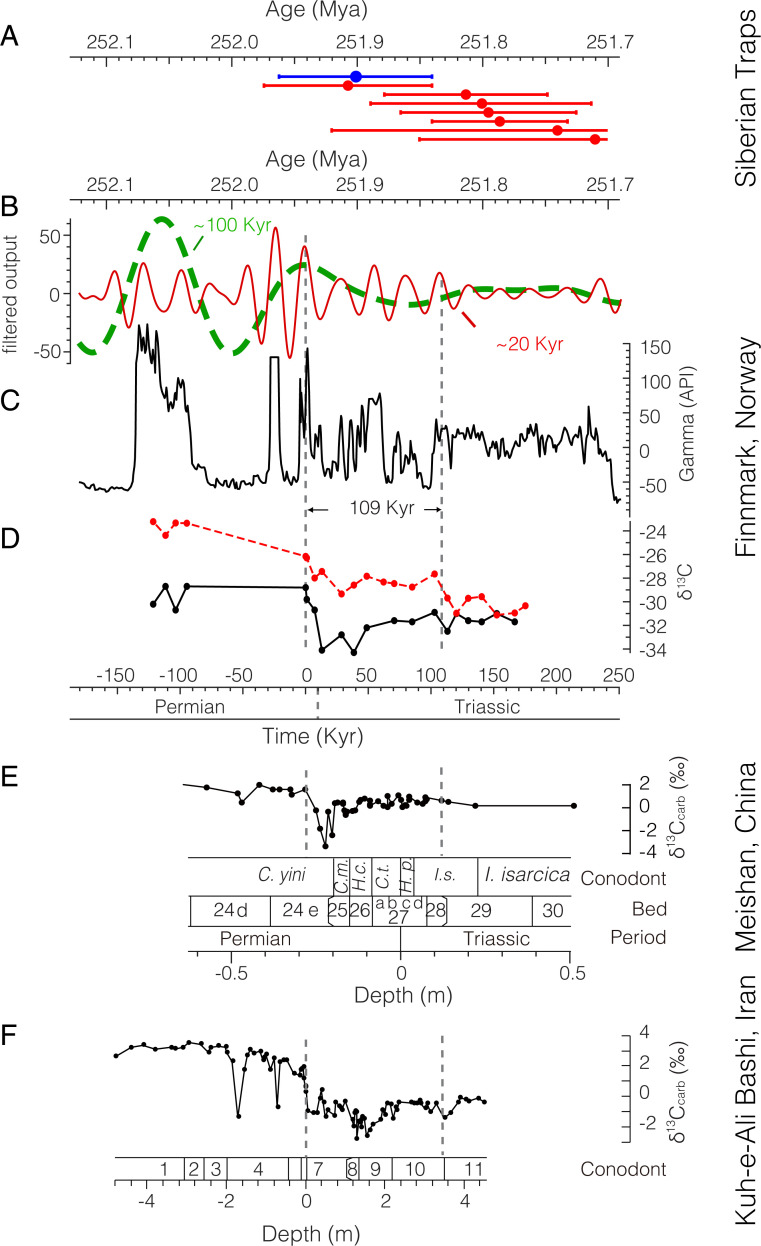
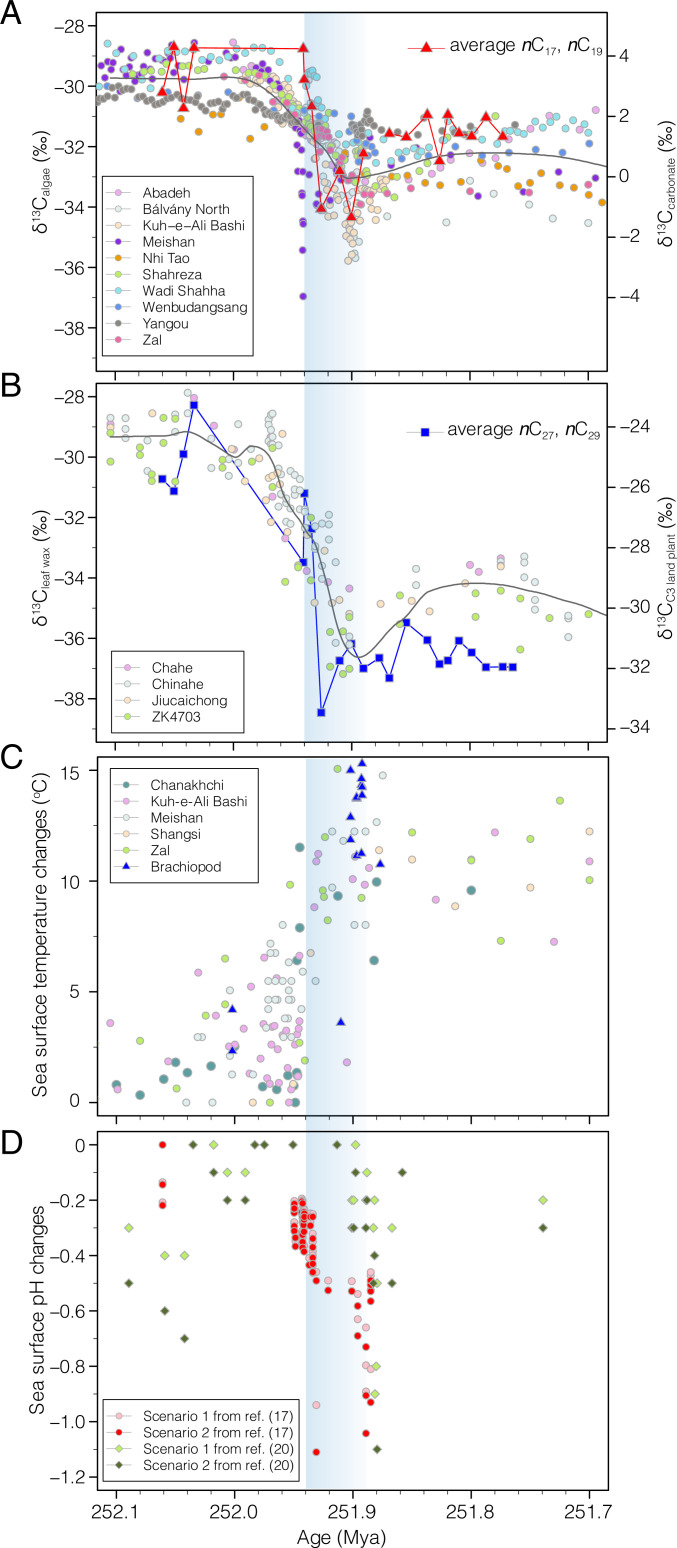
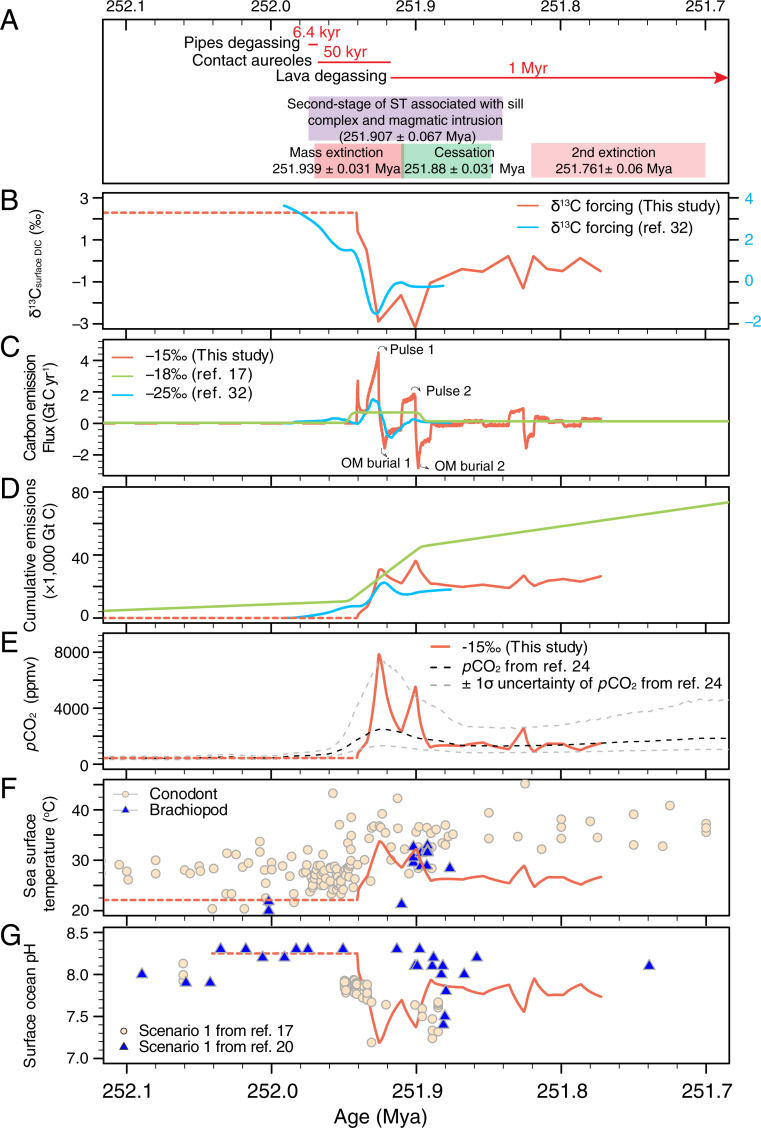
The end-Permian mass extinction event (∼252 Mya) is associated with one of the largest global carbon cycle perturbations in the Phanerozoic and is thought to be triggered by the Siberian Traps volcanism. Sizable carbon isotope excursions (CIEs) have been found at numerous sites around the world, suggesting massive quantities of 13C-depleted CO2 input into the ocean and atmosphere system. The exact magnitude and cause of the CIEs, the pace of CO2 emission, and the total quantity of CO2, however, remain poorly known. Here, we quantify the CO2 emission in an Earth system model based on new compound-specific carbon isotope records from the Finnmark Platform and an astronomically tuned age model. By quantitatively comparing the modeled surface ocean pH and boron isotope pH proxy, a massive (∼36,000 Gt C) and rapid emission (∼5 Gt C yr-1) of largely volcanic CO2 source (∼-15%) is necessary to drive the observed pattern of CIE, the abrupt decline in surface ocean pH, and the extreme global temperature increase. This suggests that the massive amount of greenhouse gases may have pushed the Earth system toward a critical tipping point, beyond which extreme changes in ocean pH and temperature led to irreversible mass extinction. The comparatively amplified CIE observed in higher plant leaf waxes suggests that the surface waters of the Finnmark Platform were likely out of equilibrium with the initial massive centennial-scale release of carbon from the massive Siberian Traps volcanism, supporting the rapidity of carbon injection. Our modeling work reveals that carbon emission pulses are accompanied by organic carbon burial, facilitated by widespread ocean anoxia.

Keywords: CO2; Earth system model; compound specific carbon isotopes; end-Permian mass extinction.


Conflict of interest statement

The authors declare no competing interest.

Figures

Fig. 1.
Fig. 1.
(A) Paleogeographical map of the Late Permian, with former and current coastlines. Indicated are 1) the location of Finnmark cores 7128/12-U-01 and 7129/10-U-01, 2) the East Greenland site at Kap Stosch discussed in ref. , 3) the GSSP site for the base of the Triassic at Meishan, China, and 4) the Kuh-e-Ali Bashi site of Iran (66, 107). The map was modified after ref. . (B) Paleogeography and paleobathymetry of the Late Permian used in cGENIE.
Fig. 2.
Fig. 2.
(A) Relative abundances of major groups of terrestrial palynomorphs. (B) Carbon preference index. (C) ACL of n-alkanes C25-C33. (D) Ratio between C17 and C27 n-alkane abundance. (E) Pristane/phytane (Pr/Ph) ratio. (F) Bulk organic δ13C values (δ13Corg) measured in this study. (G) Compound-specific δ13C values of C27 and C29 n-alkanes (δ13Cwax) and the weighted average of C17 and C19 n-alkanes (δ13Calgae). Error bars represent the SD based on multiple analysis of the same sample. Individual values and SDs are given in SI Appendix, Table S6, and core depth refers to core 7128/12-U-01 (indicated by solid marks) with samples from 7129/10-U-01 (indicated by hollow marks) correlated as shown in SI Appendix, Fig. S2 and Table S5. The astronomically tuned age model (left) is detailed in Fig. 3.
Fig. 3.
Fig. 3.
Time series analysis. (A) Weighted mean uranium-lead (U-Pb) dates reported with 2σ analytical uncertainties for Siberian Traps LIP sills (red) and pyroclastic rocks (blue) (5). (B) ∼100-Kyr eccentricity (dashed green) and 20-Kyr precession (red) Gauss bandpass-filtered cycles (passband is 0.0085 ± 0.0025 and 0.045 ± 0.01 cycles/Kyr, respectively). (C) Time-calibrated gamma ray series in American Petroleum Institute (API) unit from cores 7128/12-U-01. (D) Time-calibrated δ13Corg (red) and δ13Calgae (black) across the Permian–Triassic transition. (E) δ13Ccarb record for the Meishan section, China (2) shown with bed numbers and conodont zones (108). Conodont zones: C. m.=Clarkina meishanensis, H. c. = Hindeodus changxingensis, C. t. = C. taylorae, H. p. = H. parvus, and I.s. = Isarcicella staeschei. (F) δ13C data at Kuh-e-Ali Bashi section of Iran (66, 107) shown with conodont zones (109, 110): 1) C. changxingensis, 2) C. bachmanni, 3) C. nodosa, 4) C. yini, 5) C. abadehensis, 6) C. hauschkei, 7) H. praeparvus-H. changxingensis, 8) M. ultima-S. ?mostleri, 9) H. parvus, 10) H. lobota, and 11) I. staeschei.
Fig. 4.
Fig. 4.
Synthesized proxy records of carbon isotopes from marine carbonates and fossil C3 land plants remains, sea surface temperature, and pH. (A) Comparison between δ13Calgae and global marine carbonate carbon isotopes from sites at Abadeh, Kuh-e-Ali Bashi, Shahreza, and Zal in Iran, Meishan, Wenbudangsang, and Yanggou in South China, at Bálvány North in Hungary, and at Nhi Tao in Vietnam (24). (B) Comparison between δ13Cleaf wax and the δ13C of sedimentary leaf cuticles and wood of C3 land plants from South China (24). (C) Reconstructed sea surface temperature data using conodont fossils (circles) (24) and brachiopods (triangles) (14). The conodont-based temperature data are from sites in the Paleo-Tethys, including Chanakhchi, Kuh-e Ali Bashi, Meishan, Shangsi, and Zal. (D) Relative changes in sea surface pH based on boron isotope proxy from ref. and ref. . Pink and red circles are data from scenario 1 and scenario 2 in ref. , and green and blue diamonds are data from scenario 1 and scenario 2 in ref. .
Fig. 5.
Fig. 5.
Key model results from the RMSE-determined best fit. (A) Links between the EPME and the timing of Siberian Traps volcanism. Age of mass extinction is 251.939 ± 0.031 Ma based on Shen et al. (106) and age of second-stage of Siberian Traps volcanism is 251.907 ± 0.067 Ma from Burgess et al. (4) Duration of pipe degassing, contact aureoles, and lava degassing are from Svensen et al. (9), assuming that the onset age is 251.907 ± 0.067 Ma. Also shown is the age of the extinction cessation at 251.88 ± 0.031 Ma based on Meishan Bed 28 (5) and the age of second extinction in the earliest Triassic at 251.761 ± 0.06 Ma (40). Note that the red curve is based on δ13Calgae assuming a constant fractionation between algae and DIC of 31‰, which is within the range of maximum fractionation for marine algae (–113). (B) δ13C forcing comparison of the surface DIC for this study and (32) derived from the GSSP Meishan section after loess curve fitting. (C) Modeled carbon emission rate in Gt C yr−1 from the best-fit scenario (red) and comparison to the carbon emission rate for the organic matter scenario in (32) (blue) and Jurikova et al. (17) (green). (D) Modeled cumulative carbon emission in Gt C from the best-fit scenario (red) and comparison to the carbon emission rate for the organic matter scenario in Cui et al. (32) (blue) and Jurikova et al. (17) (green). (E) Modeled changes in atmospheric pCO2 in ppmv from the best-fit scenario (red) and the reconstructed continuous pCO2 from Wu et al. (24) based on carbon isotopes of fossil C3 plant remains. (F) Modeled changes in global sea surface temperature in °C from the best-fit scenario (red) and comparison to reconstructed Paleo-Tethys ocean temperature based on δ18O of well-preserved conodonts (beige circles) (24) and brachiopods (blue triangles) (14). (G) Modeled surface ocean pH decline from the best-fit scenario (red) and comparison to the boron isotope proxy pH reconstruction from Jurikova et al. (17) and Clarkson et al. (20). Dashed red lines in B–G represents the steady-state condition from the 200-Kyr-long spin-ups.

Similar articles

Cited by

References

    1. Burgess S. D., Bowring S., Shen S. Z., High-precision timeline for Earth’s most severe extinction. Proc. Natl. Acad. Sci. U.S.A. 111, 3316–3321 (2014). - PMC - PubMed
    1. Shen S. Z., et al. ., Calibrating the end-Permian mass extinction. Science 334, 1367–1372 (2011). - PubMed
    1. Davydov V., Tunguska coals, Siberian sills and the Permian-Triassic extinction. Earth Sci. Rev. 212, 103438 (2021).
    1. Burgess S. D., Muirhead J. D., Bowring S. A., Initial pulse of Siberian Traps sills as the trigger of the end-Permian mass extinction. Nat. Commun. 8, 164 (2017). - PMC - PubMed
    1. Burgess S. D., Bowring S. A., High-precision geochronology confirms voluminous magmatism before, during, and after Earth’s most severe extinction. Sci. Adv. 1, e1500470 (2015). - PMC - PubMed

Publication types

LinkOut - more resources