. 2021 Sep 14;118(37):e2018486118.
doi: 10.1073/pnas.2018486118.

The endogenous circadian system worsens asthma at night independent of sleep and other daily behavioral or environmental cycles

Affiliations

The endogenous circadian system worsens asthma at night independent of sleep and other daily behavioral or environmental cycles

Frank A J L Scheer et al. Proc Natl Acad Sci U S A. .

Abstract

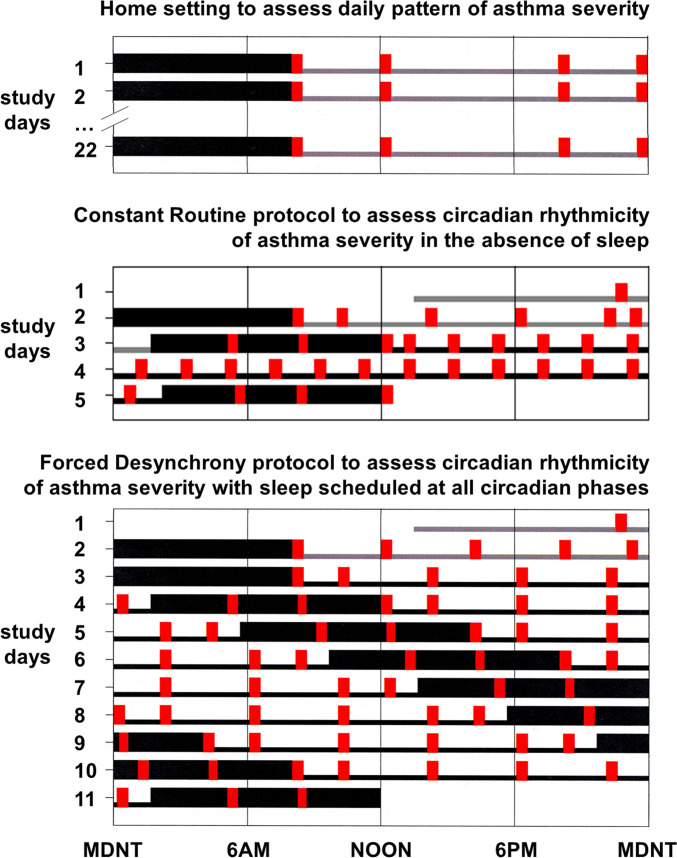
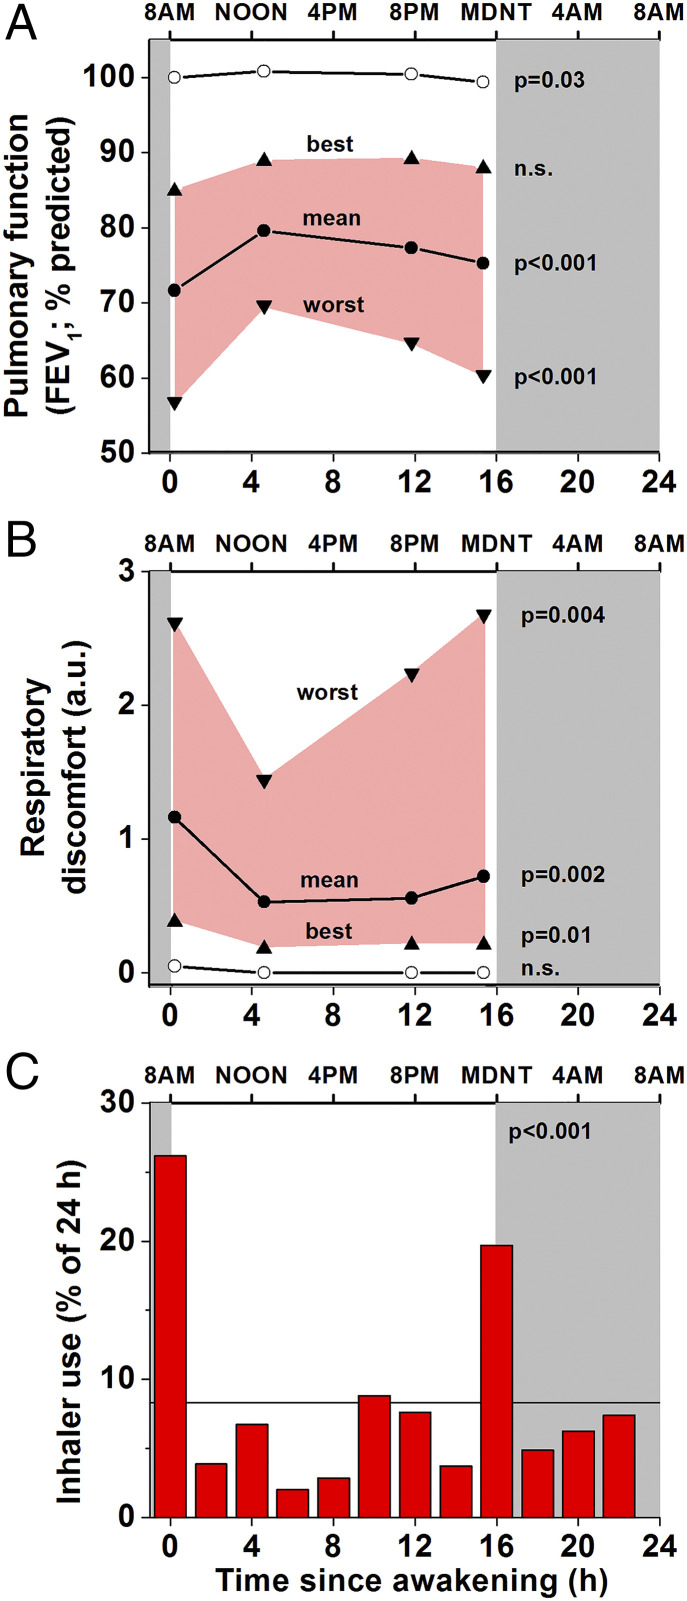
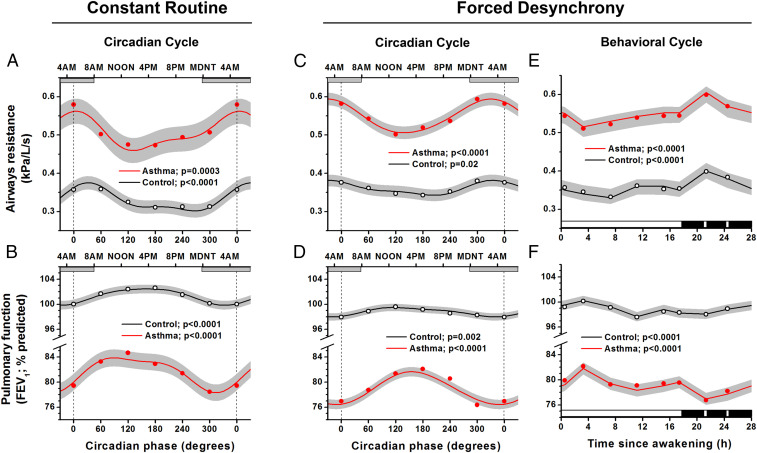
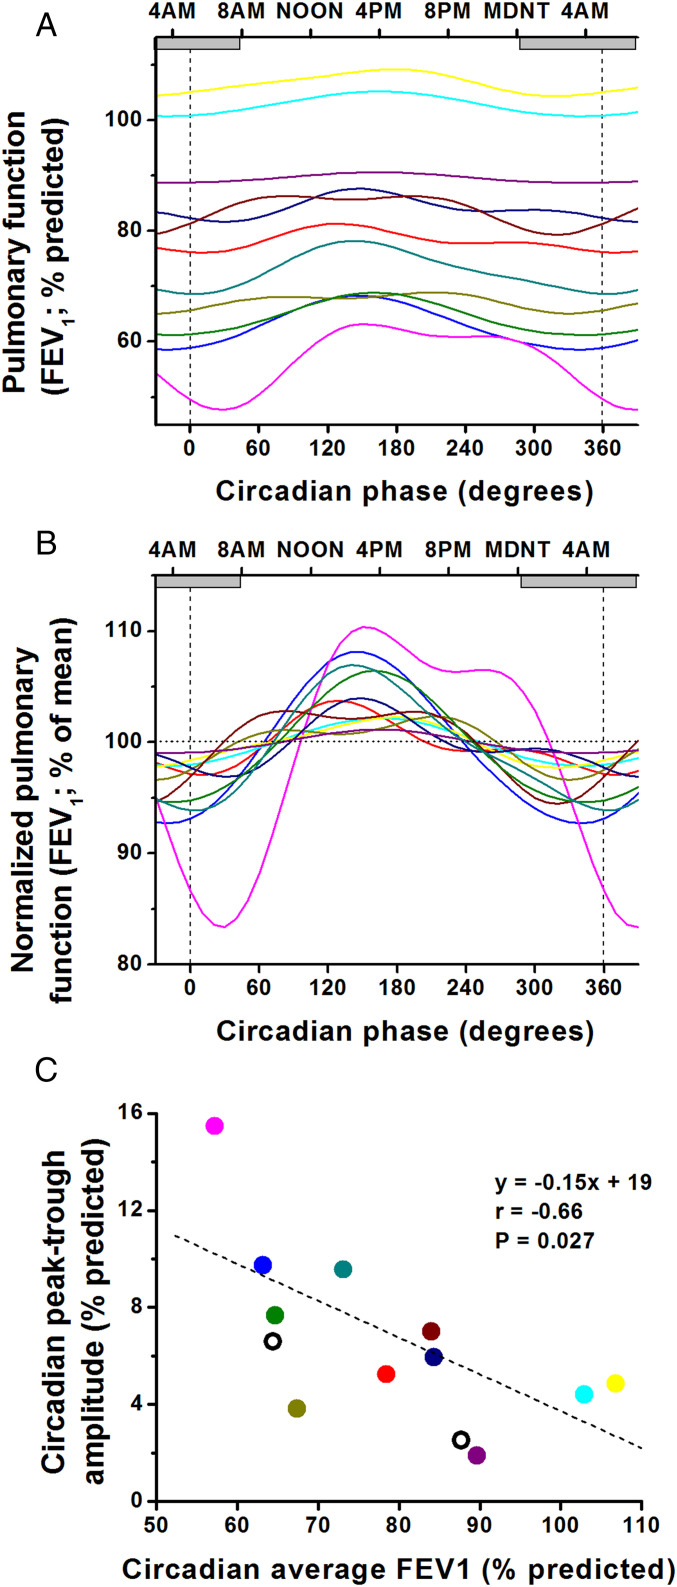
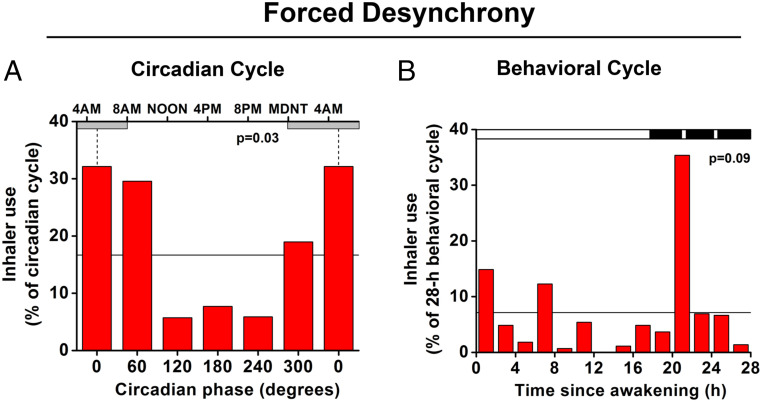
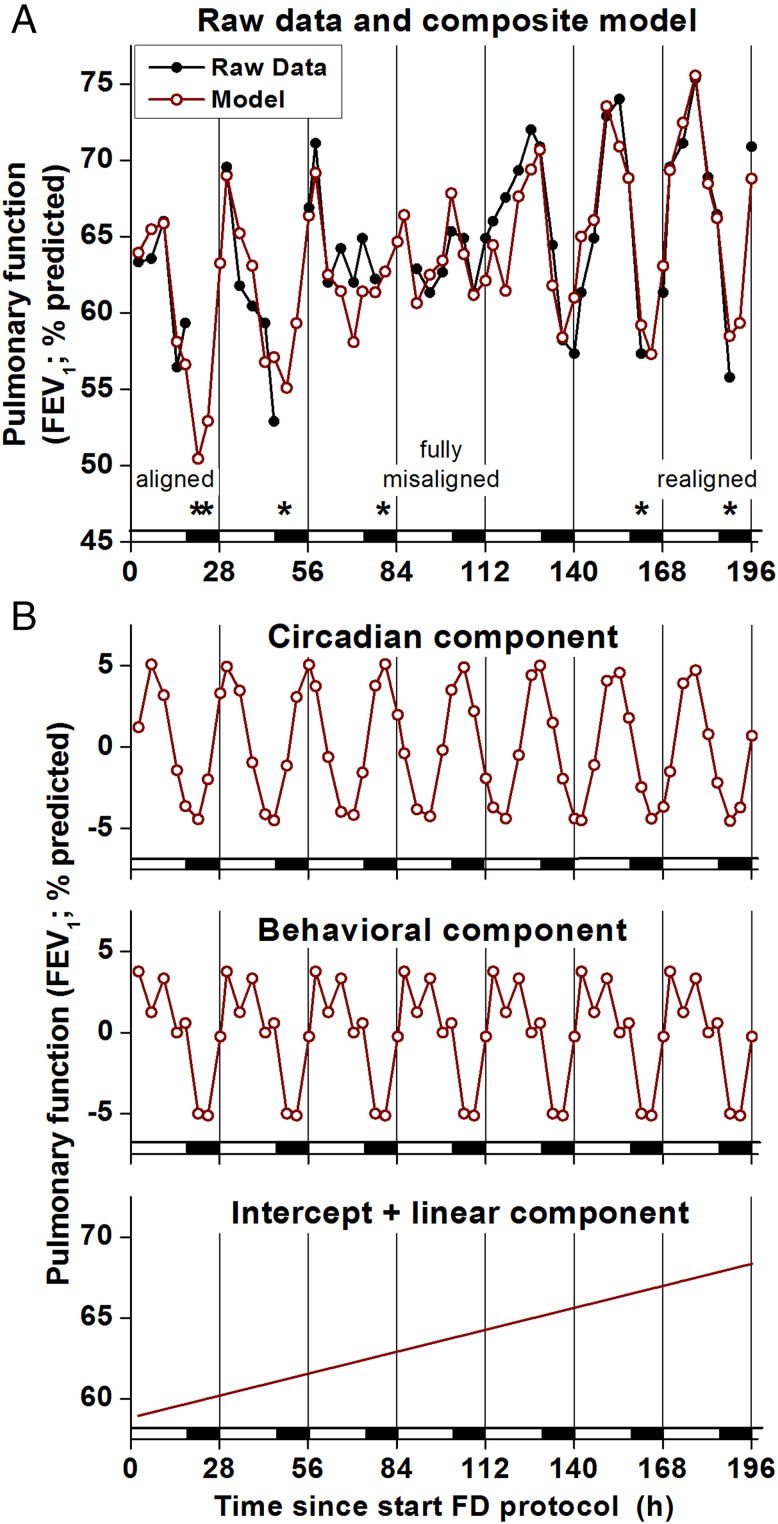
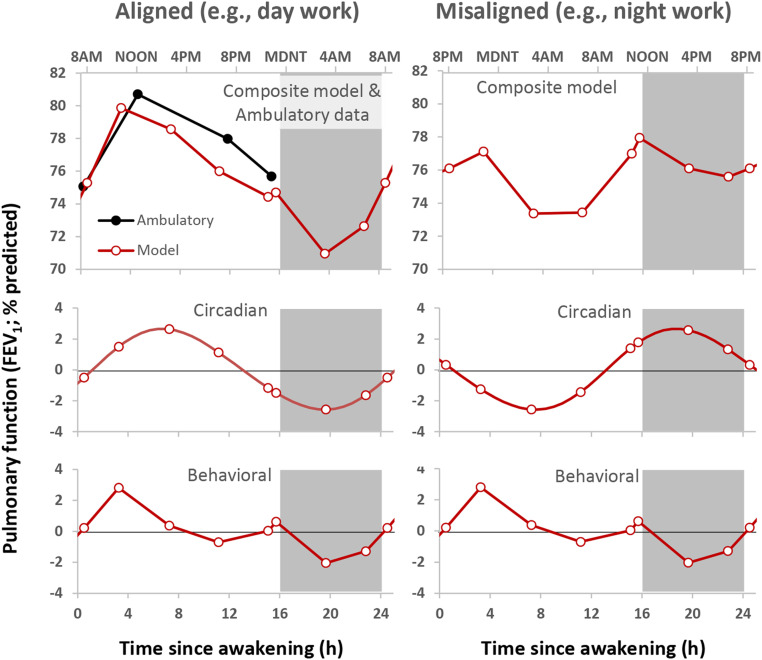
Asthma often worsens at night. To determine if the endogenous circadian system contributes to the nocturnal worsening of asthma, independent of sleep and other behavioral and environmental day/night cycles, we studied patients with asthma (without steroid use) over 3 wk in an ambulatory setting (with combined circadian, environmental, and behavioral effects) and across the circadian cycle in two complementary laboratory protocols performed in dim light, which separated circadian from environmental and behavioral effects: 1) a 38-h "constant routine," with continuous wakefulness, constant posture, 2-hourly isocaloric snacks, and 2) a 196-h "forced desynchrony" incorporating seven identical recurring 28-h sleep/wake cycles with all behaviors evenly scheduled across the circadian cycle. Indices of pulmonary function varied across the day in the ambulatory setting, and both laboratory protocols revealed significant circadian rhythms, with lowest function during the biological night, around 4:00 AM, uncovering a nocturnal exacerbation of asthma usually unnoticed or hidden by the presence of sleep. We also discovered a circadian rhythm in symptom-based rescue bronchodilator use (β2-adrenergic agonist inhaler) whereby inhaler use was four times more likely during the circadian night than day. There were additive influences on asthma from the circadian system plus sleep and other behavioral or environmental effects. Individuals with the lowest average pulmonary function tended to have the largest daily circadian variations and the largest behavioral cycle effects on asthma. When sleep was modeled to occur at night, the summed circadian, behavioral/environmental cycle effects almost perfectly matched the ambulatory data. Thus, the circadian system contributes to the common nocturnal worsening of asthma, implying that internal biological time should be considered for optimal therapy.

Keywords: asthma; bronchodilation; circadian misalignment; circadian rhythms; sleep.


Conflict of interest statement

The authors declare no competing interest.

Figures

Fig. 1.
Fig. 1.
Ambulatory, CR, and FD protocols. Wide black bars represent sleep episodes; narrow gray bars represent wakefulness in normal lighting conditions; narrow black bars represent wake episodes in dim light (∼2 lx); and red bars represent recordings of FEV1 (plus airway resistance when in the laboratory) and breathing discomfort every 2 to 4 h, including immediately after regularly scheduled awakenings from sleep when in the laboratory. Times of any rescue medication use were also recorded. The ∼3 wk (median 22 d) ambulatory protocol (Top) assessed the daily pattern of asthma in the home. Participants maintained a self-selected regular 8-h sleep schedule. The CR protocol (Middle) assessed the circadian rhythm of asthma without sleep while minimizing masking effects of the environment and behaviors. The CR lasted 5 d with 2 baseline days and nights and 38 h of wakefulness in a semirecumbent posture in an individual laboratory suite in dim light, with 2-hourly isocaloric snacks. The FD protocol (Bottom) assessed the separate effects of the circadian system and the behavioral sleep/wake schedule on asthma. The FD lasted 11 d with 2 baseline days and nights and then seven × 28-h “days” in an individual laboratory suite in dim light.
Fig. 2.
Fig. 2.
Ambulatory protocol: asthma is more severe at awakening and at bedtime compared with the middle of the day. Group data with individuals aligned according to time of scheduled sleep (gray shading). The within-participant ranges of asthma severity were averaged for the group (n = 17; worst [downward triangles], mean, and best [upward triangles] at each measurement time). The most severe asthma (worst FEV1 [A] and respiratory discomfort [B]) occurred before bedtime and upon awakening. Similar, although less striking, daily patterns were seen for mean and best FEV1 and for mean and least discomfort. These times coincided with the highest frequency of (unscheduled) use of bronchodilator rescue medication (red columns, C). Note: all data within 6 h following bronchodilator use were excluded. There were large significant differences between control participants (open circles, n = 10) and asthma participants in FEV1 and respiratory discomfort at all times of day. For controls, only group averages of individuals’ mean FEV1 and discomfort are shown (because FEV1 was close to 100% predicted without respiratory discomfort at all times). The bottom plot shows significant evening and morning peaks in the average distribution of beta2-adrenergic agonist use in those participants (n = 15) who needed to use their inhaler (horizontal line indicates expected frequency assuming no daily variation). P values indicate significance levels for variations relative to time since awakening.
Fig. 3.
Fig. 3.
Independent effects of circadian system and behavioral sleep/wake cycle on pulmonary function. The CR (A and B: 11 asthma, 10 control) and FD protocols (C and D: 13 asthma, 5 control) show expected mean differences in pulmonary function (FEV1) and airway resistance between asthma and control participants and revealed significant circadian rhythms for both groups in airway resistance and FEV1. Cosinor models, which make use of the precise circadian phase of each measurement for each participant, are shown (red lines represent asthma; black lines represent controls; gray areas represent 95% CI). Circles indicate raw 60° bin-averaged data and are added primarily to illustrate that the model fits the data. X-axes show the circadian phases at the bottom, with corresponding clock times at the top. Gray horizontal bars represent group-average timing of habitual sleep episodes. Both the CR and FD revealed that pulmonary function was worst during the biological night (highest airway resistance and lowest FEV1) around the CBT minimum (vertical dotted lines at 0° = ∼5:00 AM). Right panels (E and F) show independent effects on pulmonary function of the 28-h sleep/wake schedule (averaged across all circadian phases). Black bars represent sleep episode (interspersed with two awakenings for pulmonary function measurements). There were significant changes across the sleep/wake cycle in asthma and control groups, with pulmonary function always best during the wake episode and almost invariably worst at the time of the first scheduled awakening from sleep. P values indicate significance levels for circadian (A–D) and sleep/wake cycle (E and F) variations. Note: for panels A through D, the first and last data points and the beginning and end of the model curves are double-plotted to make it easier to visualize rhythmicity.
Fig. 4.
Fig. 4.
More severe asthma associated with greater circadian amplitude in pulmonary function. During the FD protocol, 11 of 13 participants with asthma had a significant endogenous circadian rhythm in FEV1 (shown by individual colors): absolute values (A), normalized to percent deviations around means (B). X-axes for A and B show the circadian phase, with corresponding clock times at the top. Note: the first and last data points and the beginning and end of the cosine curves are double-plotted to make it easier to visualize rhythmicity. All 11 individuals had their circadian trough in FEV1 during the biological night (circadian phases 270° to 90°; gray horizontal bars show average habitual sleep episodes across the biological night). C shows the relationship between overall severity of asthma (x-axis; lower values indicating more severe asthma) and amplitude of circadian rhythm in FEV1 (y-axis). Colors of lines and symbols are matched for individuals across all three panels. It can be seen that those individuals with more severe asthma (lower circadian average FEV1) had greater amplitudes of circadian rhythms in FEV1 and therefore much lower circadian nocturnal troughs in FEV1. Thus, overall, the average FEV1 predicts the extent of the circadian nocturnal trough in FEV1. The two individuals without statistically significant circadian rhythms in FEV1 are superimposed on C (open circles) and appear to fit within the group trend.
Fig. 5.
Fig. 5.
Endogenous circadian rhythm in rescue medication. (A) Average distribution of beta2-adrenergic agonist inhaler use across the circadian cycle. Data were derived during the FD protocol from the eight asthma participants who used bronchodilator rescue medication during this protocol. There was a significant rhythm in bronchodilator rescue medication use, which was four times more likely to occur during the biological night (circadian bins 300°, 0°, and 60°; CBT minimum shown by vertical dotted lines at 0° = ∼5:00 AM; gray horizontal bars represent average habitual sleep episodes) than during the biological day (bins 120°, 180°, and 240°). The horizontal line indicates expected relative frequency of inhaler use assuming no circadian rhythm (100/6 circadian phase bins = 16.7%). The P value represents the significance of the circadian effect from nonparametric ANOVA. Note: the first and last bars are double-plotted to make it easier to visualize rhythmicity. B shows effects on inhaler use of the 28-h sleep/wake schedule, averaged across all circadian phases. The black bar represents the sleep period interspersed with three awakenings for pulmonary function measurements. The horizontal line indicates expected relative frequency of inhaler use assuming no effect of time (100/14 2-h bins = 7.1%). There was no overall significant effect of time into the sleep/wake schedule (P = 0.09), yet there was a sharp peak in rescue-inhaler use at the time of the first awakening from sleep, coincident with worst pulmonary function (Fig. 3 E and F).
Fig. 6.
Fig. 6.
Summed circadian, behavioral, and environmental effects on pulmonary function. (A) FEV1 data (black closed circles and lines) and composite regression model (red open circles and lines) from one individual with asthma across seven sequential 28-h wake/sleep cycles of the FD protocol (196 h). The x-axis represents time into FD; black bars represent scheduled sleep. Scheduled waketime varied, ranging from the individual’s habitual waketime (“aligned”) to 12 h out of synchrony (“fully misaligned”). The model fit the data well (R2 = 0.816). * denotes beta2-adrenergic agonist rescue inhaler use (followed by 6-h gaps in FEV1 data that were excluded from analyses because of effects of inhaler on FEV1). Most inhaler uses and lowest FEV1 occurred when aligned (at the beginning of the FD protocol) and when realigned (at the end of the FD protocol) due to summed effects of sleep and circadian cycle on pulmonary function (i.e., sleeping during the circadian night). In contrast, when fully misaligned (in the middle of the FD protocol), there were less severe drops in FEV1 and much less bronchodilator use. (B) Circadian, behavioral, and linear FEV1 model components derived from FD. Circadian and behavioral components each contributed recurring ∼10% variations per day with lowest FEV1 during the biological night (circadian component: ∼24-h cycle) and during sleep (behavioral component: 28-h cycle). An additional steady increase in FEV1 was evident across the protocol (196-h linear component), which is likely attributable to living in the clean laboratory environment. The intercept represents this participant’s average FEV1 upon entering the FD.
Fig. 7.
Fig. 7.
Summed circadian and behavioral components derived from FD protocol versus ambulatory data. (Left) Modeled effects (red lines) of the behavioral cycle (Bottom), circadian cycle (Middle), and combined effects (Top) on FEV1 compared with actual averaged ambulatory data (black lines) for the same 13 participants who completed the FD. For comparison with ambulatory data, the linear component across the FD was extrapolated back to the day of laboratory admission. The circadian and behavioral components each contributed ∼4% variation, with lowest FEV1 during the biological night (circadian component) and during sleep (behavioral component). The composite summed model fit the ambulatory data well, albeit with slightly lower FEV1 across the daytime (compare red and black lines in top left panel). Notably, during normal nocturnal alignment of sleep (Left), the model predicts FEV1 would be lowest during sleep (a time window when measurements were not taken when at home) due to summed reductions in FEV1 caused by sleep (behavioral component) and the endogenous biological night (circadian component). The right panels show the same modeled data but where sleep occurs 12 h misaligned compared with their habitual sleep time, as may occur during night work. During this circadian misalignment, the peak and trough are less pronounced than during circadian alignment because the modulation of FEV1 by sleep and by the circadian system partially cancel each other out. Note: in each panel, the first and last data points and the beginning and end of the curves are double-plotted to make it easier to visualize rhythmicity.

References

    1. Floyer J., A Treatise of the Asthma (Wilkin, London, 1698).
    1. Dethlefsen U., Repgas R., Ein neues therapieprinzip bei nachtlichen asthma. Klin. Med. (Mosk.) 80, 44–47 (1985).
    1. Turner-Warwick M., Epidemiology of nocturnal asthma. Am. J. Med. 85, 6–8 (1988). - PubMed
    1. Martin R. J., Banks-Schlegel S., Chronobiology of asthma. Am. J. Respir. Crit. Care Med. 158, 1002–1007 (1998). - PubMed
    1. Bagg L. R., Hughes D. T., Diurnal variation in peak expiratory flow in asthmatics. Eur. J. Respir. Dis. 61, 298–302 (1980). - PubMed

Publication types