. 2021 Sep 7;12(1):5315.
doi: 10.1038/s41467-021-25011-w.

Proximity proteomics identifies PAK4 as a component of Afadin-Nectin junctions

Affiliations

Proximity proteomics identifies PAK4 as a component of Afadin-Nectin junctions

Yohendran Baskaran et al. Nat Commun. .

Abstract

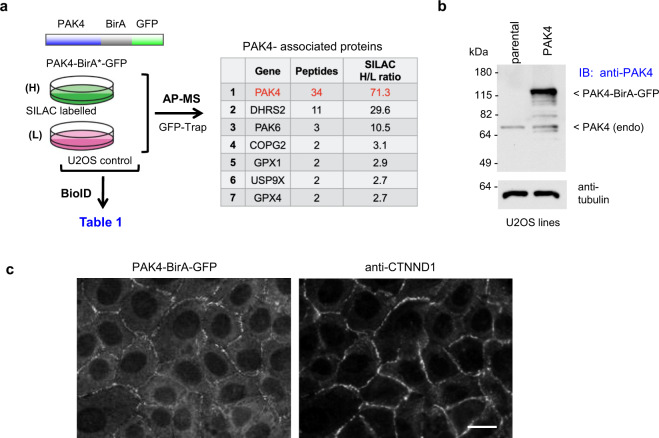
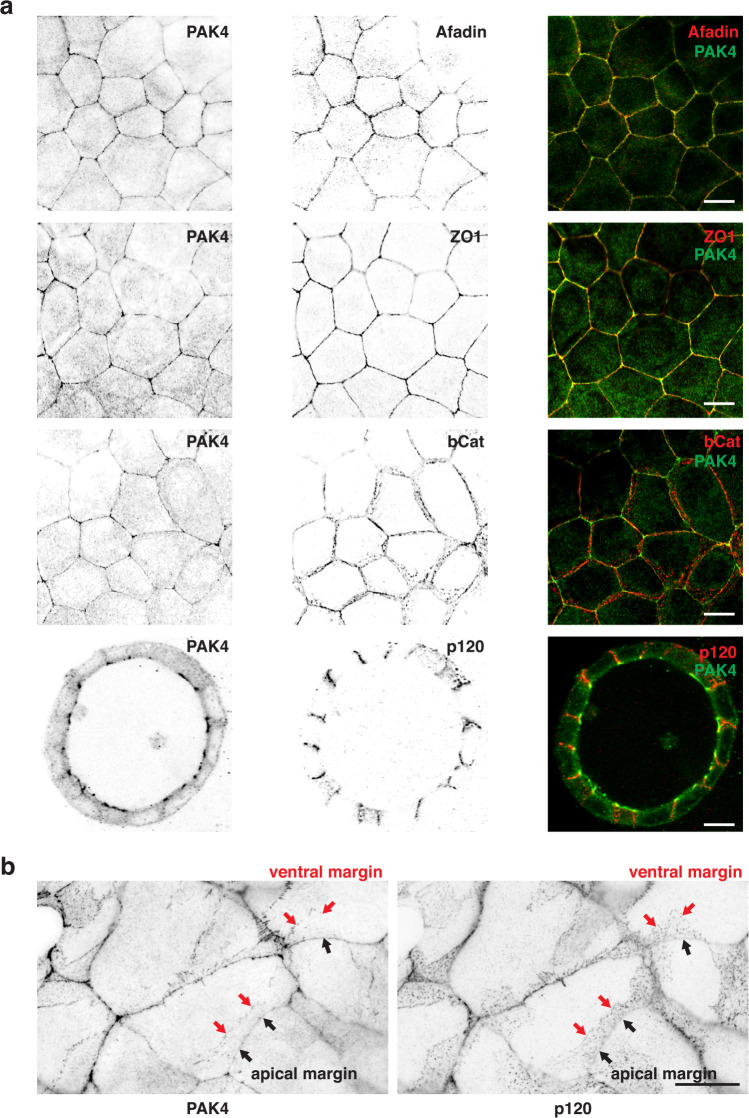
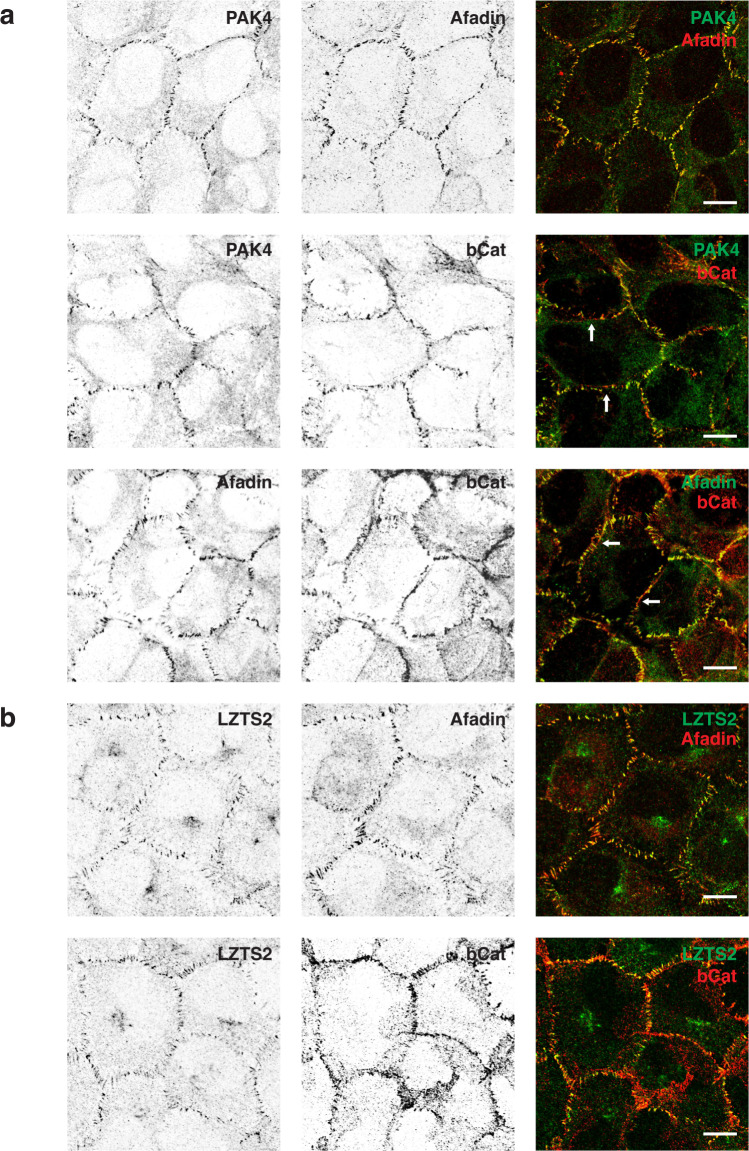
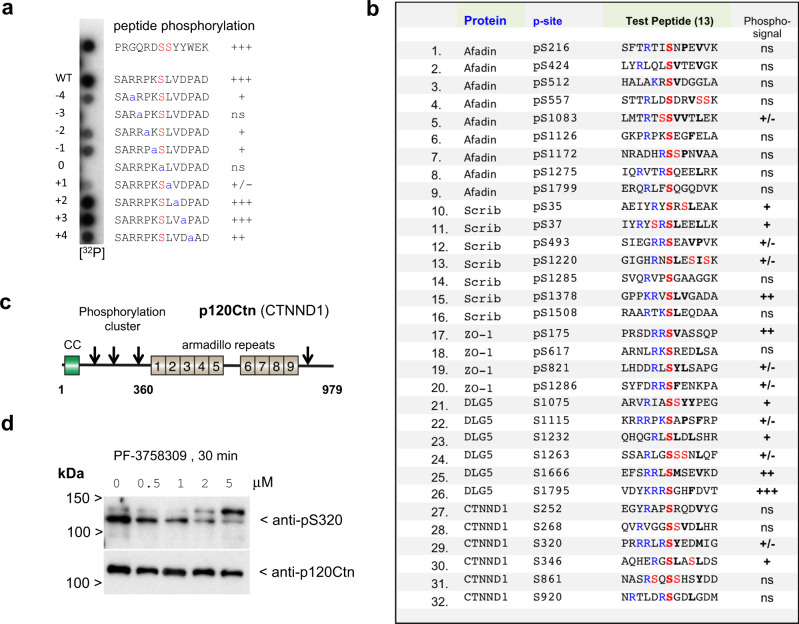
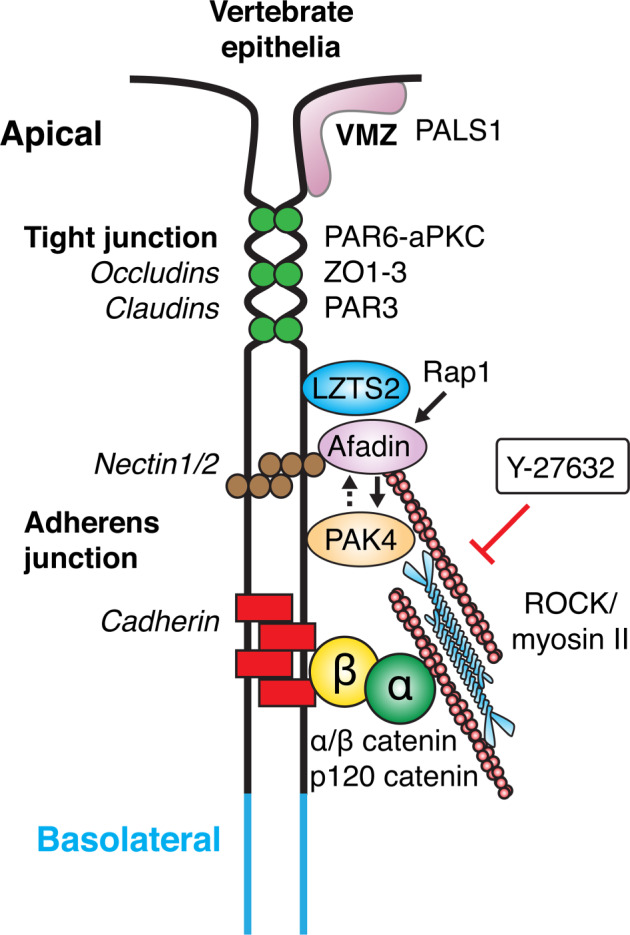
Human PAK4 is an ubiquitously expressed p21-activated kinase which acts downstream of Cdc42. Since PAK4 is enriched in cell-cell junctions, we probed the local protein environment around the kinase with a view to understanding its location and substrates. We report that U2OS cells expressing PAK4-BirA-GFP identify a subset of 27 PAK4-proximal proteins that are primarily cell-cell junction components. Afadin/AF6 showed the highest relative biotin labelling and links to the nectin family of homophilic junctional proteins. Reciprocally >50% of the PAK4-proximal proteins were identified by Afadin BioID. Co-precipitation experiments failed to identify junctional proteins, emphasizing the advantage of the BioID method. Mechanistically PAK4 depended on Afadin for its junctional localization, which is similar to the situation in Drosophila. A highly ranked PAK4-proximal protein LZTS2 was immuno-localized with Afadin at cell-cell junctions. Though PAK4 and Cdc42 are junctional, BioID analysis did not yield conventional cadherins, indicating their spatial segregation. To identify cellular PAK4 substrates we then assessed rapid changes (12') in phospho-proteome after treatment with two PAK inhibitors. Among the PAK4-proximal junctional proteins seventeen PAK4 sites were identified. We anticipate mammalian group II PAKs are selective for the Afadin/nectin sub-compartment, with a demonstrably distinct localization from tight and cadherin junctions.


Conflict of interest statement

The authors declare no competing interests.

Figures

Fig. 1
Fig. 1. Workflow of SILAC-enriched analysis of PAK4- proximal proteins.
a Schematic of PAK4-BirA*GFP constructs used for SILAC BioID analysis. Summary of workflow used to identify PAK4-proximal proteins using stable cell lines cultured in either Arg/Lys isotopically heavy (H) or light (L) containing media as indicated. b Total lysate from control and PAK4-BirA*GFP cell lines were subjected to western blot to compare the expression of PAK4-BirA*GFP versus endogenous PAK4 (arrow) and repeated in two independent experiments. c Disposition of PAK4-BirA-GFP in stable U2OS cell lines. Cells were fixed in PFA and immuno-stained for anti-GFP and anti-p120ctn. Source data are provided as a Source Data file.
Fig. 2
Fig. 2. Analyses of proximal proteins identified by PAK4 and Afadin BioID.
a Schematic of Afadin domain structure and some previously identified interacting proteins, with those identified here labelled in red. b Diagram showing the extensive overlap between PAK4 (Table 1, SILAC with ratio >2.5) and Afadin proximal proteins (BioID data in Supplementary Data T1) which indicates these proteins share a similar junctional localization. Non-identical alternate isoforms of these shared proteins are also in red. c Proteins proximal to both PAK4 and Afadin are presented with putative sub-complexes (of different colours) based on validated (low throughput) protein–protein interaction data. To simplify the network different isoforms of the same proteins are shown as a single symbol, with the exception of DLG1 and DLG5. The proteins that are known to be membrane-bound (for example, by lipid anchors) or peripheral membrane proteins are placed in a juxta-membrane position.
Fig. 3
Fig. 3. Disposition of PAK4, Afadin and ZO1 in MDCK cells.
a Confluent MDCK cells grown on glass coverslips (4 days) were fixed with methanol and co-stained using rabbit anti-PAK4 and mouse anti-Afadin/anti-β-catenin or anti-ZO1. Images were collected on an Olympus Fluoview confocal microscope with ×100 oil objective. Lower panels show MDCK cell grown in Matrigel to form 3D-cultured acini (8 days) fixed in methanol and immuno-stained with anti-PAK4, anti-p120ctn (×60 objective). b Sub-confluent (2 day) cells were stained using rabbit antibodies specific for PAK4 and mouse antibody specific for p120 (×60 objective). Repeated in three independent experiments. Scale bars: 10 μm.
Fig. 4
Fig. 4. Disposition of PAK4, Afadin, LZTS2 and β-catenin in U2OS cells.
a Confluent U2OS cells grown on glass coverslips for 3 days then fixed with methanol and immuno-stained for PAK4 and Afadin or β-catenin antibodies as described in 'Methods'. Note the concordance in localization (top panel) between PAK4 and Afadin compared with that of β-catenin. Images were collected on an Olympus Fluoview confocal microscope with ×100 oil objective. b Cells were similarly stained using anti-LZTS2 (rabbit) and mouse anti-Afadin, or anti-β-catenin. Again note the concordance of staining of LZTS2 with Afadin. Repeated in three independent experiments. Scale bars: 10 μm.
Fig. 5
Fig. 5. Afadin and contractibility dependent localization of PAK4 to cell–cell junctions.
a MDCK cells were treated with non-targeting (NT), Afadin or PAK4 siRNA for 72 h as indicated. Following fixation in methanol, the cells were immuno-stained for PAK4 and Afadin (Mab) as indicated. Confocal images were taken at ×100 magnification. The red-dotted line indicates the boundary of clonal knockdown cells. Repeated in three independent experiments. b Scatter plot showing relative protein levels derived from confocal immuno-fluorescent images. The junctional fluorescence signal was calculated for multiple 10 × 50 pixel junctional regions (cf. red bar, see 'Methods') and displayed as a ratio relative to the NT control (20 cells over 2 independent replicates). Data from two independent experiments were combined with bars indicating standard deviation from the mean analysed using a two-tailed, unpaired t-test (p < 0.0001). Scale bars: 20 μm. c, d MDCK cells were grown to 80% confluence on uncoated glass coverslips, rinsed in calcium-free PBS and incubated in 5 mM EGTA, serum-free DME for 45 min, until more then 50% cells showed rounding. Media containing 5% serum (1.8 mM calcium) was added for 45 min to allow reattachment, before addition of inhibitor/DMSO for 4 h. Cells were then fixed in methanol and immuno-stained for PAK4 or Afadin antibodies and images were taken with an Olympus Fluoview confocal microscope with ×100 oil objective. White arrows indicate enrichment at tricellular junctions. The bicellular junctional fluorescence signal was calculated as above (cf. region with red bar) and tricellular junctional fluorescence signal was calculated for a standard 15 × 15 pixel circle (red) after removal of local background (non-junction) signal. Lower panel shows scatter plots as indicated (20 cells over 2 independent replicates) from two independent experiments. Bars indicate standard deviation from the mean and analysed using an ordinary one-way ANOVA test (****p < 0.0001). Scale bars: 10 μm. Source data are provided as a Source Data file.
Fig. 6
Fig. 6. Analysis of PAK4 proximal substrates by phospho-proteomics.
a Schematic of phosphoproteomic analysis to identify phosphorylation sites that are differentially sensitive to PF3758309 versus Frax597. Summary of the workflow used to identify phospho-peptides that were depleted following PAK inhibitor treatment (12 min). The p-peptide changes were derived from isotopic ratio extracted from LC-MS/MS spectra. (experiments carried out in ‘forward’ and ‘reverse’ directions). b A combined matrix for the PAK4 sites was generated using WebLogo 3.7.4. as for a consensus motif for AMPK.
Fig. 7
Fig. 7. Peptide spot analysis of putative target sites in PAK4-proximal proteins.
a To assess the effect of single amino-acid substitution on a selected optimal PAK4 substrate, we tested 13aa synthetic peptides (Pepspots, Jerini) derived from PAK4 pseudosubstrate motif (SARRPKPLVDPAD) in which the proline in bold is replaced by Ser(0). This is similar to an optimal substrate for PAKs (RKRRNSLAYKK) termed PAKtide but optimal for kinase binding. Based on structural considerations the Arg side chain at position −2 or −3 occupies a pocket that mediates interactions found in PAKs and other S/T kinases, including PKA. The contribution of each side-chain to peptide phosphorylation was assessed by sequential alanine substitution. b We selected in vivo basic-directed phosphorylation sites identified in Afadin, scribble, ZO-1, DLG5 and p120ctn as compiled in the Phosphosite database (V6.5.9.3). The corresponding synthetic peptides were synthesized and subjected to in situ phosphorylation. The extent of phosphorylation (32P signal) ranges from detectable (−/+) to very strong (+++), with no signal shown as ns. c Schematic of the domain structure and relative positions of the p120-catenin phosphorylation sites as indicated in the table. d Western blot showing the inhibition of p120ctn Ser320 phosphorylation by PF-3758309 U2OS cells.
Fig. 8
Fig. 8. Simplified schemes showing the organization of the junctional complexes of polarized epithelial cells in vertebrates.
The sub-apical complex includes a structure recently described as well the tight junction (TJ) and region ‘below’ this typically described adherens junction (AJ), which includes both Afadin and cadherin complexes. The smaller cadherin punctate junctions along the lateral contacts are not explicitly indicated. Typical non-transmembrane components (for example, p120ctn and β-catenin) are often used as markers and these are indicative of well-studied components. The Afadin/nectin compartment in vertebrates is often spatially segregated from cadherin as described in the text.

References

    1. Manser E, et al. PAK kinases are directly coupled to the PIX family of nucleotide exchange factors. Mol. Cell. 1998;1:183–192. doi: 10.1016/S1097-2765(00)80019-2. - DOI - PubMed
    1. Turner CE, et al. Paxillin LD4 motif binds PAK and PIX through a novel 95-kD ankyrin repeat, ARF-GAP protein: a role in cytoskeletal remodeling. J.Cell Biol. 1999;145:851–863. doi: 10.1083/jcb.145.4.851. - DOI - PMC - PubMed
    1. Grassart A, Dujeancourt A, Lazarow PB, Dautry-Varsat A, Sauvonnet N. Clathrin-independent endocytosis used by the IL-2 receptor is regulated by Rac1, Pak1 and Pak2. EMBO Rep. 2008;9:356–362. doi: 10.1038/embor.2008.28. - DOI - PMC - PubMed
    1. Carter GC, Bernstone L, Baskaran D, James W. HIV-1 infects macrophages by exploiting an endocytic route dependent on dynamin, Rac1 and Pak1. Virology. 2011;409:234–250. doi: 10.1016/j.virol.2010.10.018. - DOI - PubMed
    1. Abo A, et al. PAK4, a novel effector for Cdc42Hs, is implicated in the reorganization of the actin cytoskeleton and in the formation of filopodia. EMBO J. 1998;17:6527–6540. doi: 10.1093/emboj/17.22.6527. - DOI - PMC - PubMed

Publication types

MeSH terms