. 2021 Sep 7;12(1):5309.
doi: 10.1038/s41467-021-24870-7.

Single-nuclei transcriptomes from human adrenal gland reveal distinct cellular identities of low and high-risk neuroblastoma tumors

Affiliations

Single-nuclei transcriptomes from human adrenal gland reveal distinct cellular identities of low and high-risk neuroblastoma tumors

O C Bedoya-Reina et al. Nat Commun. .

Abstract

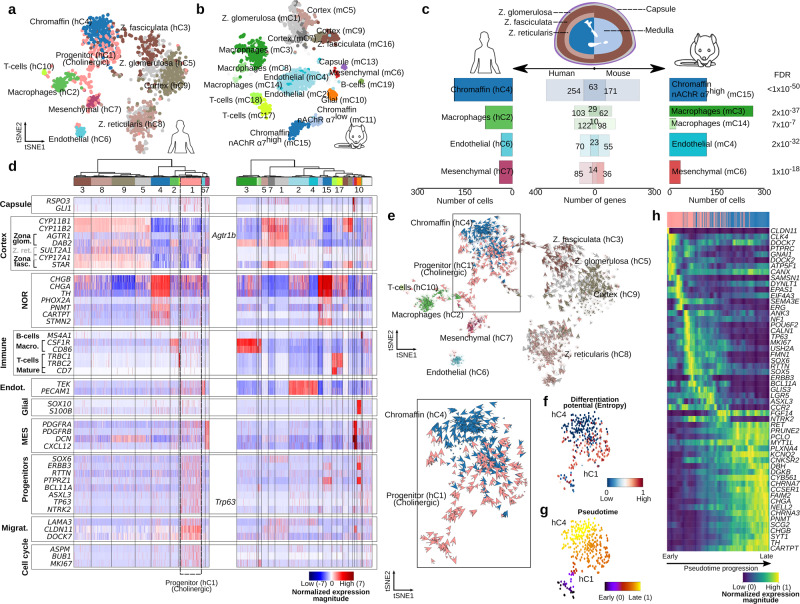
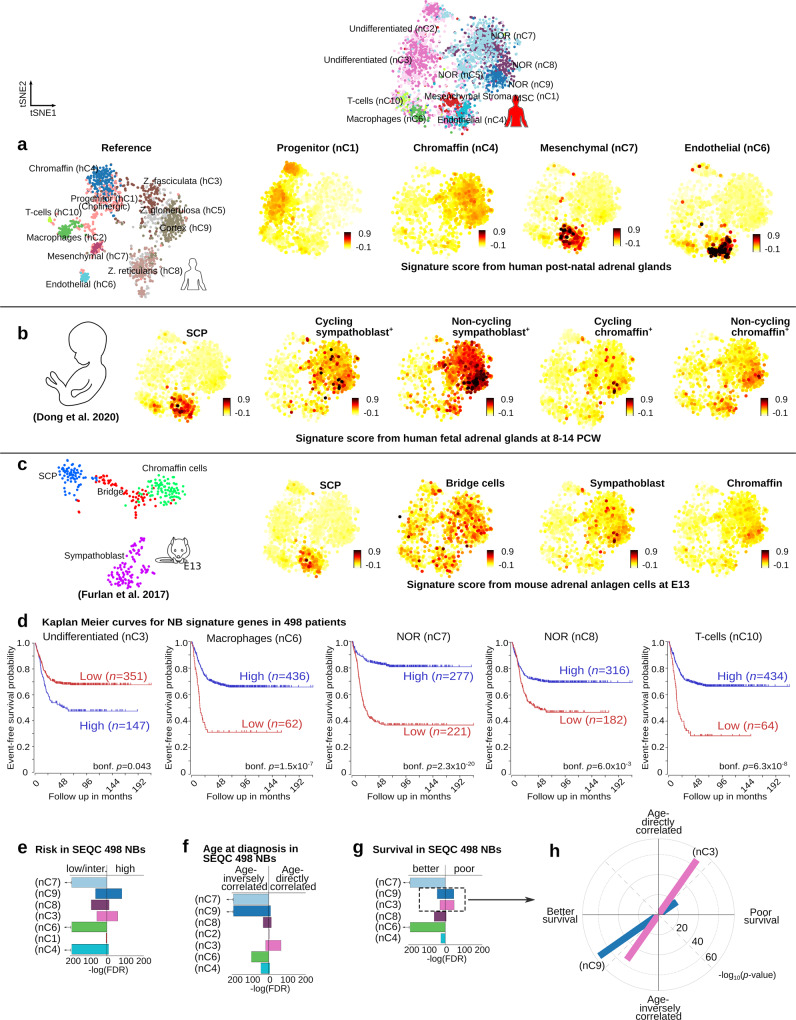
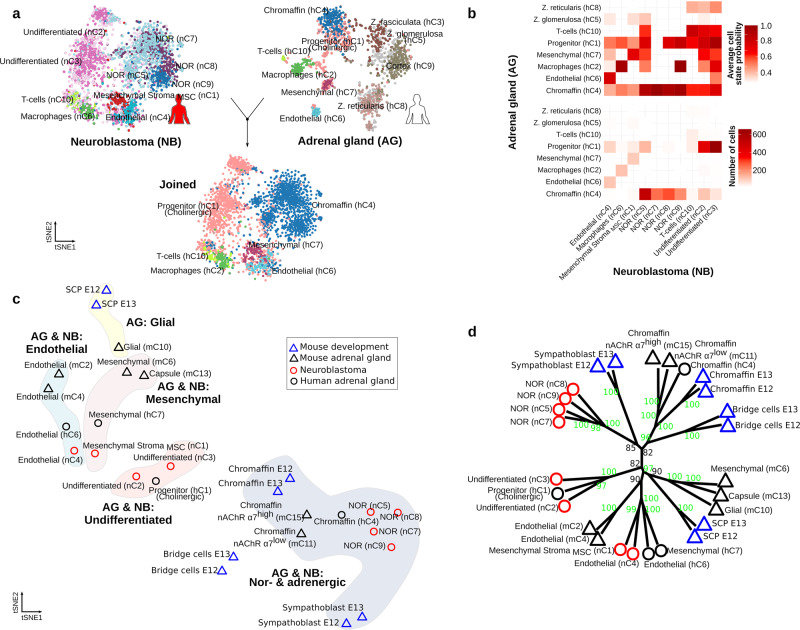
Childhood neuroblastoma has a remarkable variability in outcome. Age at diagnosis is one of the most important prognostic factors, with children less than 1 year old having favorable outcomes. Here we study single-cell and single-nuclei transcriptomes of neuroblastoma with different clinical risk groups and stages, including healthy adrenal gland. We compare tumor cell populations with embryonic mouse sympatho-adrenal derivatives, and post-natal human adrenal gland. We provide evidence that low and high-risk neuroblastoma have different cell identities, representing two disease entities. Low-risk neuroblastoma presents a transcriptome that resembles sympatho- and chromaffin cells, whereas malignant cells enriched in high-risk neuroblastoma resembles a subtype of TRKB+ cholinergic progenitor population identified in human post-natal gland. Analyses of these populations reveal different gene expression programs for worst and better survival in correlation with age at diagnosis. Our findings reveal two cellular identities and a composition of human neuroblastoma tumors reflecting clinical heterogeneity and outcome.


Conflict of interest statement

The authors declare no competing interests.

Figures

Fig. 1
Fig. 1. Anatomy of human and mouse adrenal gland (AG) revealed from single nuclei/cell analysis.
a 1536 single nuclei of human AG from three different patients were sequenced with Smart-seq2 to an average depth of 485,000 reads per cell. Cells with high-quality (n = 1322) were selected and further processed with PAGODA. Cells were grouped into ten different clusters, including cortex (in brown and gray colors), chromaffin (blue hC4), mesenchymal (purple hC7), endothelial (light blue hC6), and immune cells (i.e., T cells hC10 and macrophages hC2 in green colors). b 1920 single cell of mouse AG from five different samples were sequenced with Smart-seq2 to an average depth of 670,000 reads per cell. Cells with high-quality (n = 1763) were selected and further processed with PAGODA. Cells were grouped into nineteen different clusters, including cortex (in brown and gray colors), chromaffin (blue mC15 and light blue mC11), mesenchymal (red mC6), capsule (purple mC13), endothelial (light blue mC2 and mC4), glial (orange mC10), and immune cells (i.e., T cells mC17 and mC18, and macrophages mC3, mC8, and mC14 in green colors). Human and mouse adrenal glands zonation is illustrated in (c). c, d A comparison of the specific gene signature between human and mouse revealed similar transcription signatures for mesenchymal, endothelial, and immune clusters, nevertheless, the two different postnatal chromaffin cells could only be differentiated in mouse. d Hierarchical clustering of cells and expression of a panel of markers including noradrenergic (NOR), mesenchymal (MES), endothelial (Endot.), and migratory (Migrat.). eg A population of cells with a significant high expression of progenitor markers (i.e., SOX6, ERBB3, RTTN, FDR<0.01) and high differentiation potential found uniquely in human AG, is sourcing the chromaffin cells as indicated by velocity, entropy, and pseudotime analyses. h In this process, gene expression elapses from an undifferentiated stem-like- (i.e., RTTN+) to an adrenergic signature (PNMT+), passing by a noradrenergic stage (i.e., DBH+), as indicated by the pseudotime of the underlying cellular process. Results in (c), (e), and the top inserts in (d) and (h) represent cell clusters by color in (a).
Fig. 2
Fig. 2. Location of human cholinergic progenitor (NTRK2+ CLDN11+) and chromaffin (TH+) cells within the postnatal human adrenal gland (AG).
a tSNEs representing the expression of indicated genes in human cholinergic progenitor (pink) and chromaffin (blue) populations. The bars next to the tSNEs illustrate the expression measured as the logarithm of the read counts per 10,000. be Overview of tile-scanned images (×20) of postnatal human adrenal glands (AG) at indicated age. Scalebar of overview: 200 μm, zoom of boxed image: 10 μm. bd RNAscope in situ hybridization (ISH) for TH (green), CLDN11 (red), and NTRK2 (white) mRNA and counter stained with DAPI (blue). NTRK2+ CLDN11+ double positive cells were found in adrenal capsule and medulla exclusive from TH positive cells. e RNAscope ISH of a 4-year-old AG labeled with for TH (green), CHRNA7 (red), and CLDN11 (white) mRNA and nuclear counter-stain (DAPI) as indicated. For all RNAscope experiments, the signal distribution patterns and cell morphological features were shown by the different combination of probes and independently reproduced three times on different samples.
Fig. 3
Fig. 3. Intratumoral heterogeneity of childhood neuroblastoma (NB).
4224 single nuclei of human NB tumors were sequenced to an average depth of 676,000 reads per cell. a Cells with high-quality (n = 3212) were grouped into ten different clusters with PAGODA. NB risk groups, INSS stages, and samples are exemplified in (b). c Representation of the hierarchical clustering of cells: undifferentiated (light pink nC2 and pink nC3), mesenchymal stroma (MSC red nC1), endothelial (light blue nC4), T-cells (light green nC10), macrophages (green nC6), and noradrenergic (“NOR”, blue nC5, nC7, nC8, and nC9) and various markers of interest (also in insert d). The bars next to the tSNEs in (d) illustrate the expression measured as the logarithm of the read counts per 10,000. e, f Using a gene enrichment-based approach, the noradrenergic clusters of NB (nC5, nC7, nC8, and nC9) proved to share a significant number of upregulated genes with sympathetic noradrenergic and “ADR” (i.e., adrenergic) transcriptional signatures. Oppositely, the undifferentiated cluster nC3 shared a significant number of upregulated genes with neural-crest cell-like signature and MES (i.e., mesenchymal) signatures. g A comparison of the gene-specific signature of NB clusters with markers defining clusters in eight tumors previously sequenced with 10X, suggests a more significant similarity of the noradrenergic clusters (nC5, nC7, nC8, and nC9) with tumor clusters 1, 2, and 3; and of the undifferentiated nC3 cluster with the tumor cluster 3. Only clusters with the most significant similarities are displayed. h An analysis of the CNVs indicates a significant number of cells with rearrangements (indicated by red, Fisher exact tests) in the undifferentiated cluster nC3 for most samples, while a remarkable number of rearrangements was observed in fewer samples for the NOR (nC5), MSC (nC1), and undifferentiated nC2 clusters. i A subset of the predicted CNVs was validated for each sample, and illustrated in the tSNE for cells with an expected rearrangement (i.e., expected state) overlapping the validated region. Colors displayed in (e), (f), and (g) represent cell clusters by color in (a). An arrow next to the bar indicates a FDR < 1 × 10−50.
Fig. 4
Fig. 4. RNA in situ hybridization validating intratumoral heterogeneity in high-risk neuroblastoma stage 4.
Overview of tile-scanned images (20x) high-risk neuroblastoma (K10, MYCN amplified) using RNAscope in situ hybridization. Scalebar of overview: 500 μm; zoom of boxed image: 10 μm. a Tumor labeled with RNAscope ISH for TH (green), MYCN (red), and ALK (white) mRNA, and counter stained with DAPI (blue). Dashed circles indicate cells with large nuclei in a region (box #1), that are TH and MYCN positive, but negative for ALK. Box #2 indicates part of the tumor with majority of cells double positive for MYCN and ALK but negative for TH. Box #4 indicates cells negative for all probes: TH, MYCN, and ALK. b Adjacent section from (a) labeled for TH (green), NTRK1 (red), and NTRK2 (white). Box #1 indicate cells with large nuclei in a region that are TH+ and NTRK1+, and negative for NTRK2. Surrounding cells with small nuclei are positive for NTRK2 only. Box #2,3 visualizes tumor region with majority of cells positive for NTRK2 that are negative for TH and NTRK1. c Adjacent section stained for PDGFRA (green), LGR5 (red), and NTRK2 (white) mRNA is highlighting cells double positive for LGR5 and NTRK2 (box #1) or double positive for PDGRFA, NTRK2 (box #2). Box #3 indicates a region of the tumor that is positive for NTRK2 only. d Adjacent section stained for mesenchymal markers PDGFRA (green), CLDN11 (red), and LGR5 (white). Similar to c: some tumor regions (box #1) highlight cells double positive for CLDN11 (red) and LGR5 (white) that are negative for PDGFRA (box #1), as were other regions show cells that are double positive for PDGFRA (green) and CLDN11 (red) (box #2, 3, and 4). For all RNAscope experiments, the signal distribution patterns and cell morphological features were shown by the different combination of probes and independently reproduced three times on different samples in (a) and (b), and independently reproduced four times on different samples in (c) and (d).
Fig. 5
Fig. 5. Cell clusters from neuroblastoma and healthy postnatal human and mouse adrenal glands share expression signatures.
a Heatmap illustrating the normalized expression magnitude for selected genes organized following the hierarchical clustering (PAGODA) as shown in Figs. 1 and 3. bd Venn diagrams illustrating the significantly shared specific gene signature. Shared genes are listed in Supplementary Data 8. Indicated FDRs were calculated with a Benjamini–Hochberg correction on p-values obtained with Welch’s t-tests as detailed in the “Methods”. b Venn diagrams of human neuroblastoma clusters compared to adult mouse postnatal clusters, c embryonic mouse clusters previously described, and d human postnatal adrenal gland clusters. e Comparison of the specific signature from the human neuroblastoma clusters and the reported transcriptional signal for human fetal adrenal glands cell clusters (Dong et al.). An arrow next to the bar indicates a FDR < 1 × 10−50. +The original cluster annotations are currently debated and the included labels here correspond to those given by Kildisiute et al., and Bedoya-Reina and Schlisio. Colors displayed in (b), (c), (d), and (e) represent cell clusters by color in (a).
Fig. 6
Fig. 6. Cell clusters from neuroblastoma and developing human and mouse adrenal glands share distinct expression signatures, and their expression is associated with patient survival and age at diagnosis.
tSNE of neuroblastoma clusters illustrating the signature score of genes (as detailed in “Methods”) characterizing a human postnatal, b embryonic adrenal glands, and c mouse embryonic adrenal anlagen (E13) cell clusters. The bars next to the tSNEs in a, b, and c illustrate the scale of the signature score. A greater signature score indicates a larger transcriptional resemblance to the cluster of interest. SCP refers to the cluster of mouse multipotent Schwann cell precursors at E13; and Bridge refers to the cell cluster that defines transiting cells from SCP toward the chromaffin population at E13. d Kaplan–Meier curves for neuroblastoma clusters with significant differences (Bonferroni-corrected [bonf. p], log-rank tests in survival for 498 SEQC neuroblastoma patients with a low (red) and high (blue) signature gene expression. eg Using a gene enrichment-based approach (Benjamini–Hochberg corrected, Fisher’s exact tests), the specific signature genes for the noradrenergic nC7, nC8, and nC9, endothelial nC4, macrophages nC6, and undifferentiated nC3 clusters were found to be significantly upregulated in low- and intermediate (inter.)-risk patients and also in individuals with better survival. In contrast, the signature genes of noradrenergic nC9 and undifferentiated nC3 clusters presented a significantly enrichment in patients with high-risk and poor survival. The signature genes of the undifferentiated nC3 cluster presented also a remarkable significant correlation with age at diagnosis. h Signature genes associated with poor survival for noradrenergic nC9 and undifferentiated nC3 clusters are significantly correlated with age at diagnosis, and oppositely those associated with better survival are inversely correlated with age. Genes are included in Supplementary Data 9. A solid arrow next to the bar indicates a FDR < 1 × 10−50. Colors of bars displayed in (e), (f), (g), and (h) represent the neuroblastoma cell clusters by color in (a).
Fig. 7
Fig. 7. Commonalities in the transcriptional profile of cell populations in postnatal and developing human and mouse adrenal glands, and neuroblastoma.
a tSNE illustrating the projection of postnatal human adrenal gland cell clusters (i.e., states, reference top right) onto neuroblastoma (query top left), based on the detection of mutual nearest neighbor cell anchors (as detailed in “Methods”). Joint visualization of the neuroblastoma cell clustering (bottom) after cell classification with colors corresponding to the transferred adrenal gland cell states. b Heatmaps of the average probabilities of best matching reference states for each query cluster (i.e., average cell state probability, top), including number of cells (bottom). c tSNE using Euclidean distances in the quartile-normalized matrix of the average normalized expression from single-cell/nuclei sequenced cell populations from (A) human (i) neuroblastoma and (ii) adrenal gland, and (B) mouse (i) adrenal gland and (ii) derived adrenal anlagen at E12 and E13. Mesenchymal, endothelial, and neural-crest derived populations from human and mouse, adrenal gland, and neuroblastoma group accordingly to gene expression in (i) adrenergic and noradrenergic cells, (ii) undifferentiated cells, (iii) mesenchymal, and (iv) endothelial cells. d Hierarchical clustering of transcriptional similarities between cell clusters supported with unbiased p-values. Green numbers in the branches indicate a high support (i.e., unbiased p-value > 95) that has a lowest support at 0 and a highest at 100.

References

    1. Brodeur G. Neuroblastoma: biological insights into a clinical enigma. Nat. Rev. Cancer. 2003;3:203. doi: 10.1038/nrc1014. - DOI - PubMed
    1. Brodeur G, Bagatell R. Mechanisms of neuroblastoma regression. Nat. Rev. Clin. Oncol. 2014;11:704. doi: 10.1038/nrclinonc.2014.168. - DOI - PMC - PubMed
    1. Cohn S, et al. The International Neuroblastoma Risk Group (INRG) classification system: an INRG Task Force report. J. Clin. Oncol. 2009;10:289–297. doi: 10.1200/JCO.2008.16.6785. - DOI - PMC - PubMed
    1. Brodeur G, et al. Revisions of the international criteria for neuroblastoma diagnosis, staging, and response to treatment. J. Clin. Oncol. 1993;11:1466–1477. doi: 10.1200/JCO.1993.11.8.1466. - DOI - PubMed
    1. Moroz V, et al. Changes over three decades in outcome and the prognostic influence of age-at-diagnosis in young patients with neuroblastoma: a report from the International Neuroblastoma Risk Group Project. Eur. J. Cancer. 2011;47:561–571. doi: 10.1016/j.ejca.2010.10.022. - DOI - PubMed

Publication types

MeSH terms