. 2021 Sep 7;11(1):17741.
doi: 10.1038/s41598-021-97129-2.

Genotypes of informative loci from 1000 Genomes data allude evolution and mixing of human populations

Affiliations

Genotypes of informative loci from 1000 Genomes data allude evolution and mixing of human populations

Sridevi Padakanti et al. Sci Rep. .

Abstract

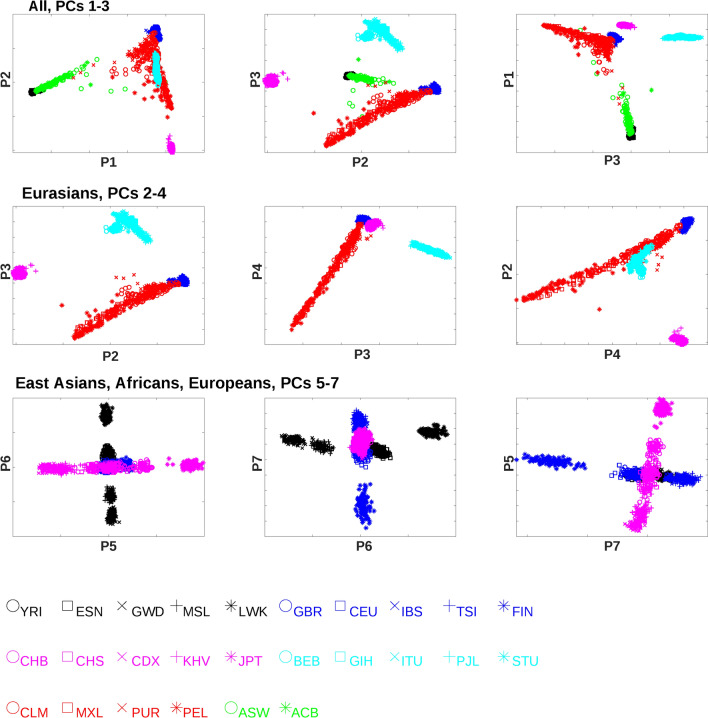
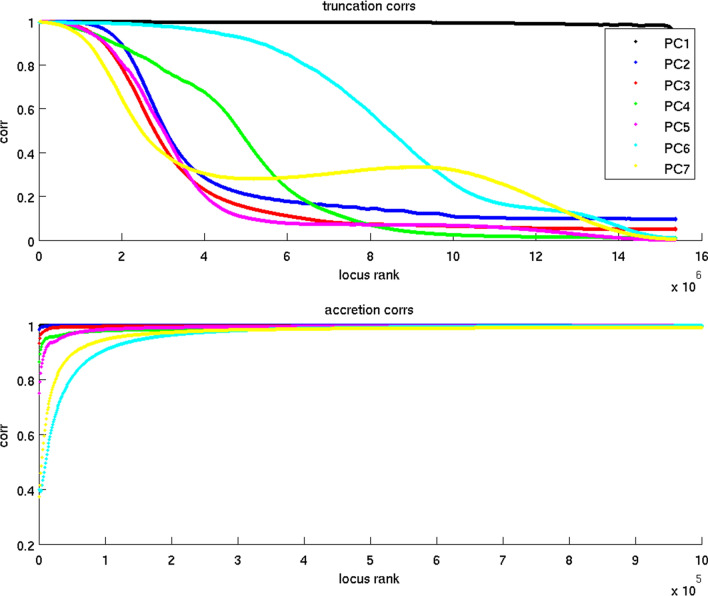
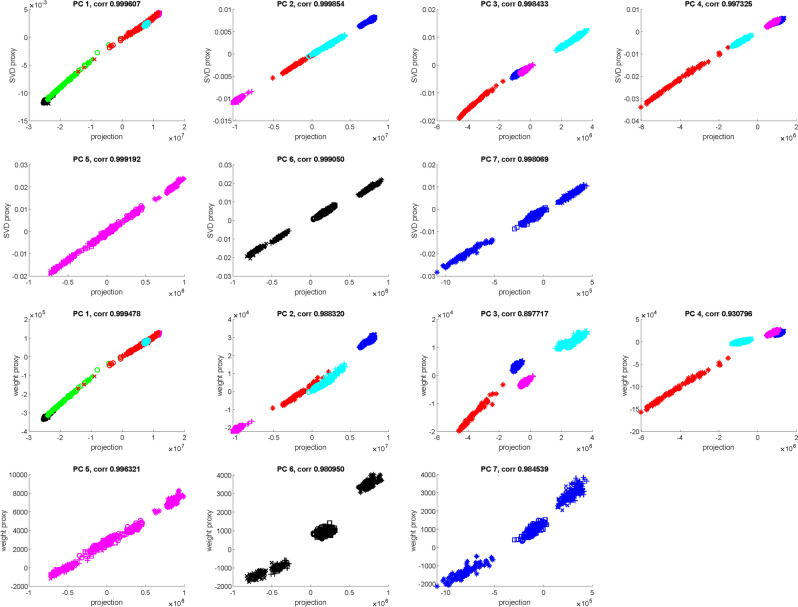
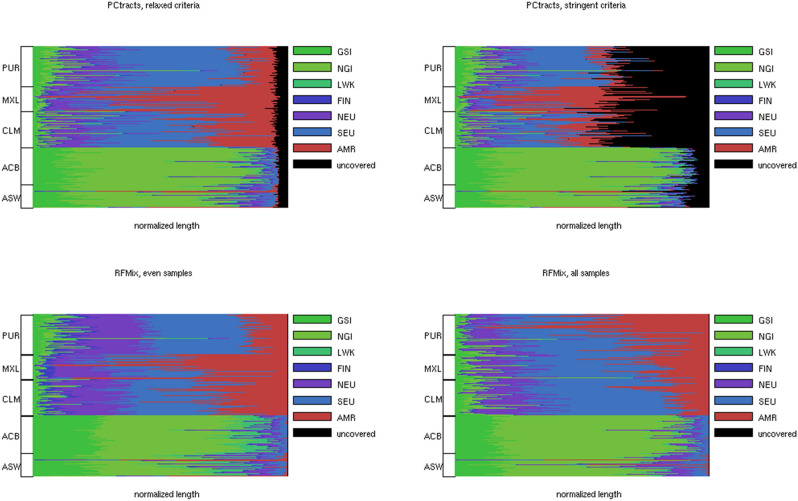
Principal Component Analysis (PCA) projects high-dimensional genotype data into a few components that discern populations. Ancestry Informative Markers (AIMs) are a small subset of SNPs capable of distinguishing populations. We integrate these two approaches by proposing an algorithm to identify necessary informative loci whose removal from the data deteriorates the PCA structure. Unlike classical AIMs, necessary informative loci densely cover the genome, hence can illuminate the evolution and mixing history of populations. We conduct a comprehensive analysis to the genotype data of the 1000 Genomes Project using necessary informative loci. Projections along the top seven principal components demarcate populations at distinct geographic levels. Millions of necessary informative loci along each PC are identified. Population identities along each PC are approximately determined by weighted sums of minor (or major) alleles over the informative loci. Variations of allele frequencies are aligned with the history and direction of population evolution. The population distribution of projections along the top three PCs is recapitulated by a simple demographic model based on several waves of founder population separation and mixing. Informative loci possess locational concentration in the genome and functional enrichment. Genes at two hot spots encompassing dense PC 7 informative loci exhibit differential expressions among European populations. The mosaic of local ancestry in the genome of a mixed descendant from multiple populations can be inferred from partial PCA projections of informative loci. Finally, informative loci derived from the 1000 Genomes data well predict the projections of an independent genotype data of South Asians. These results demonstrate the utility and relevance of informative loci to investigate human evolution.


Conflict of interest statement

The authors declare no competing interests.

Figures

Figure 1
Figure 1
Projections of 1000 Genomes subjects along the top 7 PCs. Two-dimensional views. The top row shows all populations along PCs 1–3. The middle row shows Eurasian and Latin American populations along PCs 2–4. The bottom row shows East Asian, African and European populations along PCs 5–7 respectively. Figure generated by Matlab version 8.3.0.532 (www.mathworks.com).
Figure 2
Figure 2
Correlation coefficients between full and approximated projection values along each PC. Top: incrementally truncate top and bottom ranking loci. Bottom: incrementally add top and bottom ranking loci. Figure generated by Matlab version 8.3.0.532 (www.mathworks.com).
Figure 3
Figure 3
On PCs 1–7, compare the full projections using all loci (x axis) with the partial projections using SVD loadings of selected informative loci (y axis, top 7 panels), as well as the proxy projections using allele frequency weights of selected informative loci (y axis, bottom 7 panels). Figure generated by Matlab version 8.3.0.532 (www.mathworks.com).
Figure 4
Figure 4
Fractions of homozygote major (x axis) and minor (y axis) alleles among the selected 200,000 informative loci and subjects from selected populations. Each dot indicates the combination of homozygote major and minor allele fractions in a subject. Each panel displays the distributions along each PC in a positive (top 100,000 informative loci) or negative (bottom 100,000 informative loci) group. Figure generated by Matlab version 8.3.0.532 (www.mathworks.com).
Figure 5
Figure 5
The PC projections and homozygote major and minor allele fractions of the simulation outcomes from a five-population model depicted in the text. The left panels display the two-dimensional projections of PCs 1–3. The middle panels display the homozygote major and minor allele fractions for the positive (top-ranking) loci along PCs 1–3. The right panels display the homozygote major and minor allele fractions for the negative (bottom-ranking) loci along PCs 1–3. Figure generated by Matlab version 8.3.0.532 (www.mathworks.com).
Figure 6
Figure 6
Tract length proportions from each reference population on each mixed subject using four methods of local ancestry inference. Each horizontal row displays the tract length proportions of the reference populations in a mixed subject. Black bars indicate the length proportions of the tracts without population label assignments. The mixed subjects are grouped into 5 populations. The top left and top right panels visualize the results using two alternative criteria (relaxed and stringent) to combine the inferred tracts from multiple PCs. The bottom left and bottom right panels visualize the results from RFMix by equalizing the sizes of the three continental-level reference populations and by including all subjects from the three continental-level reference populations. Figure generated by Matlab version 8.3.0.532 (www.mathworks.com).

Similar articles

Cited by

References

    1. Cavalli-Sforza LL, et al. The History and Geography of Human Genes. Princeton University Press; 1994.
    1. Patterson N, et al. Population structure and eigenanalysis. PLoS Genet. 2006;2(12):2074–2093. doi: 10.1371/journal.pgen.0020190. - DOI - PMC - PubMed
    1. Yang WY, et al. A model-based approach for analysis of spatial structure in genetic data. Nat. Genet. 2012;44(6):725–730. doi: 10.1038/ng.2285. - DOI - PMC - PubMed
    1. Lazaridis I, et al. Ancient human genomes suggest three ancestral populations for present-day Europeans. Nature. 2014;513:409–413. doi: 10.1038/nature13673. - DOI - PMC - PubMed
    1. Ruegg K, et al. Ecological genomics predicts climate vulnerability in an endangered southwestern songbird. Ecol. Lett. 2018;21(7):1085–1096. doi: 10.1111/ele.12977. - DOI - PubMed

Publication types