. 2021 Sep;53(9):1290-1299.
doi: 10.1038/s41588-021-00924-w. Epub 2021 Sep 6.

A compendium of uniformly processed human gene expression and splicing quantitative trait loci

Affiliations

A compendium of uniformly processed human gene expression and splicing quantitative trait loci

Nurlan Kerimov et al. Nat Genet. 2021 Sep.

Abstract

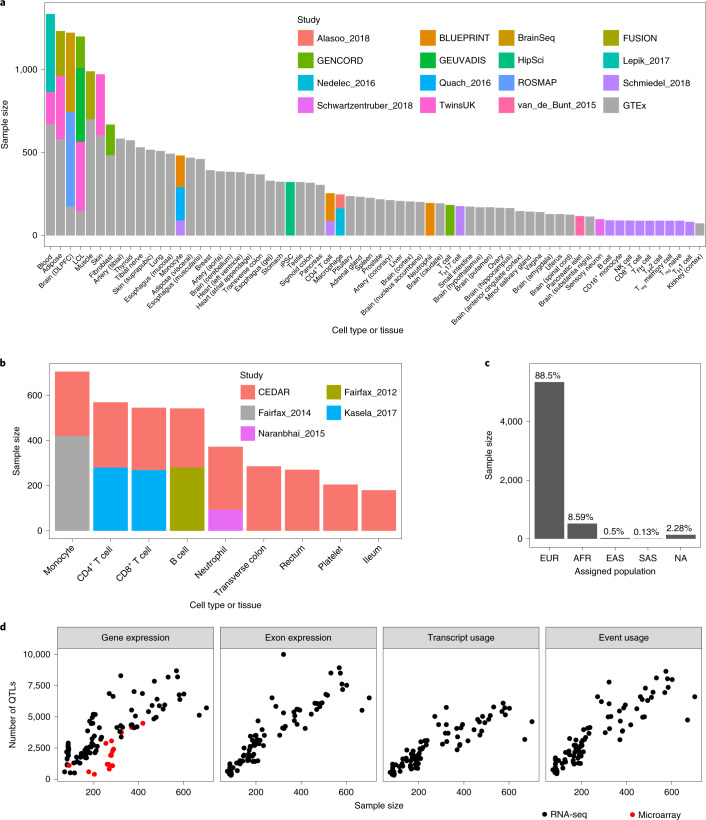
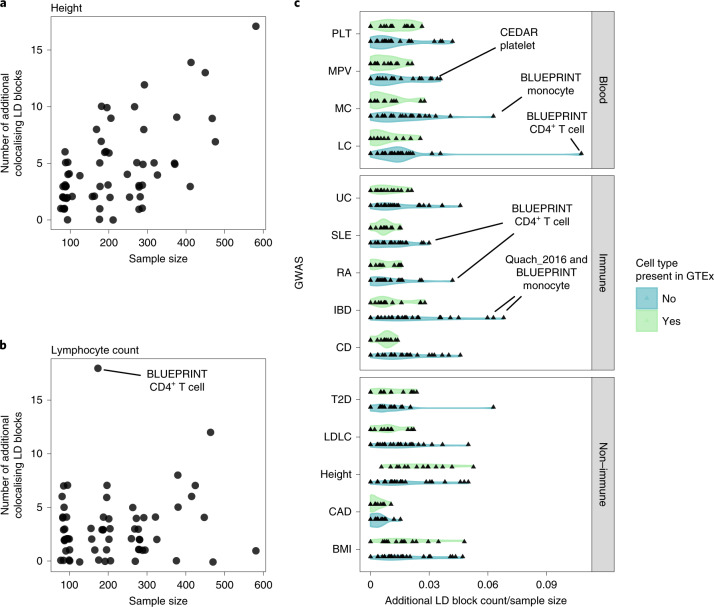
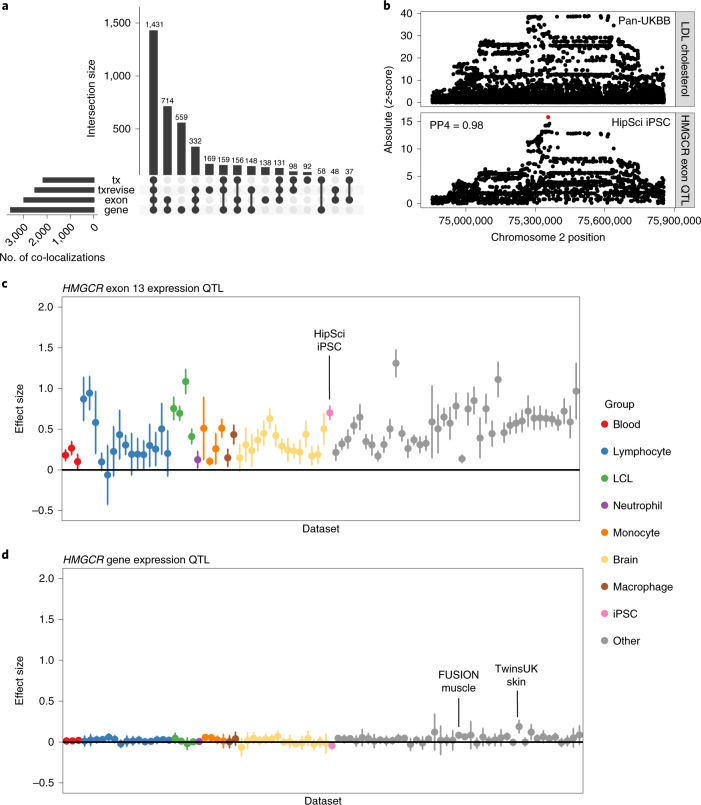
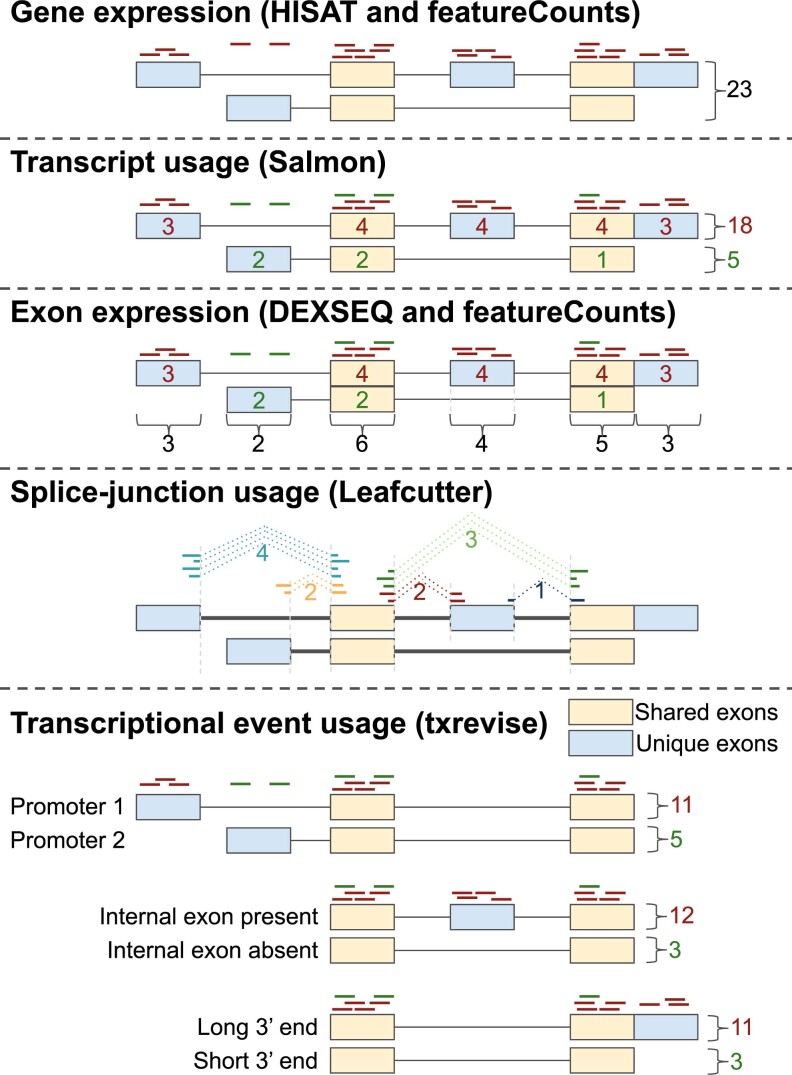
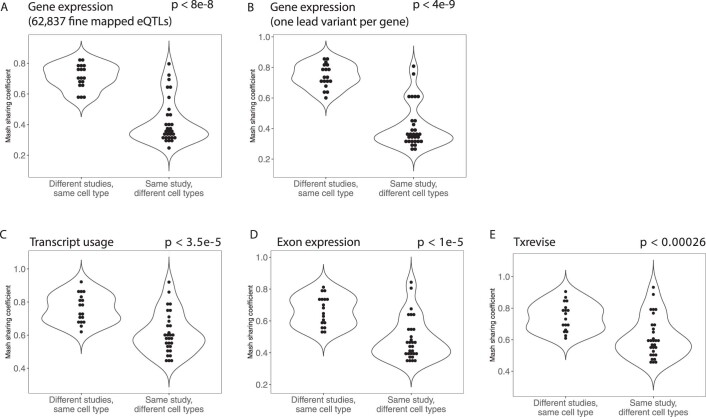
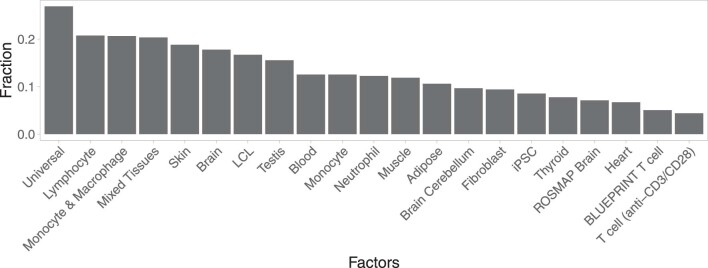
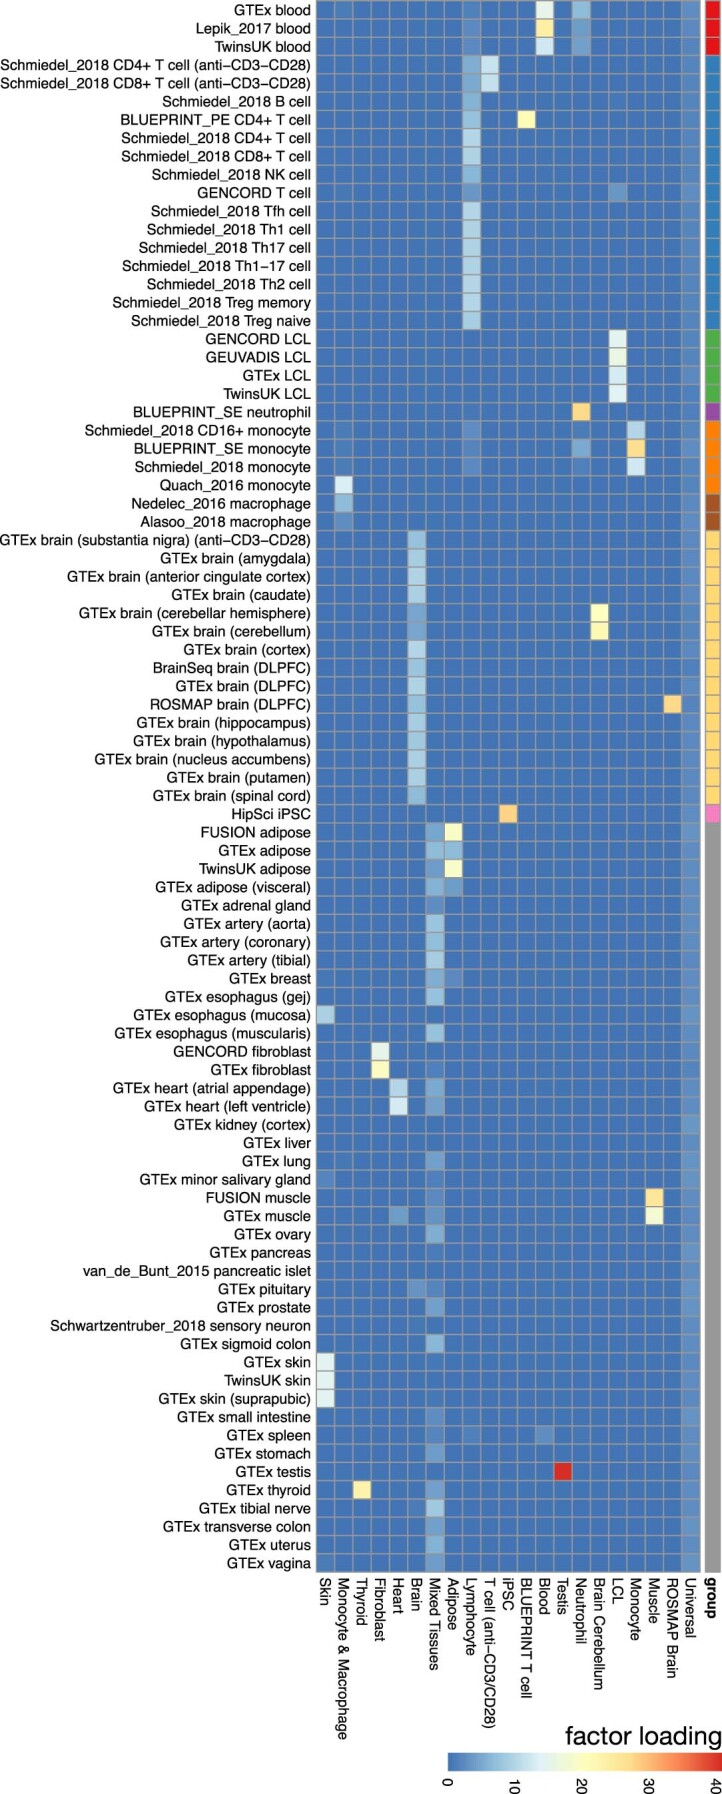
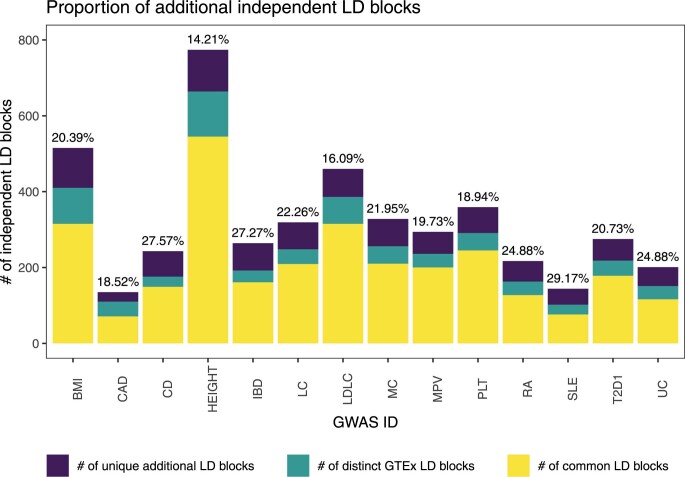
Many gene expression quantitative trait locus (eQTL) studies have published their summary statistics, which can be used to gain insight into complex human traits by downstream analyses, such as fine mapping and co-localization. However, technical differences between these datasets are a barrier to their widespread use. Consequently, target genes for most genome-wide association study (GWAS) signals have still not been identified. In the present study, we present the eQTL Catalogue ( https://www.ebi.ac.uk/eqtl ), a resource of quality-controlled, uniformly re-computed gene expression and splicing QTLs from 21 studies. We find that, for matching cell types and tissues, the eQTL effect sizes are highly reproducible between studies. Although most QTLs were shared between most bulk tissues, we identified a greater diversity of cell-type-specific QTLs from purified cell types, a subset of which also manifested as new disease co-localizations. Our summary statistics are freely available to enable the systematic interpretation of human GWAS associations across many cell types and tissues.


Conflict of interest statement

Since April 2021, D.R.Z. has been a full-time employee of Mosaic Therapeutics, UK. The other authors declare no competing interests.

Figures

Fig. 1
Fig. 1. Overview of the eQTL Catalogue database.
a, A high-level representation of the uniform data harmonization and eQTL mapping process. Extended Data Fig. 1 provides a schematic illustration of the different quantification methods. b, The eQTL Catalogue summary results for the RBMS1 gene in BLUEPRINT CD4+ T cells, viewed via the Ensembl Genome Browser.
Fig. 2
Fig. 2. Overview of studies and samples included in the eQTL Catalogue.
a, Cumulative RNA-seq sample size for each cell type and tissue across 16 studies. Datasets from stimulated conditions have been excluded to improve readability. DLPFC, dorsolateral prefrontal cortex; NK cell, natural killer cell; TFH cell, follicular helper T cell; TH cell, helper T cell; Treg, regulatory T cell. b, The cumulative microarray sample size for each cell type and tissue across five studies. Datasets from stimulated conditions have been excluded to improve readability. c, The number of unique donors assigned to the four major superpopulations in the 1000 Genomes phase 3 reference dataset. Detailed assignment of donors to the four superpopulations in each study is presented in Supplementary Table 1. Superpopulation codes: EUR, Europe; AFR, Africa; EAS, east Asia; SAS, south Asia; NA, unassigned. d, The relationship between the sample size of each dataset and the number of associations detected with each quantification method. The number of QTLs on the y axis is defined as the number of genes with at least one significant QTL (FDR < 0.05).
Fig. 3
Fig. 3. Gene expression similarity between datasets predicts eQTL similarity.
a, MDS analysis of median gene expression across datasets. The pairwise similarity between datasets was calculated using Pearson’s correlation. Datasets from GTEx and BLUEPRINT studies have been highlighted to demonstrate that they cluster with other matching cell types and tissues. b, MDS analysis of eQTL sharing across datasets. Pairwise eQTL sharing between datasets was estimated using the Mash model. The complete matrix is presented in Extended Data Fig. 2. c, Visualization of eQTL-sharing estimates between selected representative tissues (x axis) and all other cell types and tissues in the eQTL Catalogue. The individual points have been colored according to the major cell type and tissue groups from a. d, Matrix factorization of the eQTL effect sizes across all eQTL Catalogue datasets. The heatmap represents the loadings of 21 latent factors in each of the 86 naive datasets. Nine datasets from stimulated macrophages and monocytes have been excluded to improve legibility. The version of this heatmap with dataset labels is shown in Extended Data Fig. 7.
Fig. 4
Fig. 4. CD4+ T-cell-specific eQTL (rs7420451) at the RBMS1 locus co-localizes with a GWAS hit for lymphocyte count.
a, Variation in the RBMS1 eQTL effect size across all eQTL Catalogue datasets (naive conditions only). The points represent the eQTL effect size estimates from the linear model, and the error bars represent 95% confidence intervals. Two CD4+ T-cell datasets (BLUEPRINT, n = 169; Schmiedel_2018, n = 88) have been highlighted. Sample sizes for other datasets are presented on Fig. 2a and in Supplementary Table 2. b, Factor loadings for the RBMS1 lead variant (rs7420451) from the sn-spMF model. c, Regional association plot for lymphocyte count (top) and RBMS1 eQTL in the BLUEPRINT CD4+ T cells (bottom). The fine-mapped eQTL credible set is highlighted in red. d, Co-localization posterior probabilities between lymphocyte count and RBMS1 expression in the region surrounding the RBMS1 eQTL lead variant (rs7420451) across all eQTL Catalogue datasets. PP4 represents a shared causal variant whereas PP3 represents two distinct causal variants.
Fig. 5
Fig. 5. Overview of the novel GWAS co-localizations detected in the eQTL Catalogue but not in any of the GTEx tissues.
a, The number of new height GWAS loci that co-localize with eQTLs in each cell type or tissue as a function of eQTL dataset size. b, The number of new lymphocyte count GWAS loci that co-localize with eQTLs in each cell type or tissue as a function of eQTL dataset size. c, The number of new co-localizing loci detected for the 14 GWAS traits in each cell type and tissue from the eQTL Catalogue divided by the eQTL sample sizes. The eQTL Catalogue cell types and tissues were grouped according to whether they were present in GTEx (blood, LCLs, adipose, muscle, skin and brain) or not (T cells, B cells, monocytes, macrophages, neutrophils and iPSCs). GWAS traits: PLT, MPV, MC, LC, UC, SLE, RA, IBD, CD, T2D, height, CAD, BMI and LDLC. The same analysis for the other three quantification methods is presented in Extended Data Fig. 9.
Fig. 6
Fig. 6. Co-localization between transcript-level QTLs and complex traits.
a, Complex trait co-localizations (independent LD blocks) stratified by the quantification methods with which they were detected. In addition to gene-level eQTLs, we also used three transcript-level quantification methods (exon expression (exon); transcript usage (tx); and promoter, splicing and 3ʹ-end usage events (txrevise)). b, Regional association plot for LDL-cholesterol (top panel) and HMGCR exon 13 QTL in the HipSci iPSC dataset. SuSiE fine mapped the exon QTL to a single intronic variant (rs3846662, represented by the red dot), which was missing from the GWAS summary statistics. c, Variation in the HMGCR exon 13 expression QTL (rs3846662) effect sizes across eQTL Catalogue datasets. The points represent the eQTL effect size estimates from the linear model, and the error bars represent 95% confidence intervals. The HipSci iPSC dataset (n = 322) has been highlighted. d, Variation in the HMGCR gene expression QTL (rs3846662) effect sizes across eQTL Catalogue datasets. The points represent the eQTL effect size estimates from the linear model, and the error bars represent 95% confidence intervals. FUSION muscle (n = 288) and TwinsUK skin (n = 370) datasets have been highlighted. Sample sizes for other datasets are presented on Fig. 2a and in Supplementary Table 2.
Extended Data Fig. 1
Extended Data Fig. 1. Quantification methods for molecular traits in the eQTL Catalogue.
Symbolic representation of 23 read fragments assigned to one gene (aligned with HISAT2, quantified with featureCounts) consisting of two transcripts (quantified with Salmon) and six exonic parts (annotated with DEXSeq, quantified with featureCounts). The gene also has five distinct introns which are identified and quantified by Leafcutter. Transcriptional event usage is quantified with txrevise. Txrevise uses shared exons as a scaffold to identify independent transcriptional events corresponding to alternative promoters, internal exons and 3ʹ ends. Leafcutter splice junction QTLs will be included in a future version of the eQTL Catalogue.
Extended Data Fig. 2
Extended Data Fig. 2. Pairwise eQTL sharing between 95 datasets estimated with the Mash model.
We used 62,837 independent gene variant pairs from the fine mapping analysis (see Methods) and used the Mash model to estimate eQTL sharing between all pairs of the 95 datasets measured with RNA-seq. Heatmap represents the fraction of eQTLs ‘shared’ (same sign and effect size difference < 2-fold) between all pairs of datasets.
Extended Data Fig. 3
Extended Data Fig. 3. Pairwise eQTL similarity between 95 datasets estimated with Spearman correlation.
We used 62,837 independent gene-variant pairs from the fine mapping analysis (see Methods) and used the Spearman correlation of eQTL effect sizes to estimate eQTL sharing between all pairs of the 95 datasets measured with RNA-seq. Heatmap represents the pairwise Spearman correlation estimates between fine mapped eQTL effect sizes.
Extended Data Fig. 4
Extended Data Fig. 4. MDS analysis of QTL sharing across datasets.
Pairwise QTL sharing between datasets was estimated using the Mash model. The individual points have been coloured according to the major cell type and tissue groups. To facilitate comparison between quantification methods, and avoid redundant signals from correlated transcripts and exons, all analyses have been performed using one lead variant per gene (see Methods). The panels show pairwise QTL sharing MDS plots for gene expression (a), exon expression (b), transcript usage (c), and txrevise (d) QTLs.
Extended Data Fig. 5
Extended Data Fig. 5. Quantifying QTL sharing between tissues, cell types and studies.
Distribution of pairwise mash QTL sharing estimates for seven cell types and tissues (skin, adipose, LCL, blood, fibroblast, muscle, brain (DLPFC)) profiled in two or more studies (GTEx, TwinsUK, GENCORD, GEUVADIS, Lepik_2017, ROSMAP, FUSION). Each panel contrasts the QTL sharing estimates for the same cell type or tissue profiled in different studies (n = 18) against different cell types and tissues profiled in the same study (n = 30). Analysis was performed separately for gene expression (a-b), transcript usage (c), exon expression (d) and txrevise (e) QTLs. Note that adipose, skin and muscle tissues have high eQTL sharing also within the same study. The p-values were calculated using the two-sample Wilcoxon rank sum test (two-sided).
Extended Data Fig. 6
Extended Data Fig. 6. The fraction of fine mapped eQTLs assigned to universal and cell-type-specific factors.
The sn-spMF method was used to assign all fine mapped eQTLs to the 21 latent factors inferred from the data.
Extended Data Fig. 7
Extended Data Fig. 7. Factor loadings for each of the 86 naive datasets across 21 latent factors detected by sn-spMF.
Datasets from stimulated monocytes and macrophages have been excluded to improve readability.
Extended Data Fig. 8
Extended Data Fig. 8. The number of shared and additional colocalisations detected for the 14 GWAS traits and diseases.
The cumulative heights of the bars indicate the number of independent colocalising loci (LD blocks) detected for each GWAS trait and the percentages represent the fraction of those colocalisation that were unique to the eQTL Catalogue datasets relative to GTEx.
Extended Data Fig. 9
Extended Data Fig. 9. The number of additional colocalising loci detected for the 14 GWAS traits in each cell type and tissue from eQTL Catalogue divided by the eQTL sample sizes.
The analysis was done independently for exon QTLs (a), transcript usage QTLs (b) and txrevise QTLs (c). The eQTL Catalogue cell types and tissues were grouped according to whether they were present in GTEx (blood, LCL, adipose, muscle, skin, brain) or not (T cells, B cells, monocytes, macrophages, neutrophils and iPSCs). GWAS traits: PLT - platelet count, MPV - mean platelet volume, MC - monocyte count, LC - lymphocyte count, UC - ulcerative colitis, SLE - systemic lupus erythematosus, RA - rheumatoid arthritis, IBD - inflammatory bowel disease, CD - Crohn’s disease, T2D - type 2 diabetes, height, CAD - coronary artery disease, BMI - body mass index, LDLC - LDL cholesterol.
Extended Data Fig. 10
Extended Data Fig. 10. Regional association plot for LDL cholesterol (top panel) and HMGCR eQTL in the FUSION muscle dataset (bottom panel).
The eQTL signal was fine mapped to 46 variants represented by red dots on both panels.

References

    1. The GTEx Consortium. The GTEx Consortium atlas of genetic regulatory effects across human tissues. Science369, 1318–1330 (2020). - PMC - PubMed
    1. Võsa, U. et al. Unraveling the polygenic architecture of complex traits using blood eQTL meta-analysis. Preprint at bioRxiv10.1101/447367 (2018).
    1. Barbeira, A. N. et al. Exploiting the GTEx resources to decipher the mechanisms at GWAS loci. Preprint at bioRxiv10.1101/814350 (2020). - PMC - PubMed
    1. Yao DW, O’Connor LJ, Price AL, Gusev A. Quantifying genetic effects on disease mediated by assayed gene expression levels. Nat. Genet. 2020;52:626–633. doi: 10.1038/s41588-020-0625-2. - DOI - PMC - PubMed
    1. Umans BD, Battle A, Gilad Y. Where are the disease-associated eQTLs? Trends Genet. 2021;37:109–124. doi: 10.1016/j.tig.2020.08.009. - DOI - PMC - PubMed

Publication types

MeSH terms