. 2021 Sep;53(9):1348-1359.
doi: 10.1038/s41588-021-00920-0. Epub 2021 Sep 6.

Genomic and evolutionary classification of lung cancer in never smokers

Affiliations

Genomic and evolutionary classification of lung cancer in never smokers

Tongwu Zhang et al. Nat Genet. 2021 Sep.

Abstract

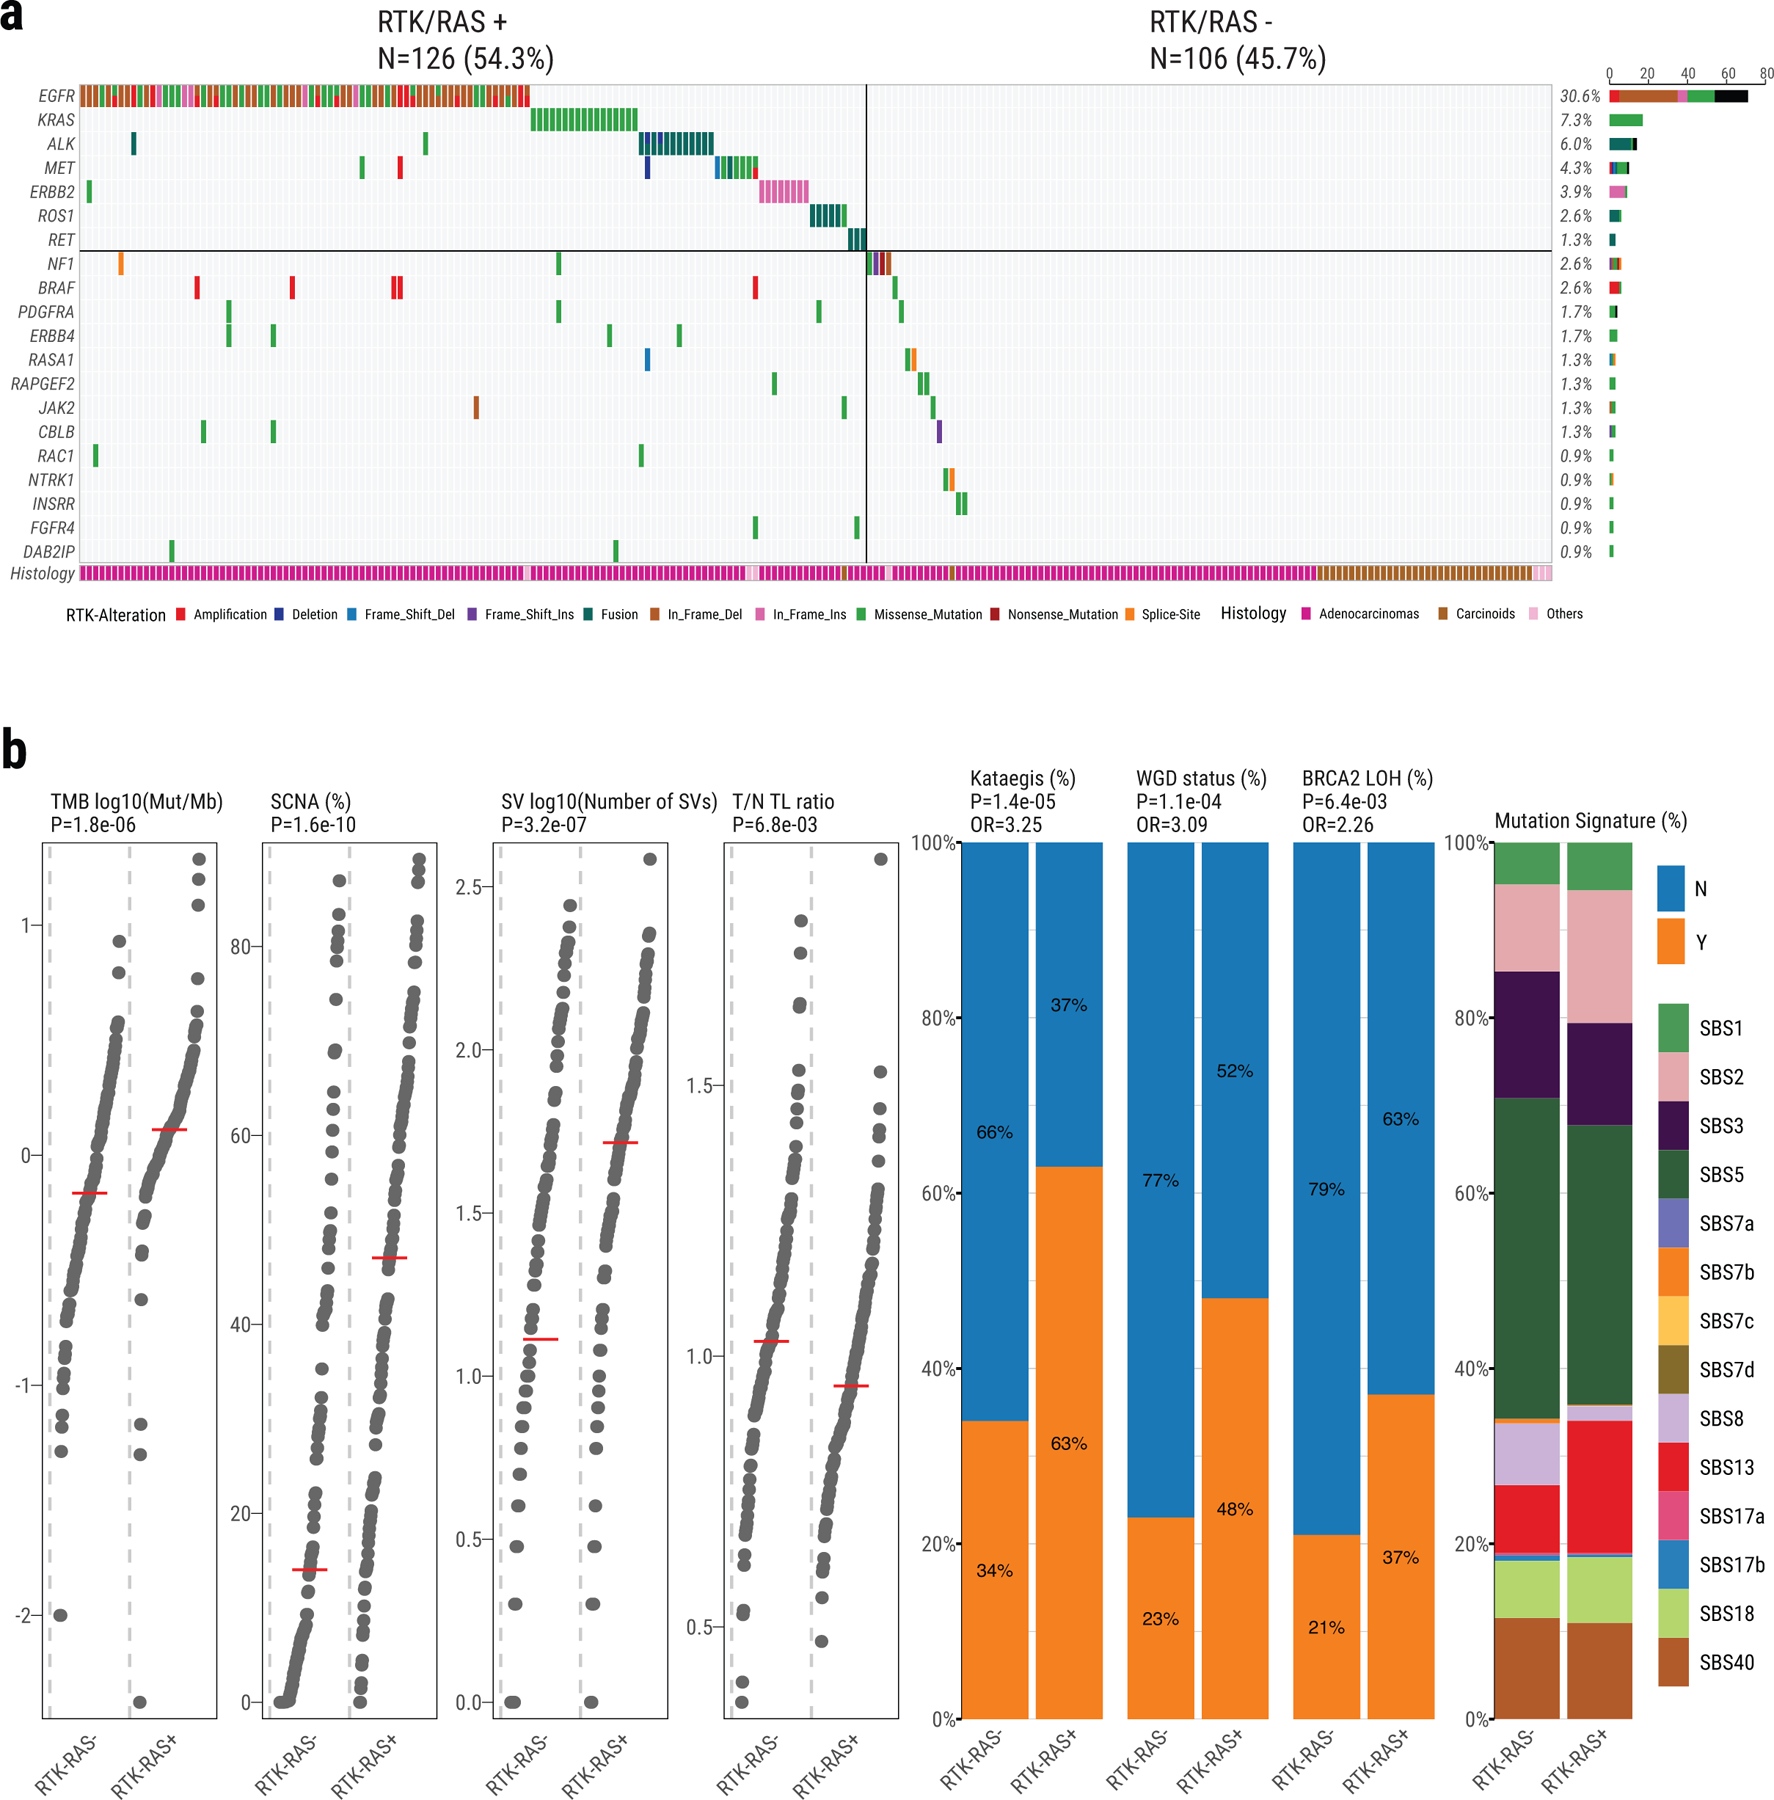
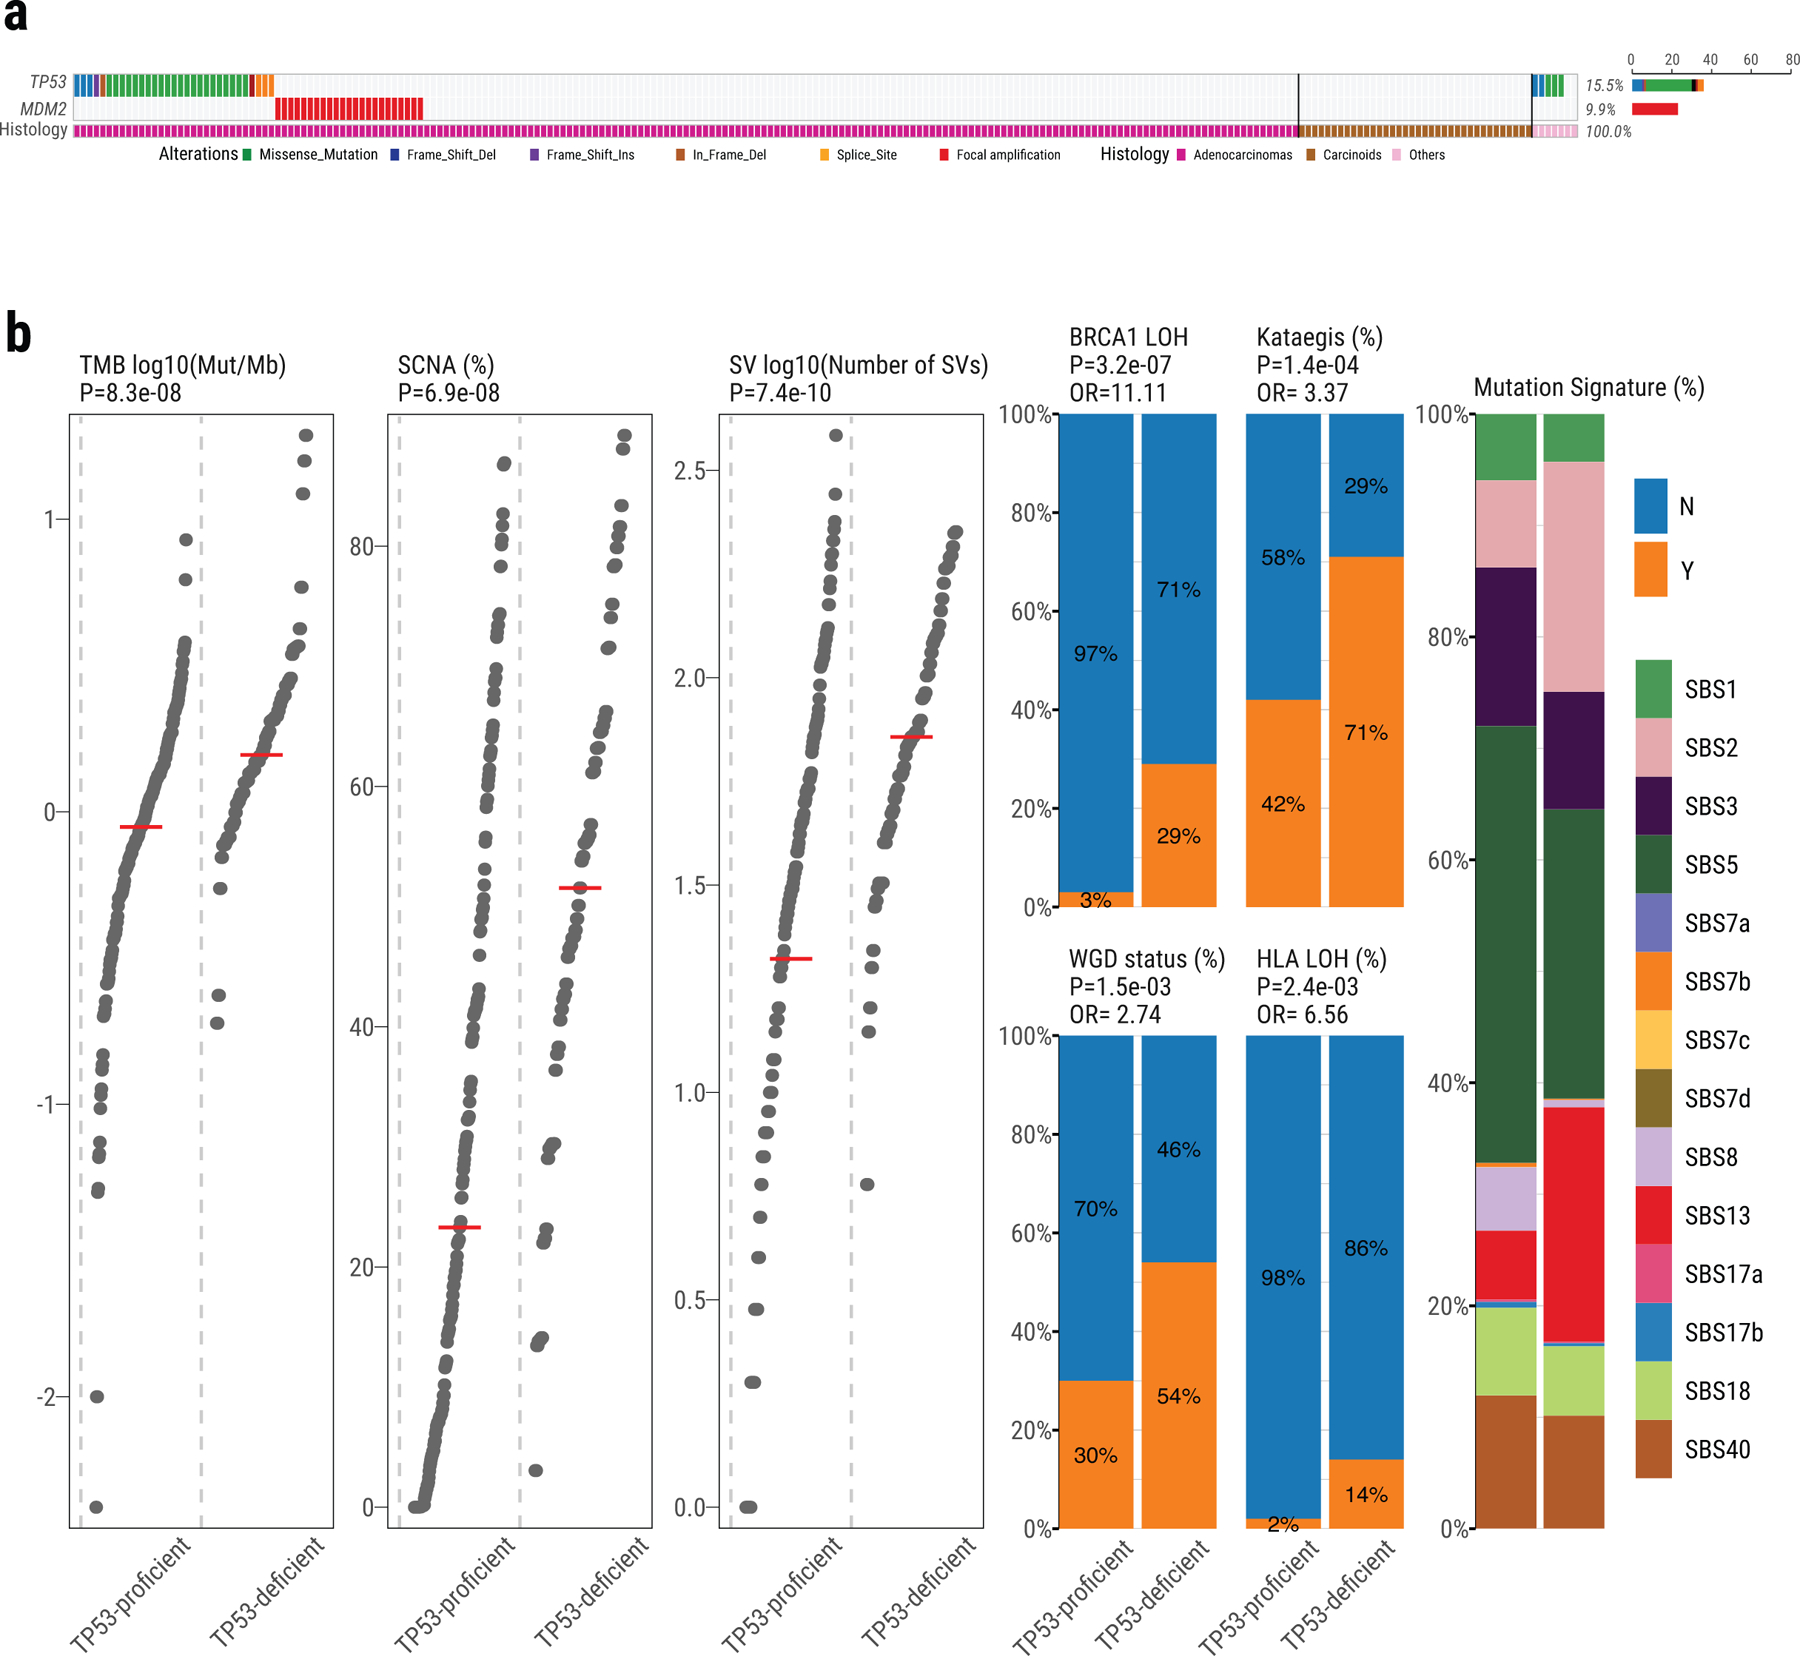
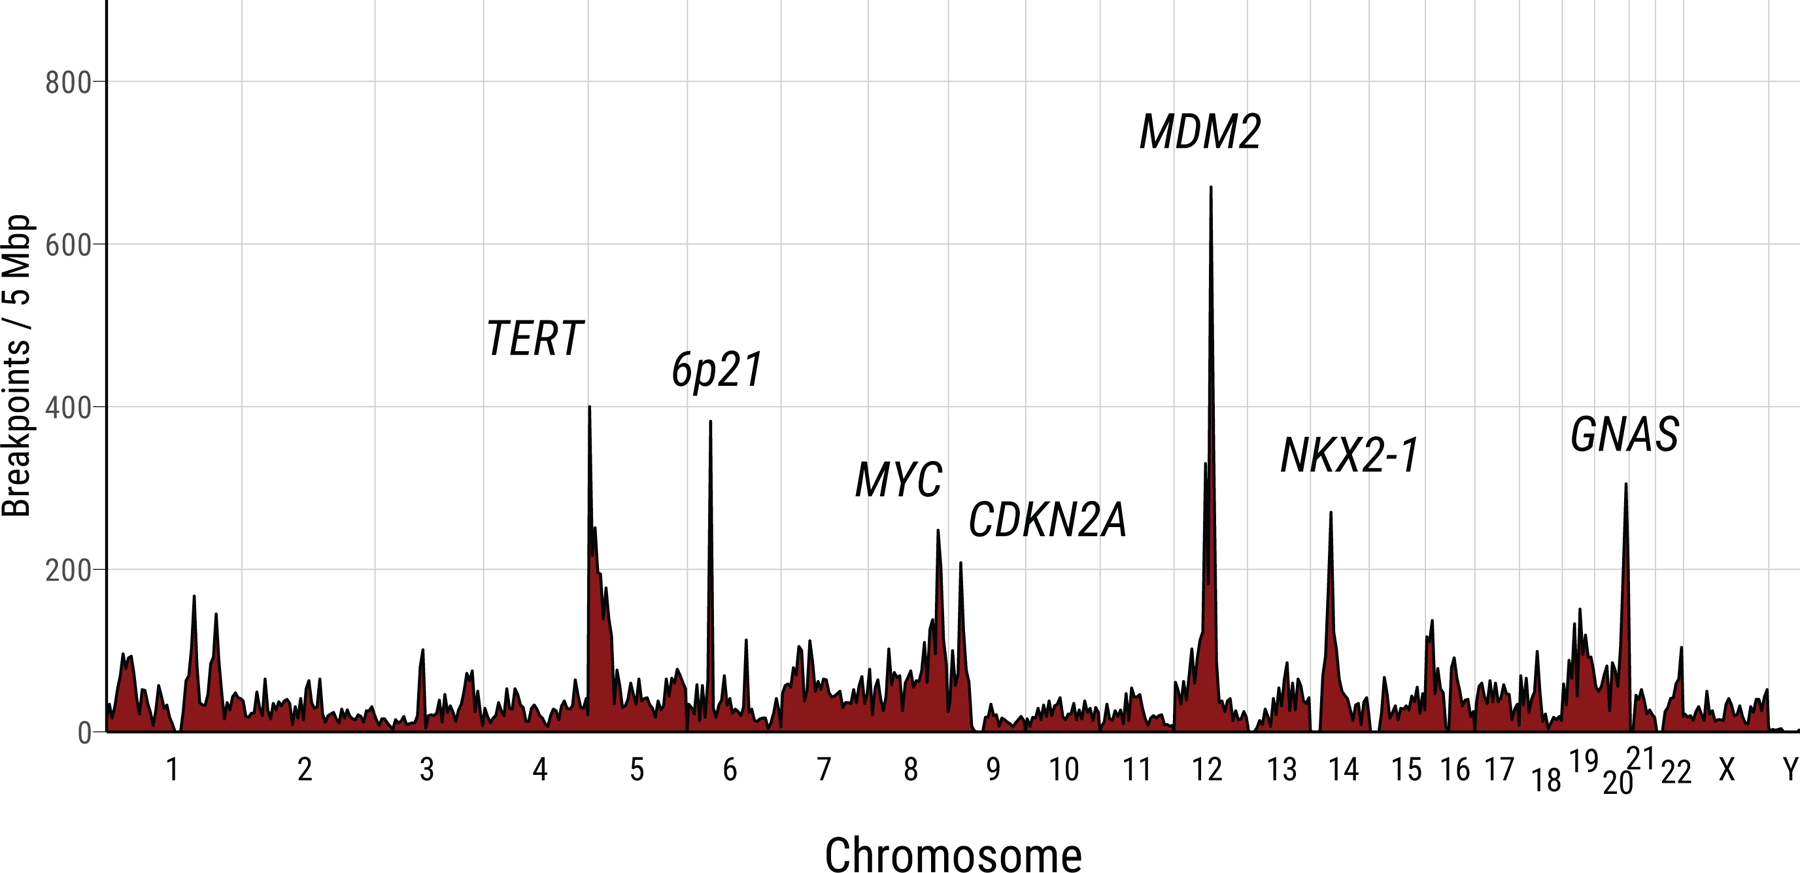
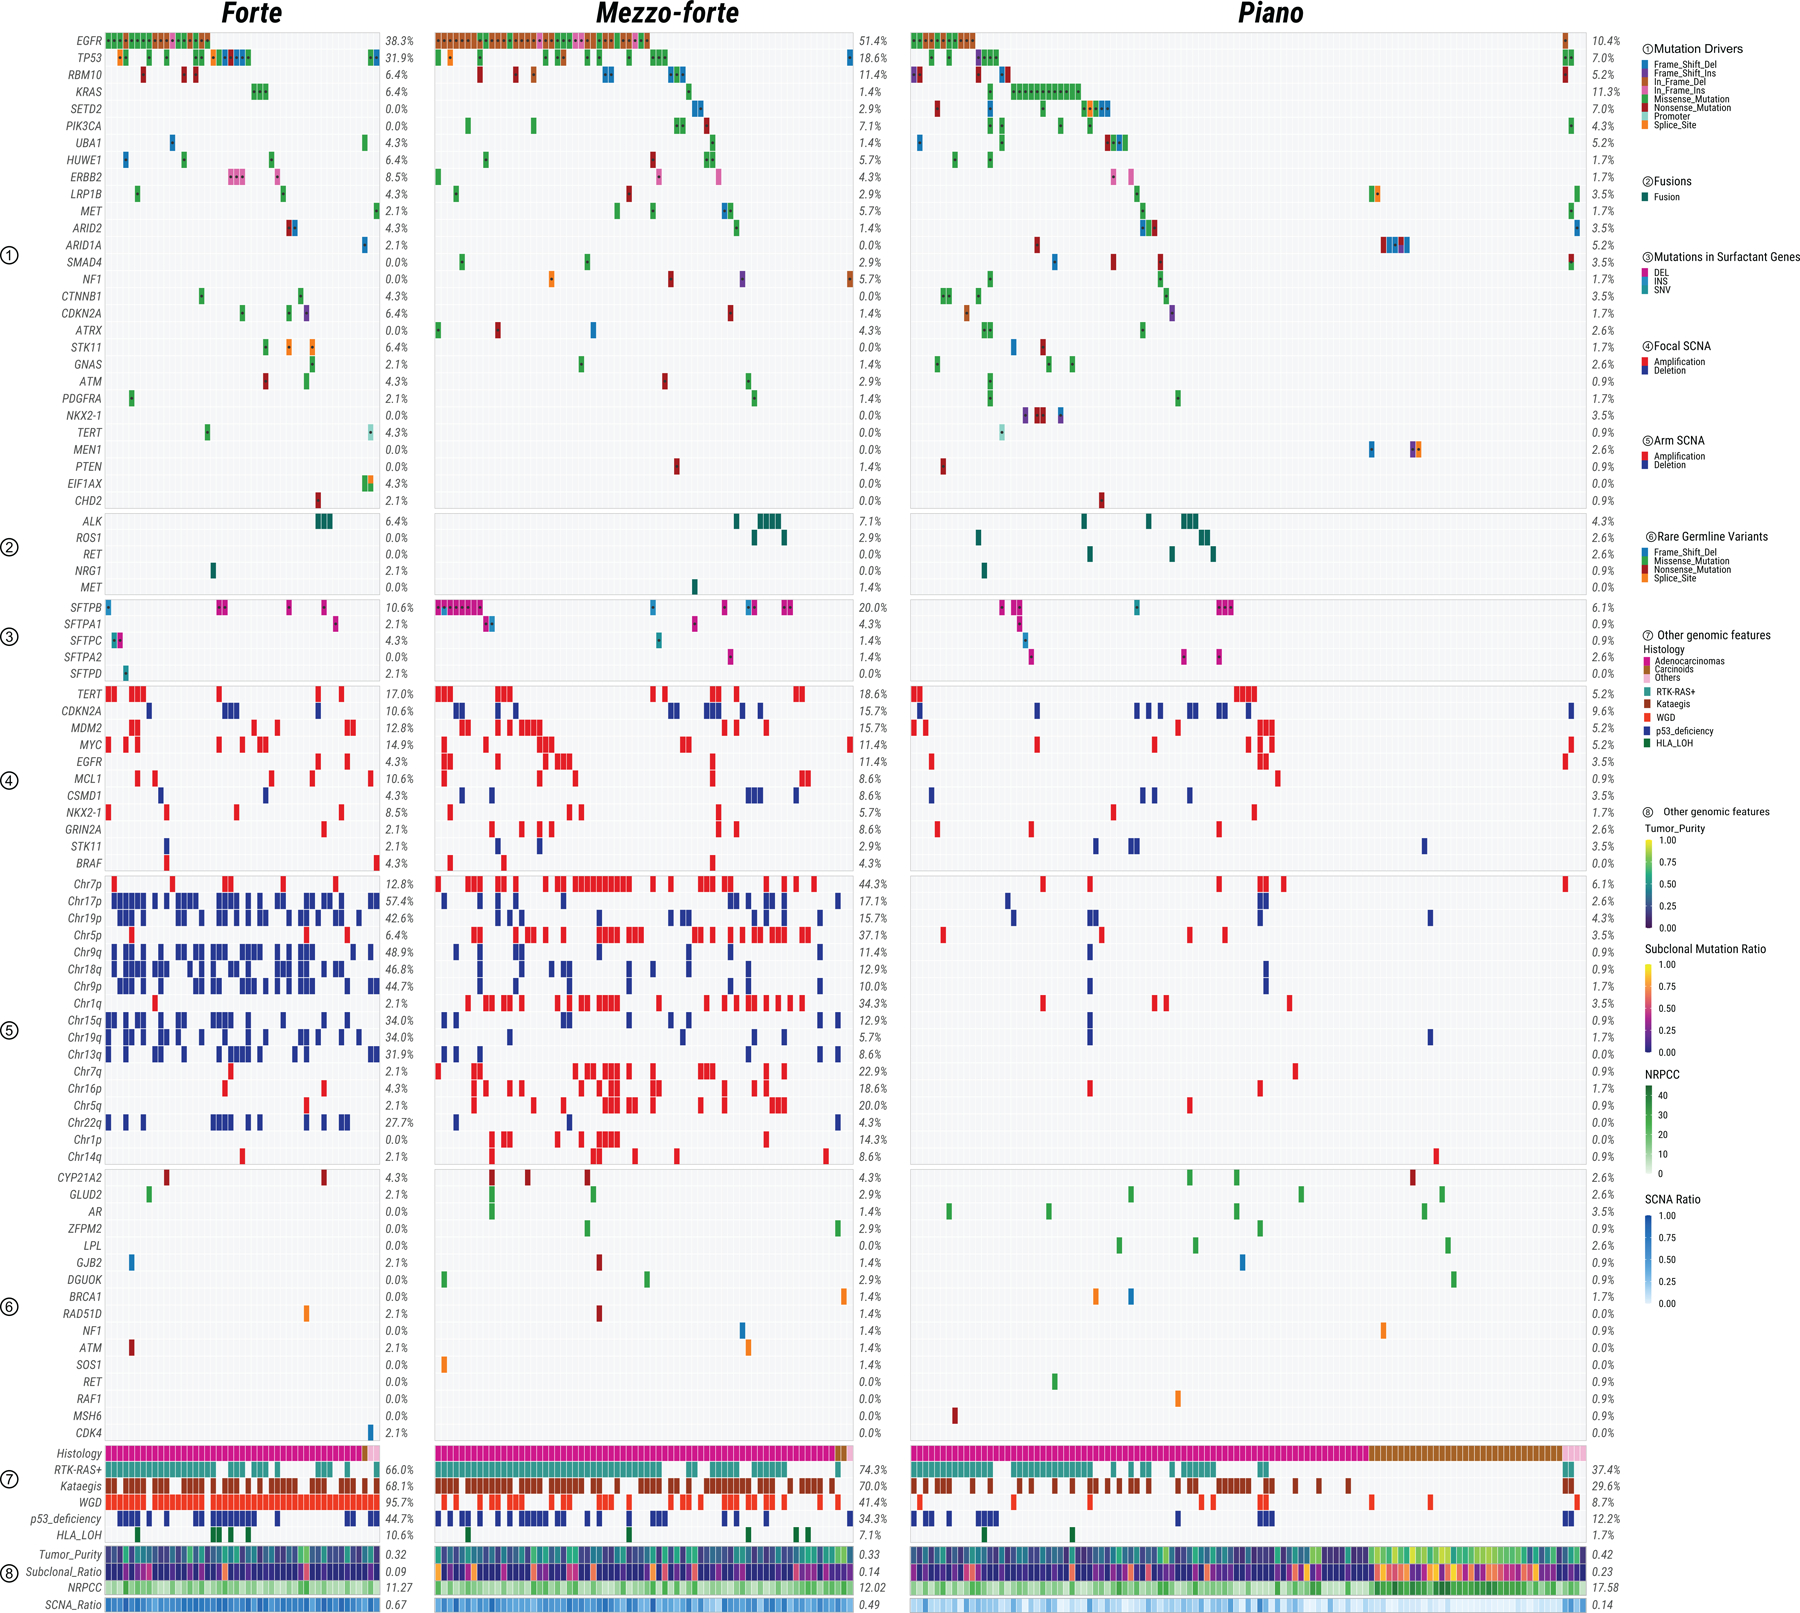
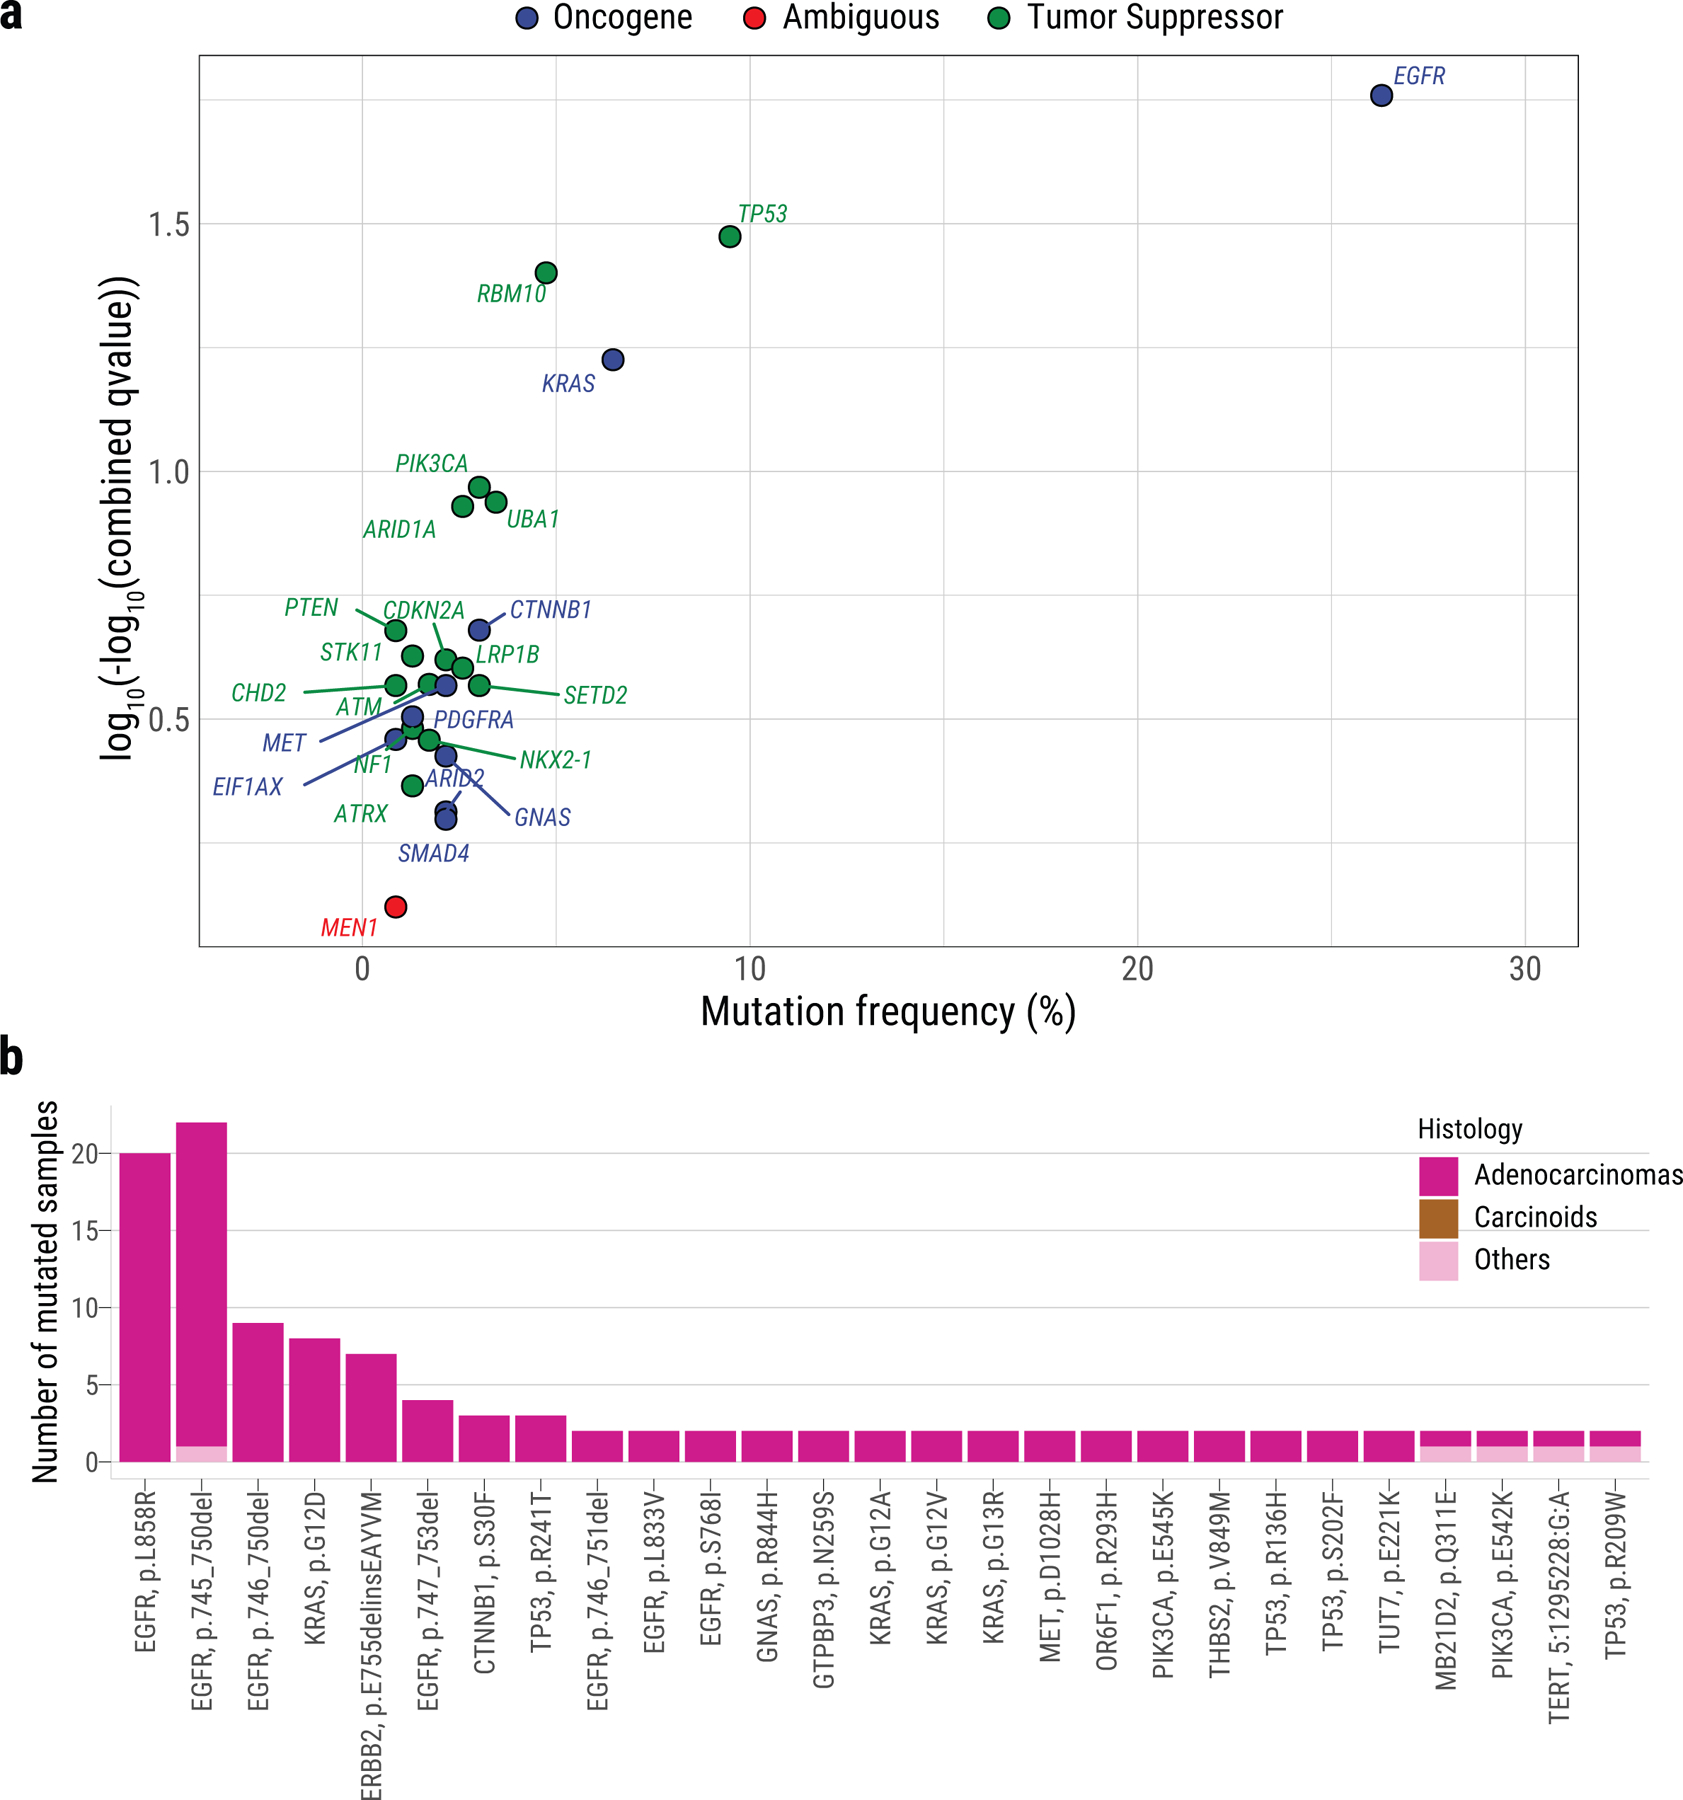
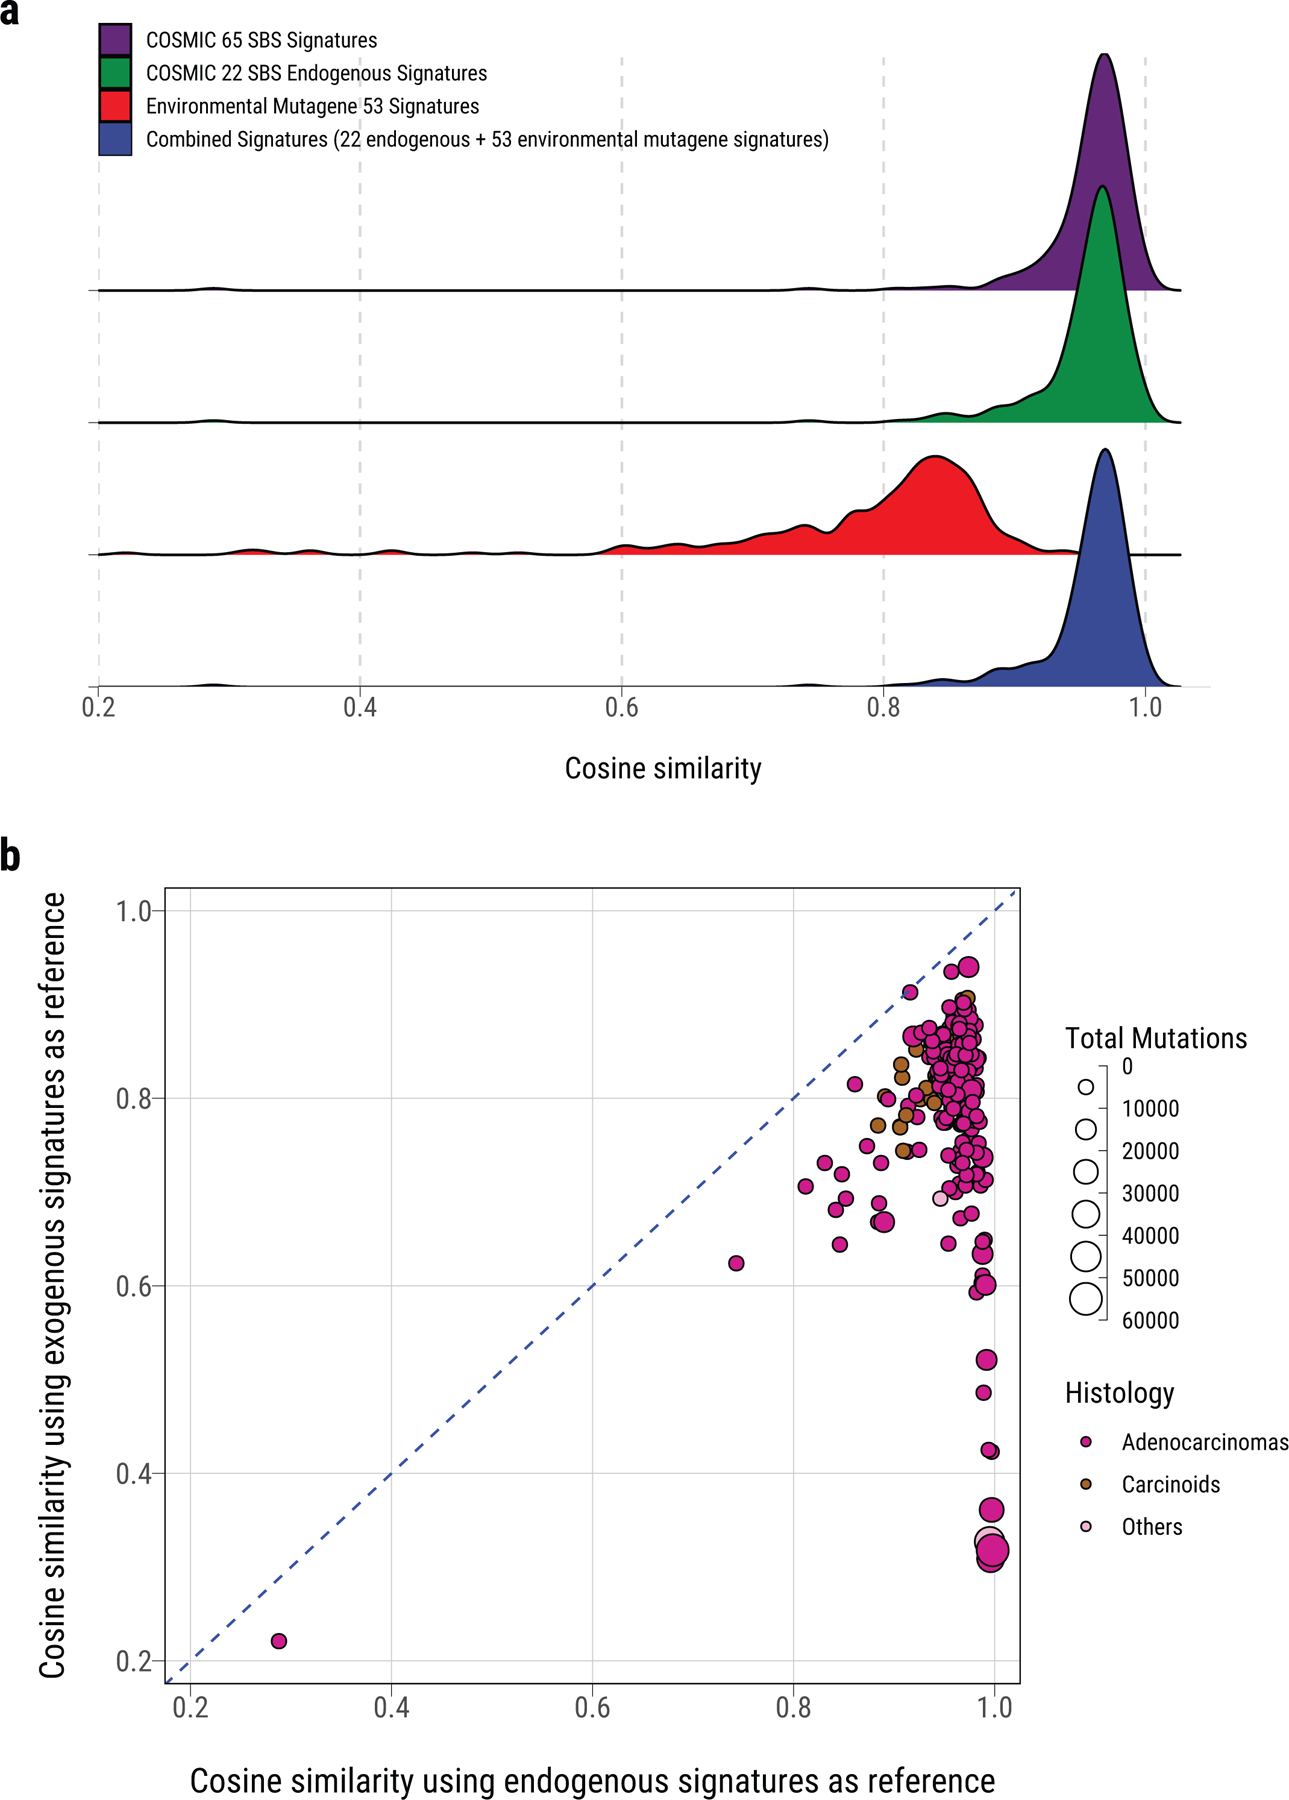
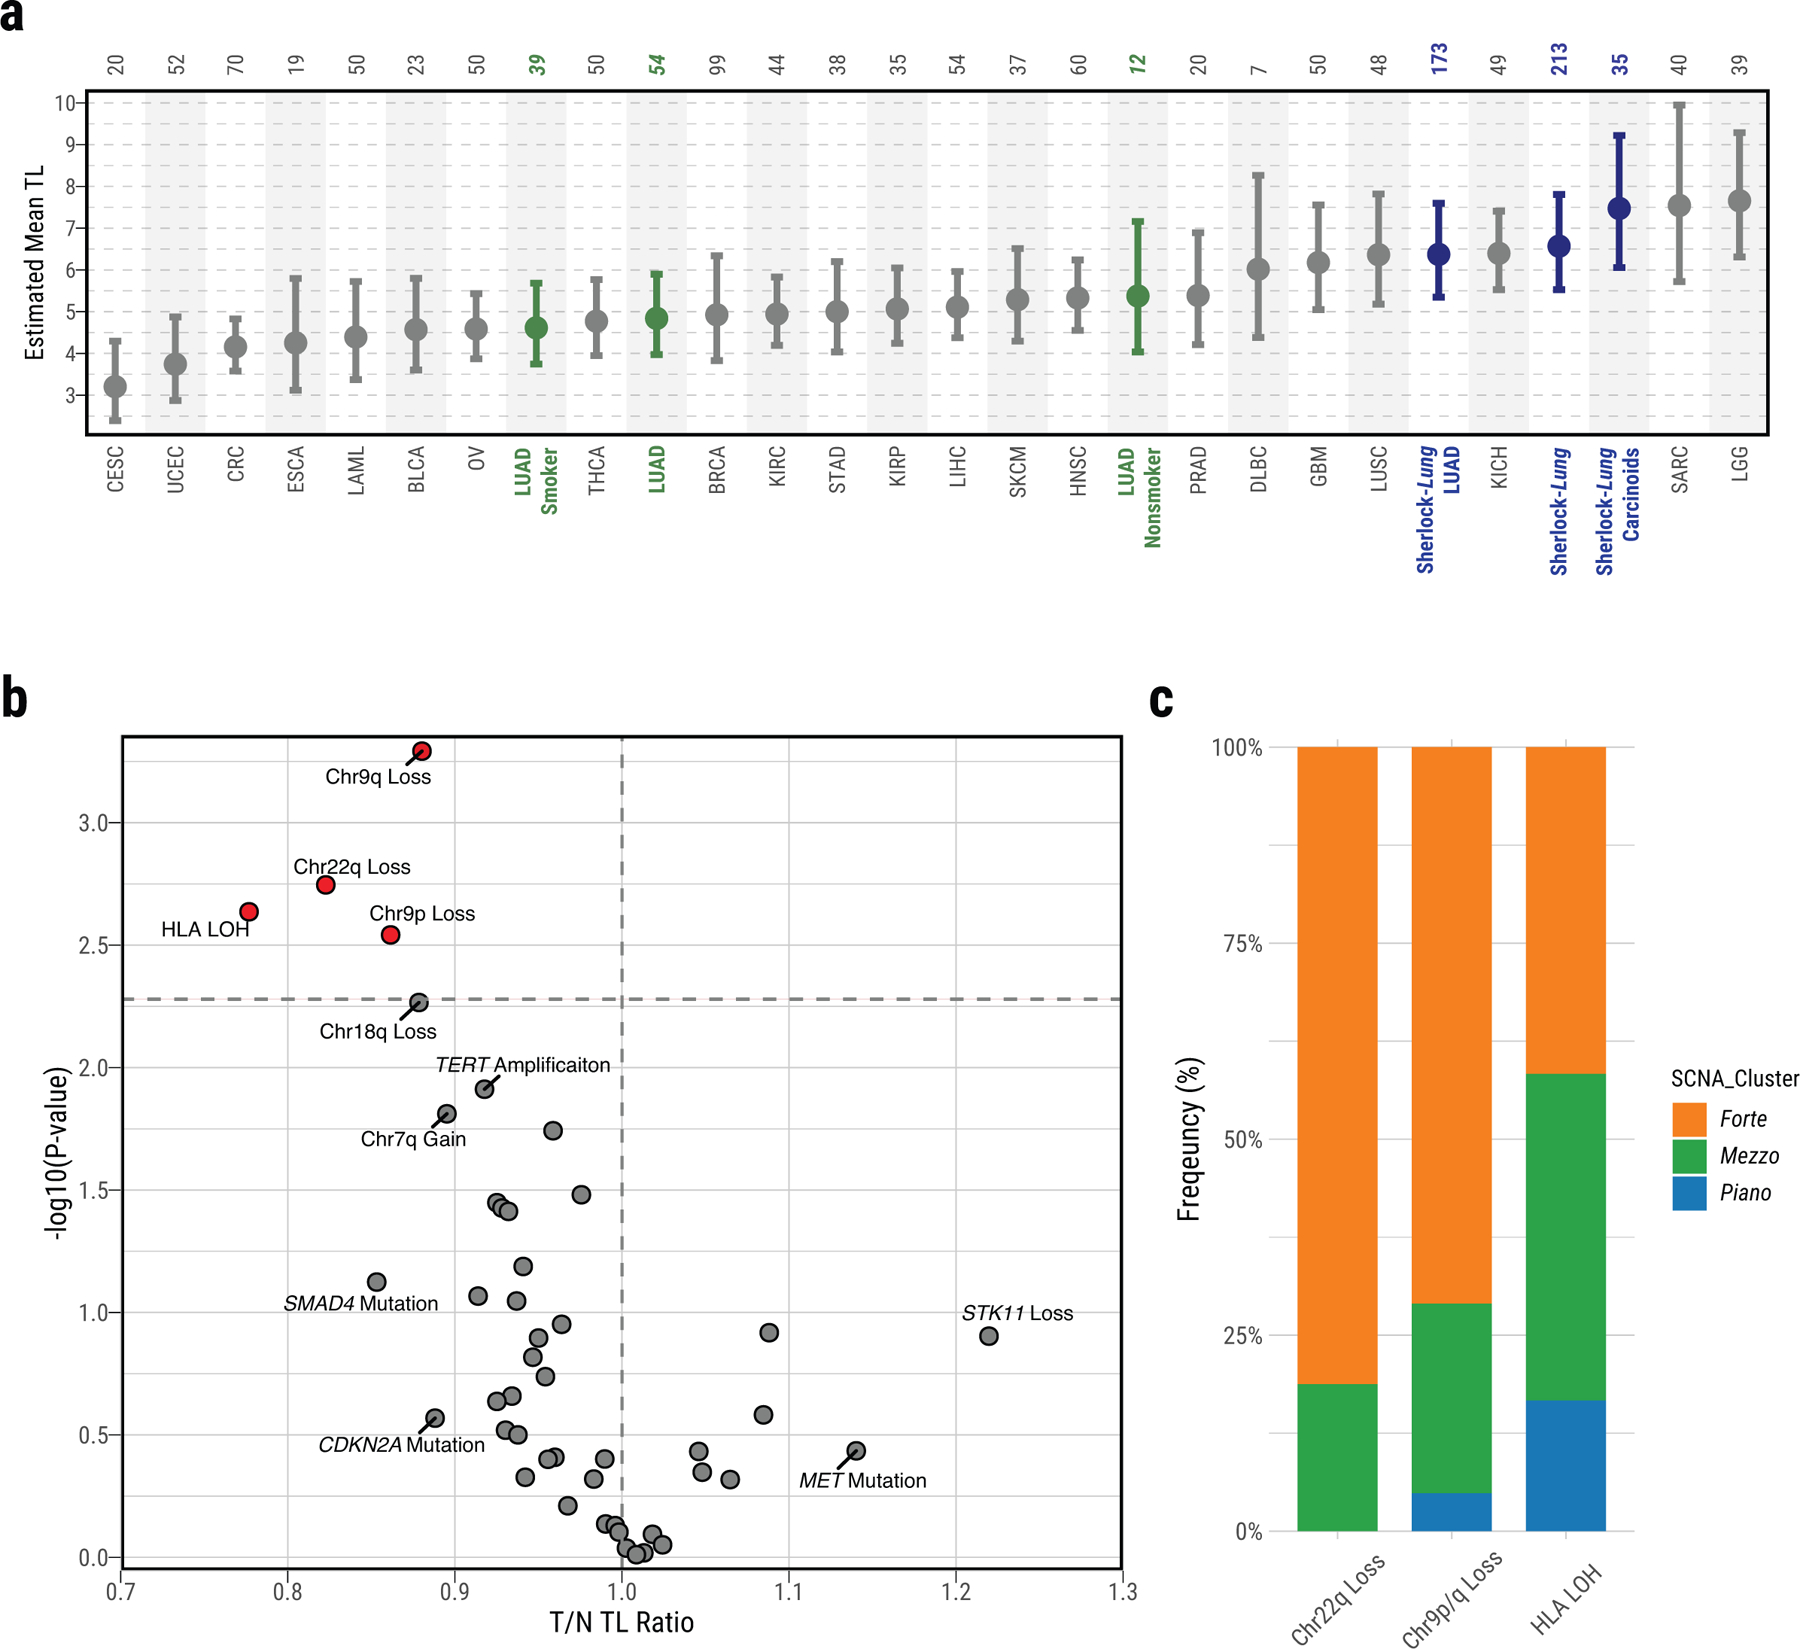
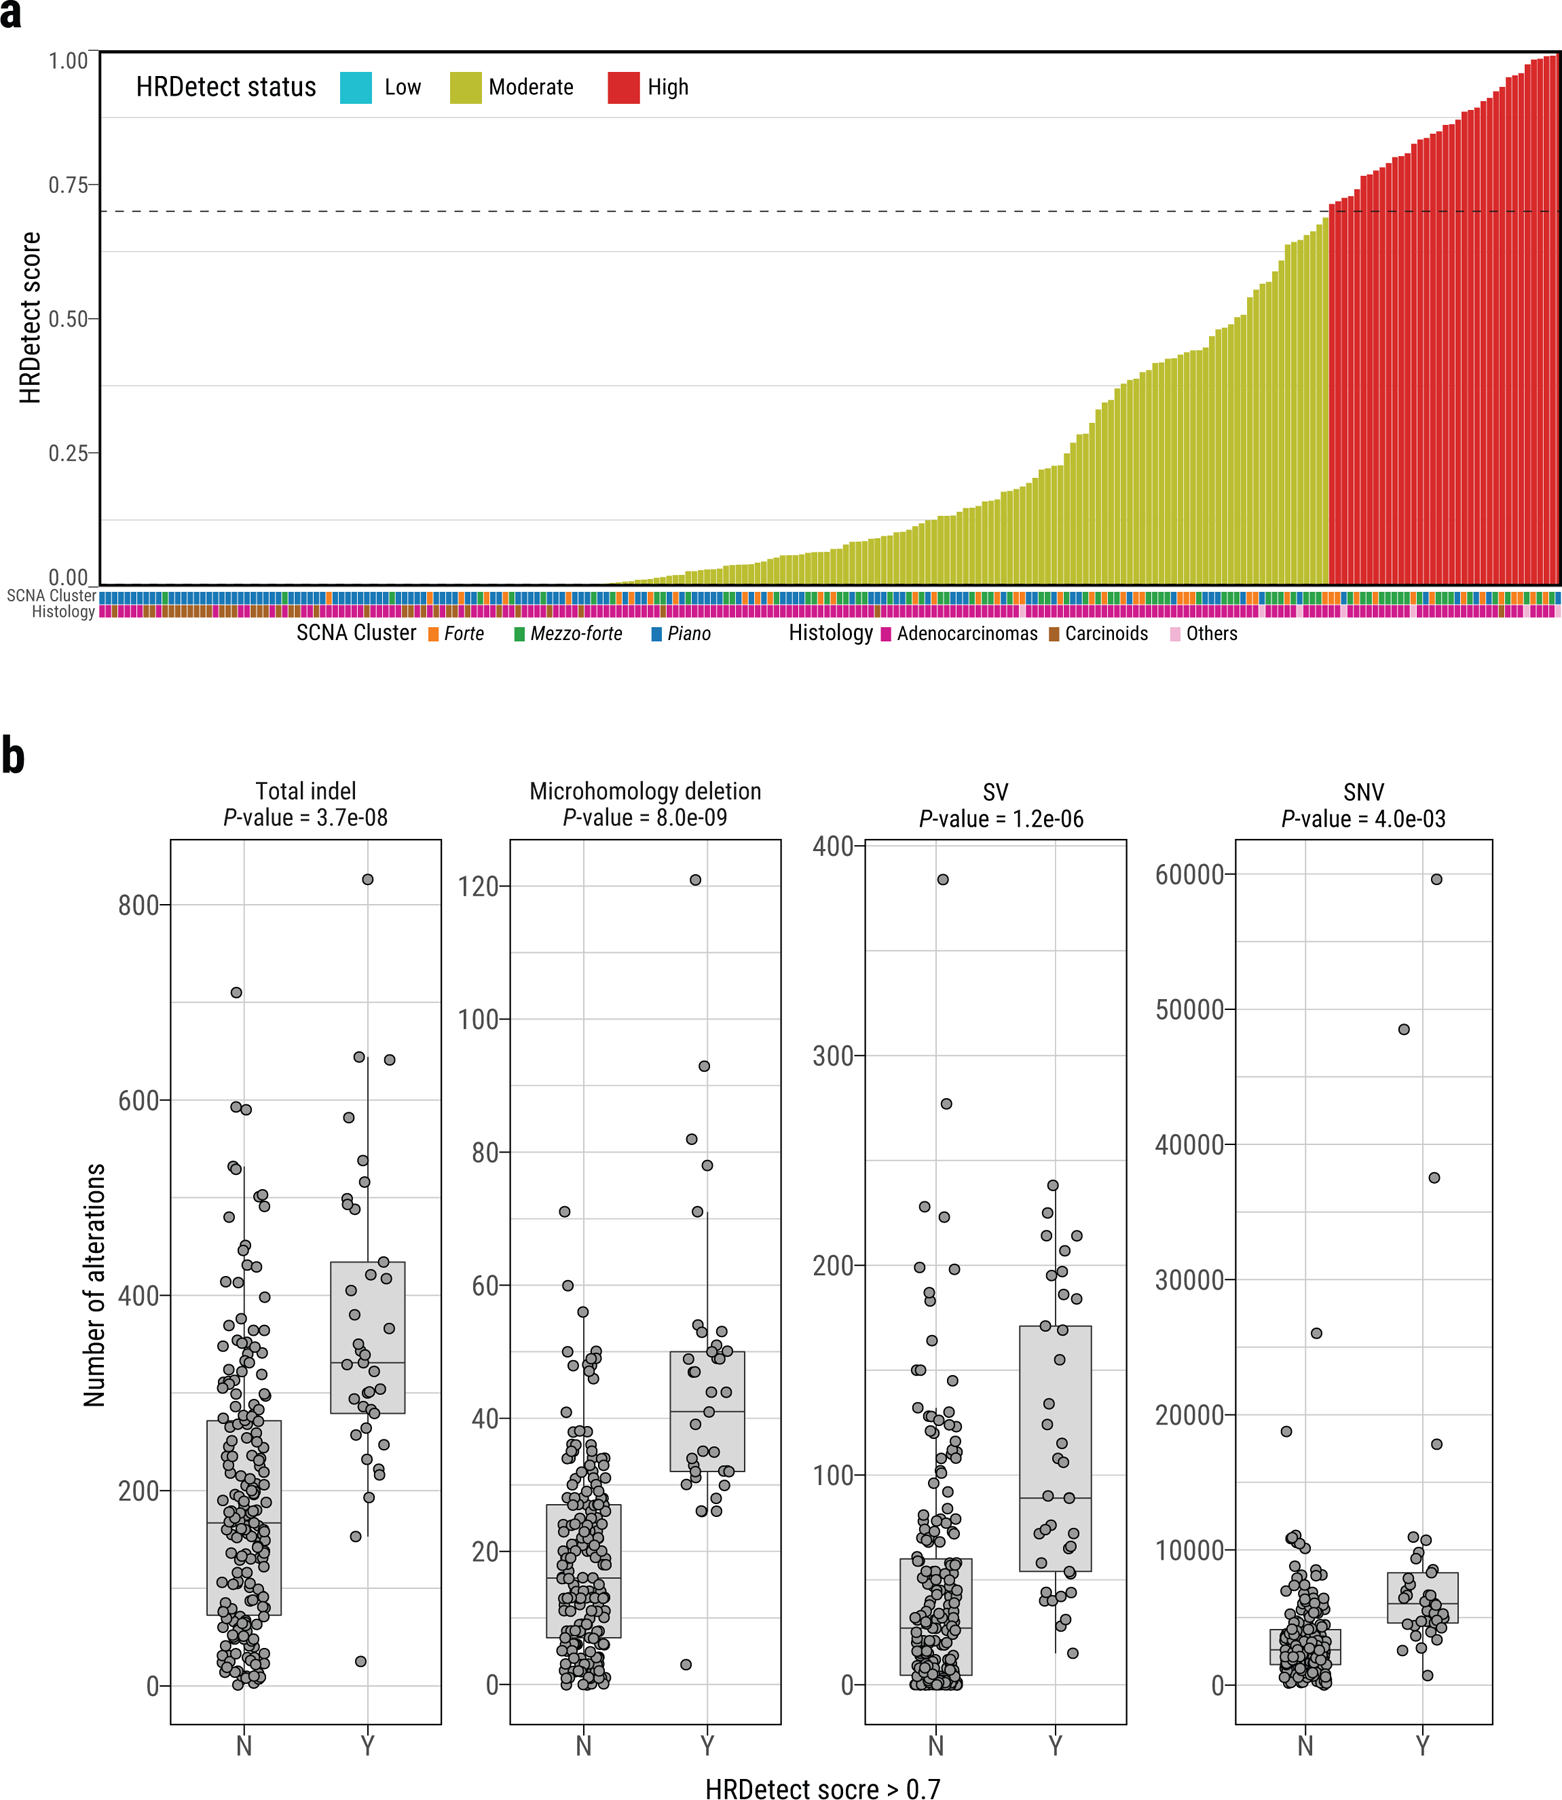
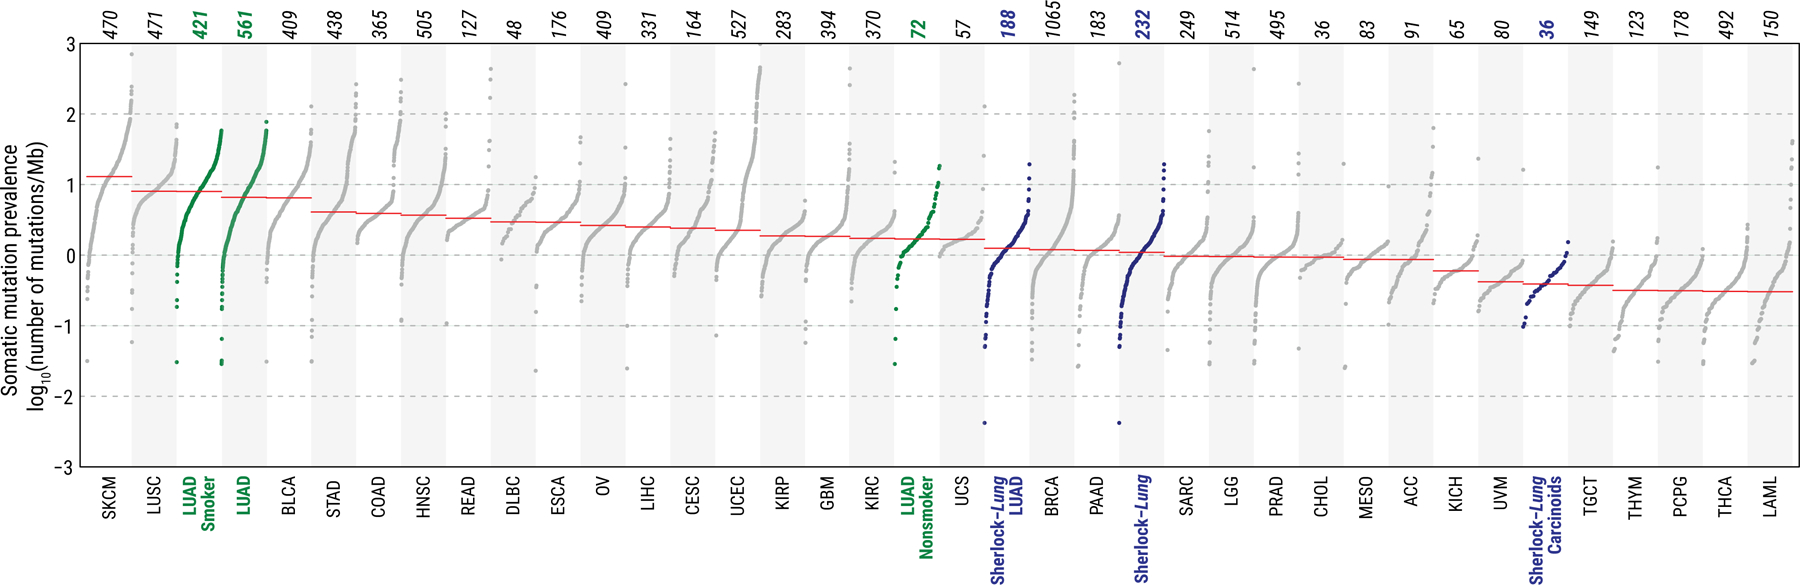
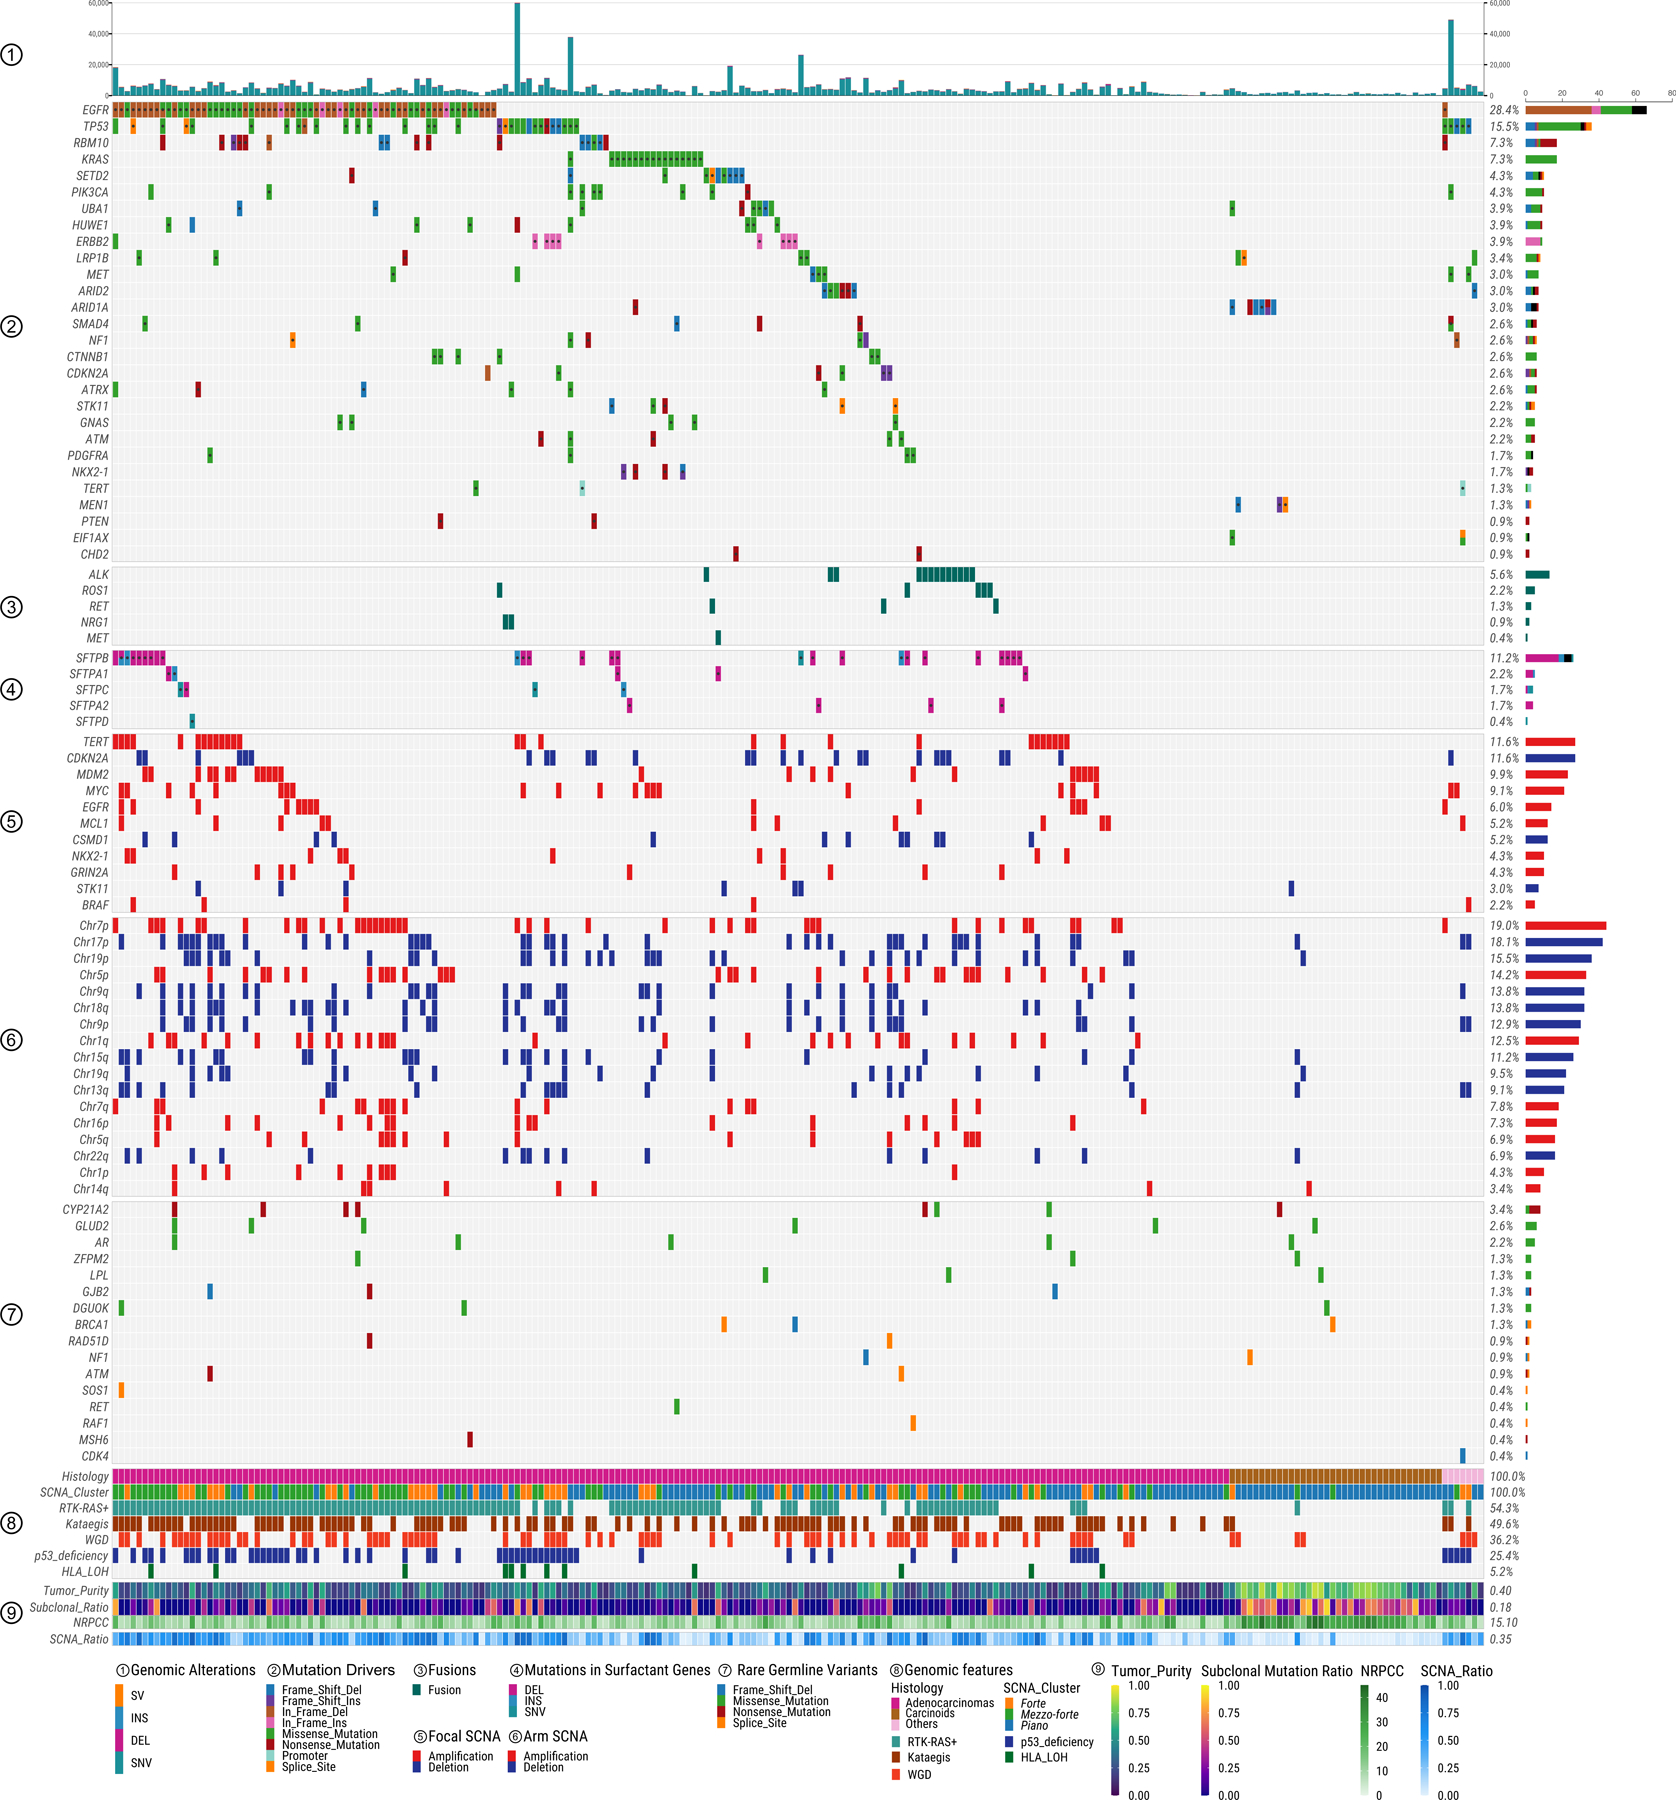
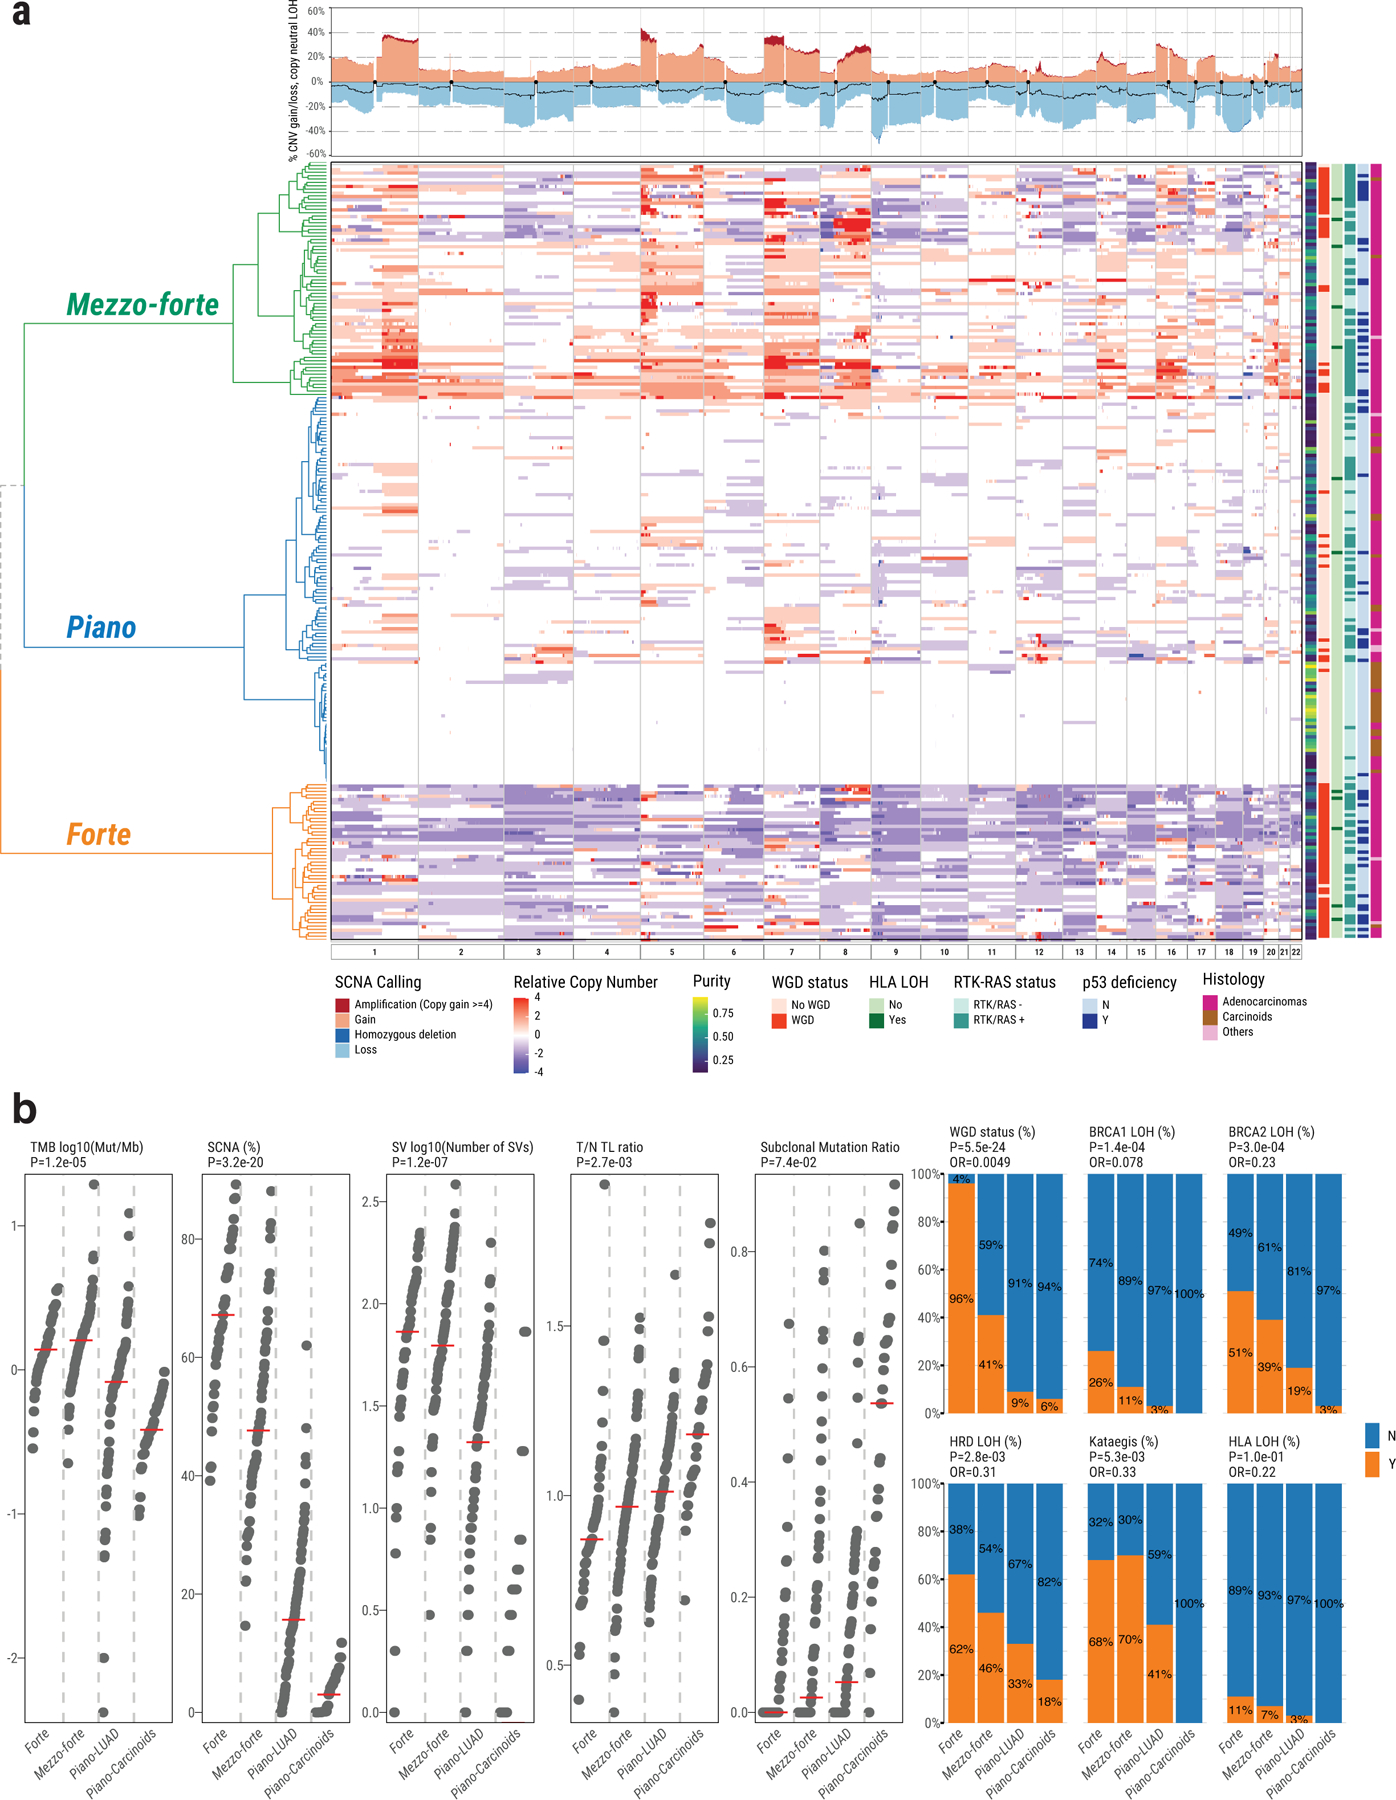
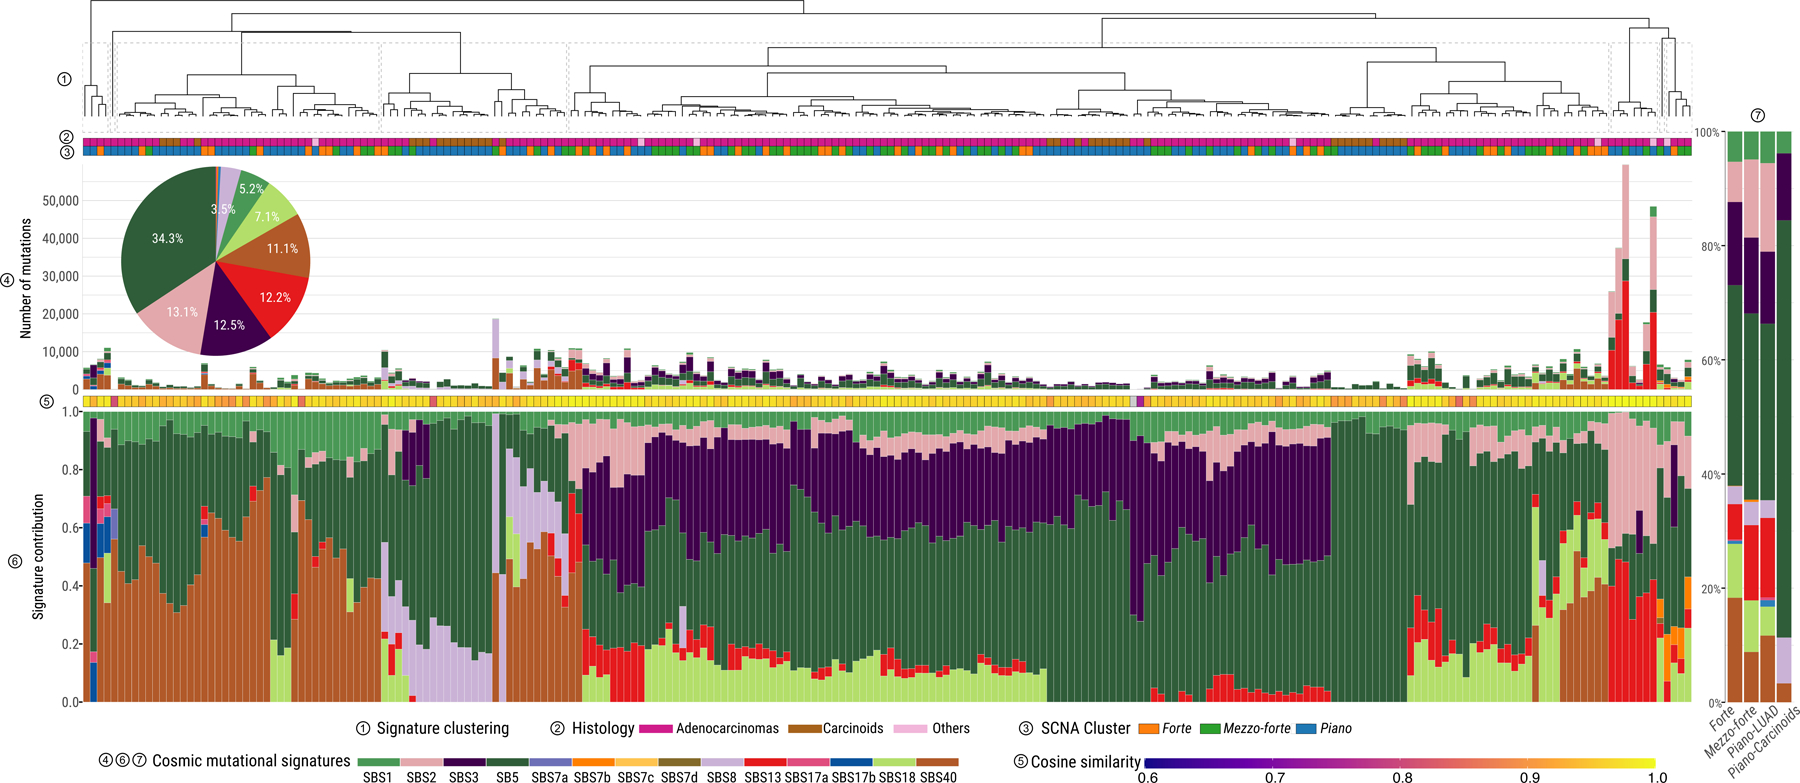
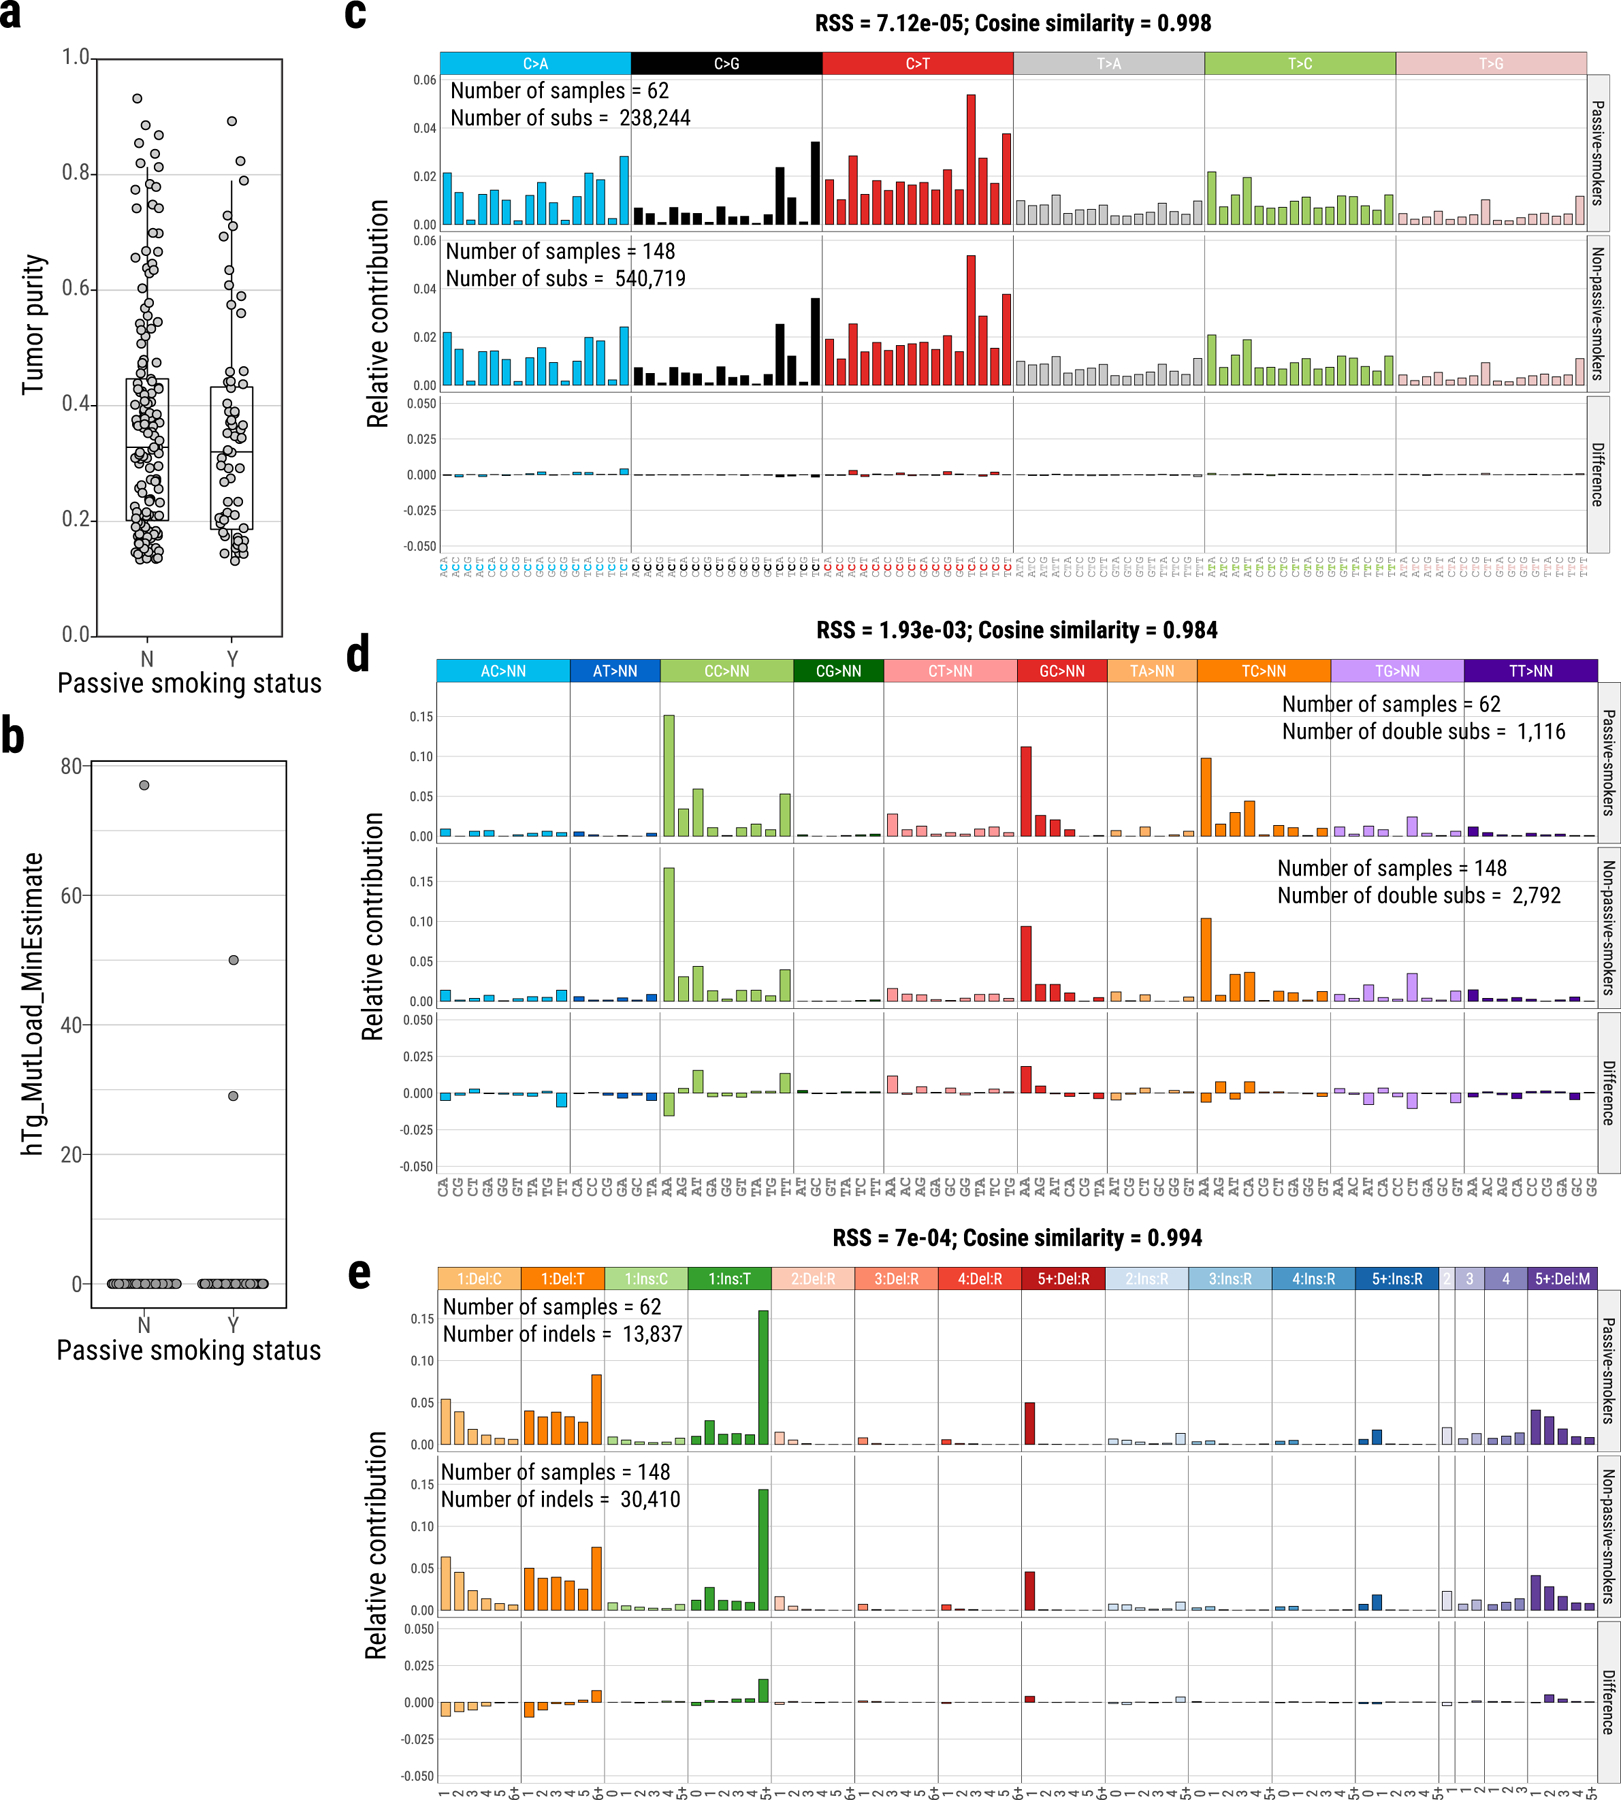
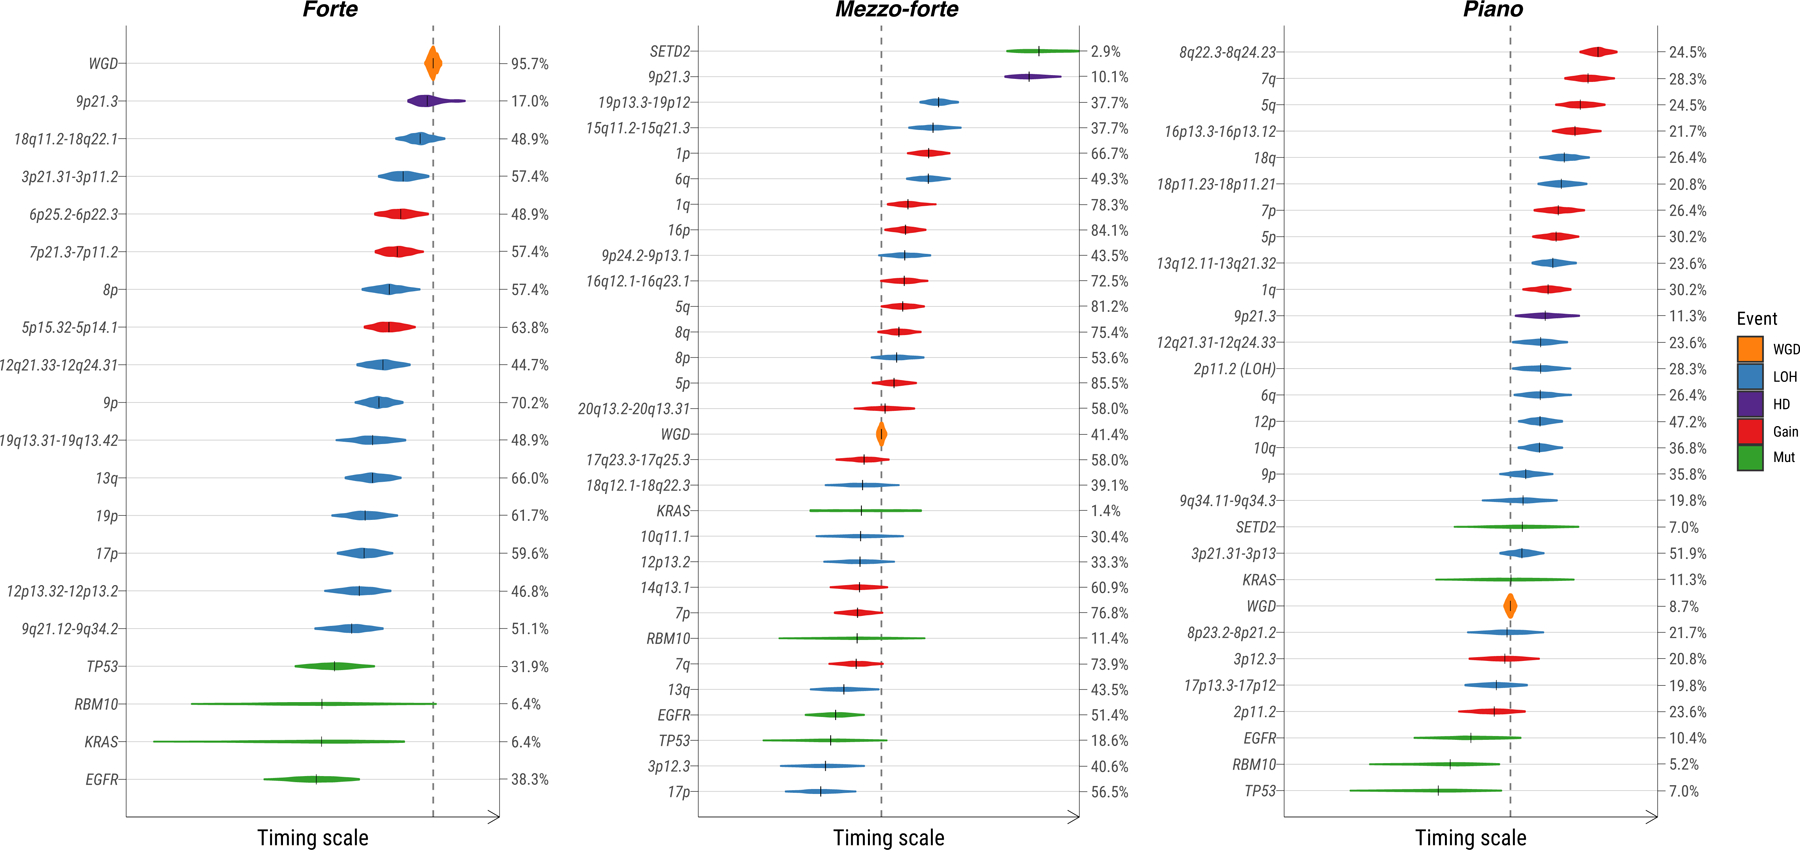
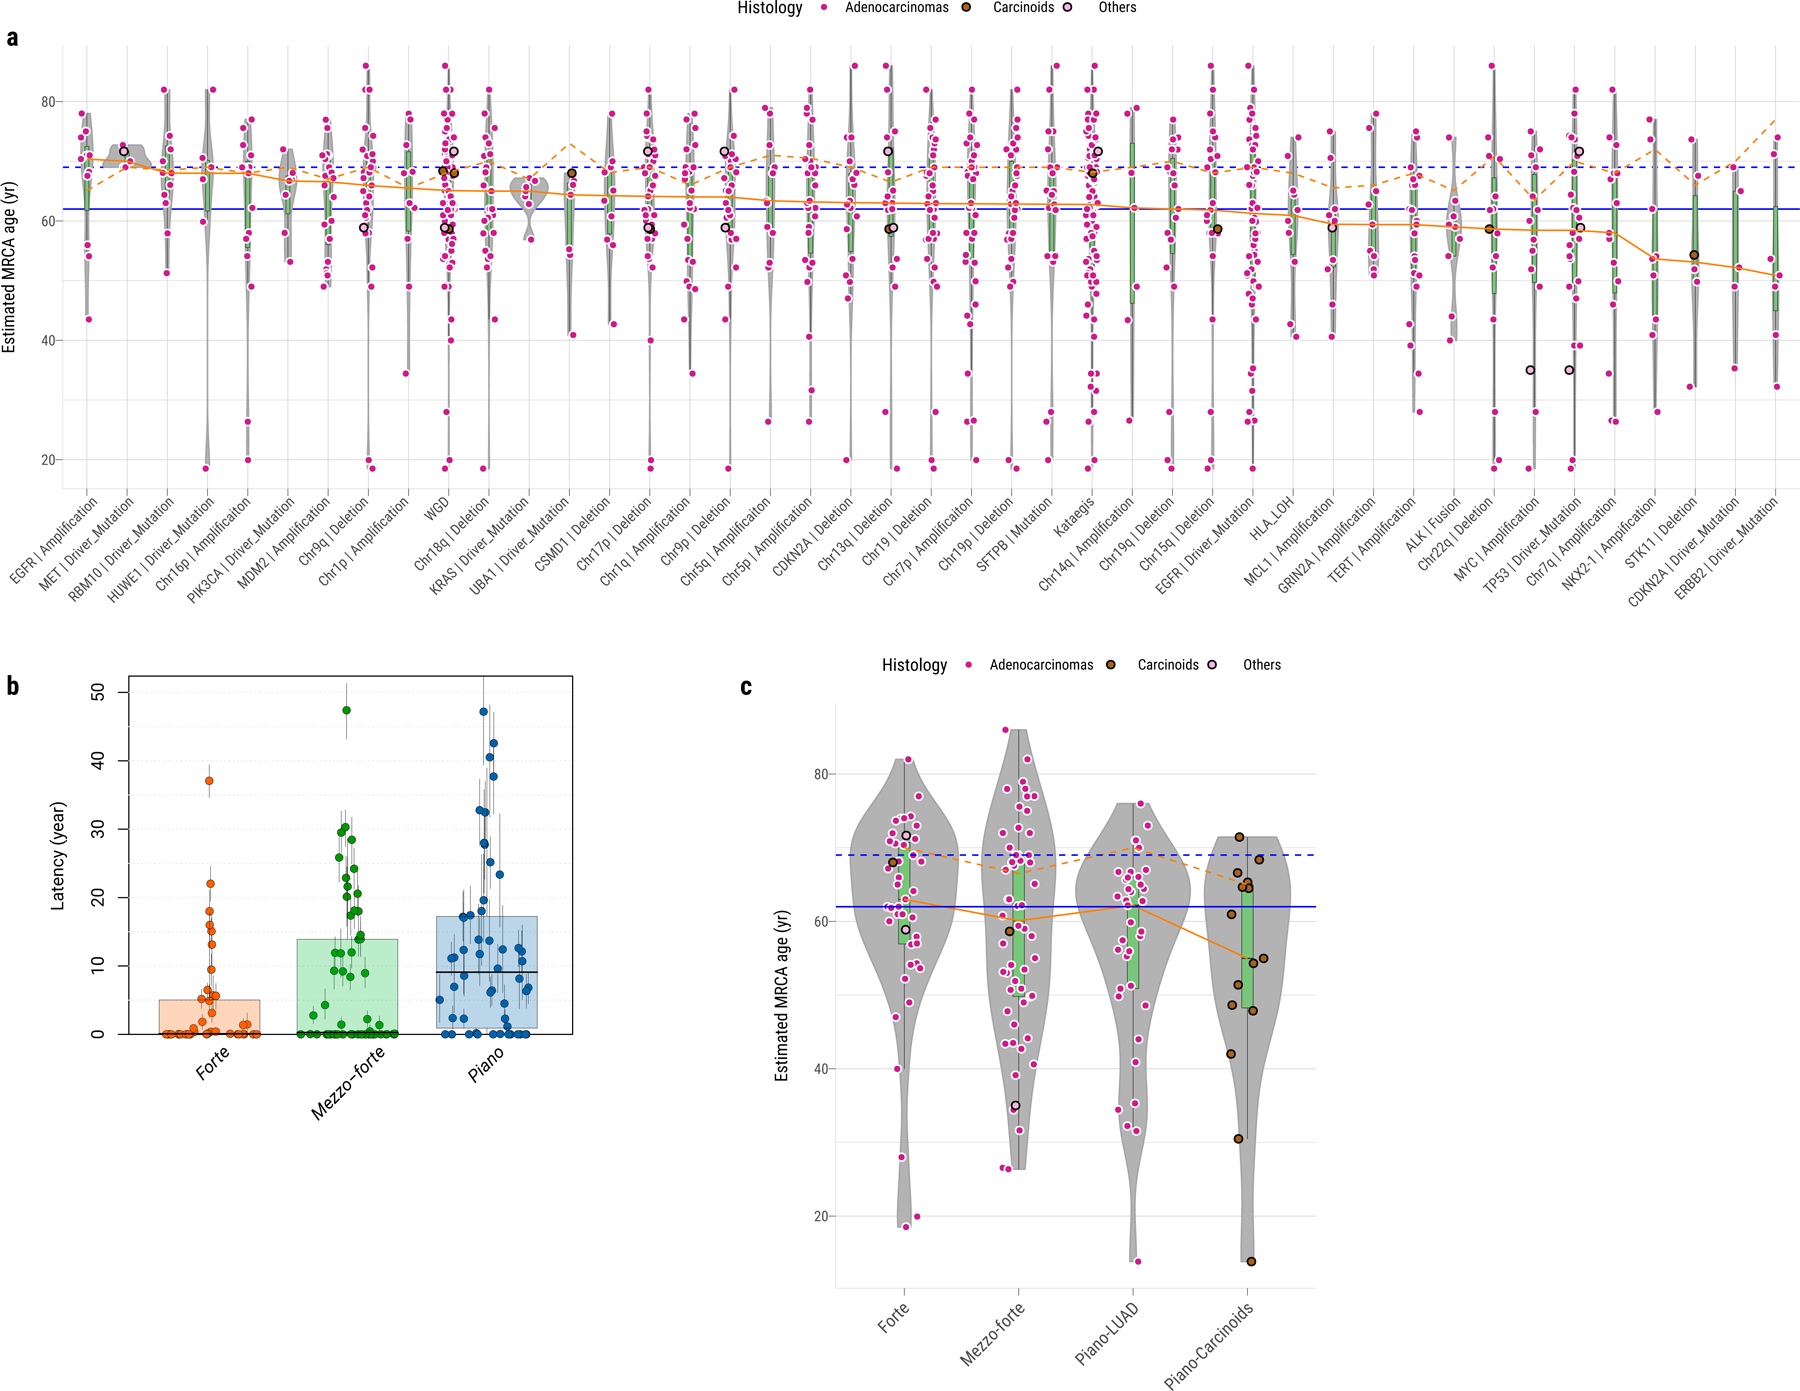
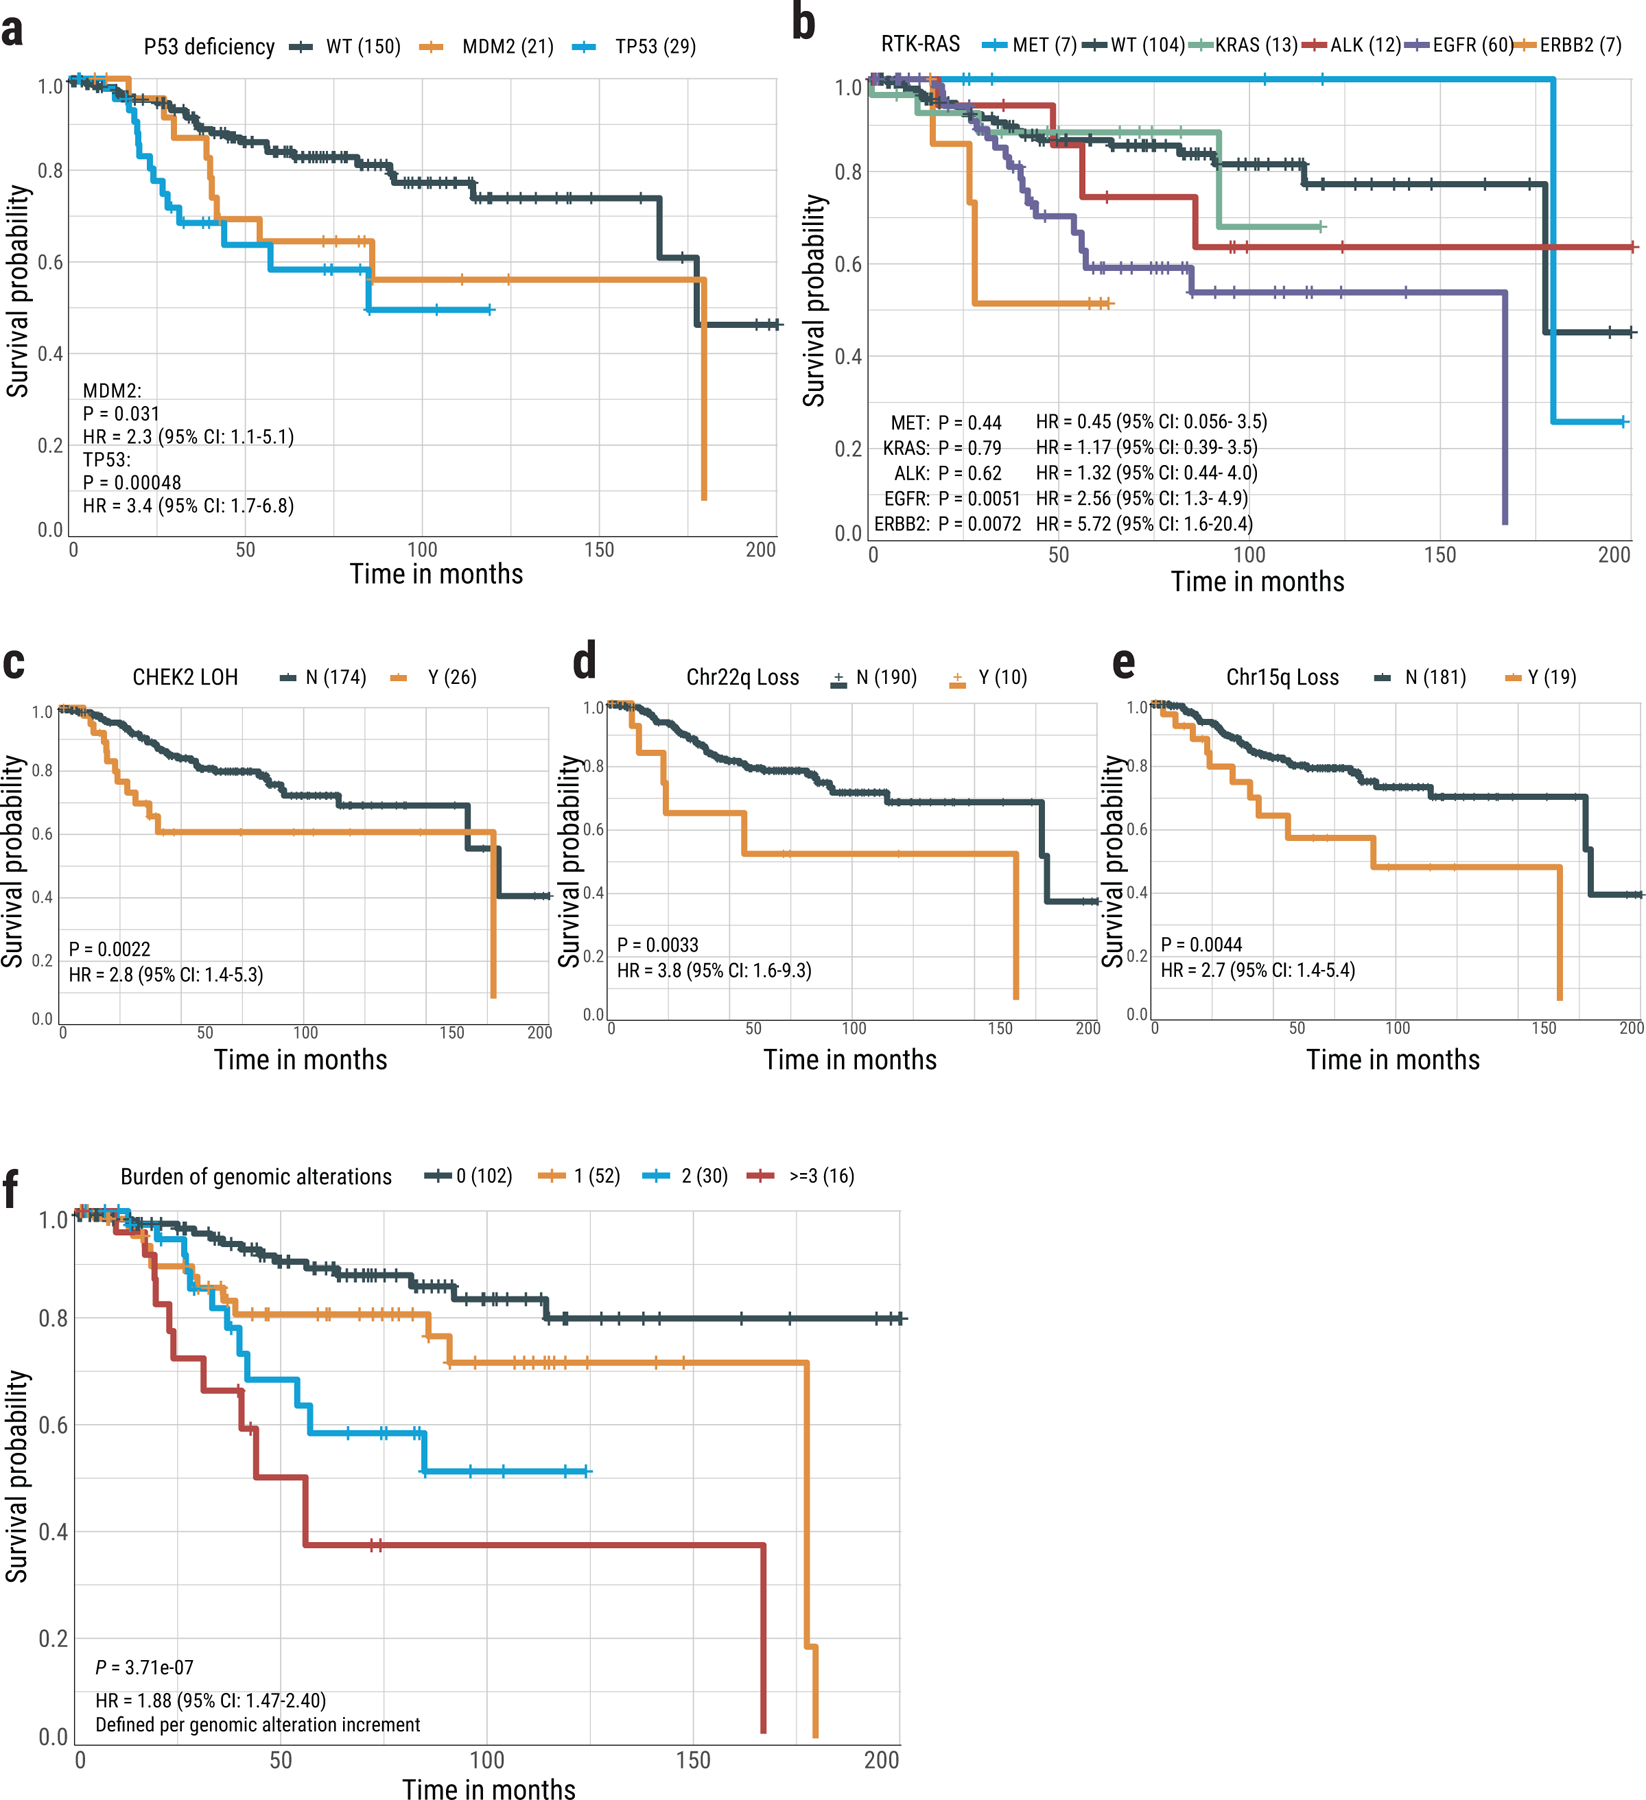
Lung cancer in never smokers (LCINS) is a common cause of cancer mortality but its genomic landscape is poorly characterized. Here high-coverage whole-genome sequencing of 232 LCINS showed 3 subtypes defined by copy number aberrations. The dominant subtype (piano), which is rare in lung cancer in smokers, features somatic UBA1 mutations, germline AR variants and stem cell-like properties, including low mutational burden, high intratumor heterogeneity, long telomeres, frequent KRAS mutations and slow growth, as suggested by the occurrence of cancer drivers' progenitor cells many years before tumor diagnosis. The other subtypes are characterized by specific amplifications and EGFR mutations (mezzo-forte) and whole-genome doubling (forte). No strong tobacco smoking signatures were detected, even in cases with exposure to secondhand tobacco smoke. Genes within the receptor tyrosine kinase-Ras pathway had distinct impacts on survival; five genomic alterations independently doubled mortality. These findings create avenues for personalized treatment in LCINS.


Conflict of interest statement

Competing interests

The authors declare no competing interests.

Figures

Extended Data Fig. 1
Extended Data Fig. 1. Genomic alterations of RTK-RAS pathway in Sherlock-Lung.
a, Oncoplot showing mutual exclusivity of genes within the RTK-RAS pathway, which were used to define the RTK-RAS status. The bottom bar shows tumor histological types. b, Comparison of genomic features between RTK-RAS negative and positive tumors. Left four panels: tumor mutational burden, percentage of genome with SCNAs, SV burden and T/N TL ratio. P-values are calculated using the two-sided Mann-Whitney U test; Middle three panels: enrichments for Kataegis events, WGD events, and BRCA2 LOH. P-values and OR are calculated using Fisher’s exact test (two-sided); Right panel: Contributions of each SBS signature.
Extended Data Fig. 2
Extended Data Fig. 2. Genomic alterations of TP53 pathway in Sherlock-Lung.
a, Oncoplot showing the mutual exclusivity between TP53 mutations and MDM2 amplification, which was used to define the TP53 proficient and deficient groups. The bottom bar shows tumor histological types. b, Comparison of genomic features between TP53-proficient and TP53-deficient tumors. Left three panels: tumor mutation burden, percentage of genome with SCNA and SV burden. P-values are calculated using the two-sided Mann-Whitney U test. Middle four panels: enrichments for BRCA1 LOH, Kataegis events, WGD events, and HLA LOH. P-values and OR are calculated using Fisher’s exact test (two-sided). Right panel: Contributions of each SBS signature.
Extended Data Fig. 3
Extended Data Fig. 3. Recurrence of SV breakpoints in Sherlock-Lung.
The frequencies of chromosomal breakpoints are calculated using 5 Mb as a window across the whole genome.
Extended Data Fig. 4
Extended Data Fig. 4. Summary of genomic features in LCINS based on different SCNA clusters.
Panels from top to bottom describe: 1) most frequently mutated or potential driver genes; 2) oncogenic fusions; 3) somatic mutations in surfactant associated genes; 4) significant focal SCNAs; 5) significant arm-level SCNAs; 6) genes with rare germline mutations; 7) and 8) other genomic features. The numbers on the right panel show the overall frequency (1–7) or median values (8). NRPCC: the number of reads per clonal copy.
Extended Data Fig. 5
Extended Data Fig. 5. Genes with signals of positive selection in Sherlock-Lung.
a, The scatter plot showing significantly mutated genes according to IntOGen q-value <0.05 (y-axis) and mutational frequency in the cohort (x-axis). Genes are colored according to their inferred mode of action in tumorigenesis. b, Recurrent non-synonymous driver mutations (in ≥2 patients).
Extended Data Fig. 6
Extended Data Fig. 6. Dominant endogenous processes in Sherlock-Lung.
a, Density plot of cosine similarity between original mutational profile and reconstructed mutational profile using reference signatures from (top to bottom): 65 COSMIC SBS signatures, 22 COSMIC SBS signatures for endogenous processes, 53 MutaGene SBS signatures of environmental exposures, and a combined set of signatures including the 22 endogenous and 53 environmental exposure signatures. b, Comparison of the cosine similarity between the original mutational profiles and reconstructed mutational profiles using endogenous and exogenous signatures (similar to a). Each dot represents one sample. The size and color represent the total number of mutations and tumor histological type, respectively.
Extended Data Fig. 7
Extended Data Fig. 7. Association between T/N TL ratio and somatic alterations in Sherlock-Lung.
a, Distribution of mean telomere lengths (TL) in Sherlock-Lung (dark blue, overall and by histological type), TCGA LUAD (green, overall and by smoking status) and TCGA other cancer types (Grey). Total sample numbers for each type are shown at the top. Error bars, 95% CIs from linear mixed model. b, Scatterplot showing association between T/N TL ratio and somatic alterations. Association P-values (two-sided t-test; FDR adjusted using Benjamini-Hochberg method) are shown on the y-axis. Genomic alterations with FDR <=0.1 or T/N TL ratio >1.1 or <0.9 are labeled and further highlighted in red when significant (FDR=0.05; horizontal dashed line). c, The proportion of each SCNA cluster among the group of tumors with somatic alterations significantly associated with shorten T/N TL including Chr22q Loss, Chr9p/q Loss or HLA LOH.
Extended Data Fig. 8
Extended Data Fig. 8. Homologous recombination deficiency (HRD) in Sherlock-Lung.
a, HRDetect scores of Sherlock-Lung samples. HRD-high: >0.7, HRD-low: < 0.005. b, Comparison of the number of total indels, microhomology deletions, SVs, and SNVs between samples with HRDetect score below 0.7 (group N) and above 0.7 (group Y). P-values are calculated using the two-sided Mann-Whitney U test. For box plots, center lines show the medians; box limits indicate the 25th and 75th percentiles; whiskers extend 1.5 times the interquartile range from the 25th and 75th percentiles.
Extended Data Fig. 9
Extended Data Fig. 9. Genomic alterations in HRD associated genes in Sherlock-Lung.
a, Oncoplot of genomic alterations in HRD associated genes, including germline mutations, somatic mutations and LOH. Samples with biallelic alterations are represented by bars with two different colors. The bottom bar shows tumor histological types. b, Boxplots of HRDetect scores (top) and SBS mutation loads (bottom) in tumors with and without LOH of six HR associated genes. FDR are calculated using the two-sided Mann-Whitney U test with multiple testing correction based on the Benjamini & Hochberg method. For box plots, center lines show the medians; box limits indicate the 25th and 75th percentiles; whiskers extend 1.5 times the interquartile range from the 25th and 75th percentiles.
Fig. 1
Fig. 1. Tumor mutational burden (TMB) across lung cancer in never smokers from the Sherlock-Lung study and 33 cancer types from the TCGA study.
The Sherlock-Lung samples (blue) are shown overall and by histological type. TCGA LUAD samples (green) are shown overall and by smoking status. Each dot represents a sample; total sample numbers for each type are shown at the top. The red horizontal lines are the median numbers of mutations per megabase (log10). On the bottom, acronyms of cancer types as in TCGA (https://gdc.cancer.gov/resources-tcga-users/tcga-code-tables/tcga-study-abbreviations).
Fig. 2
Fig. 2. Genomic characteristics of lung cancer in never smokers.
Panels from top to bottom describe: 1) distribution of genomic alteration numbers; 2) most frequently mutated or potential driver genes; 3) oncogenic fusions; 4) somatic mutations in surfactant associated genes; 5) significant focal SCNAs; 6) significant arm-level SCNAs; 7) genes with rare germline mutations; 8) and 9) different genomic features. The numbers on the right panel show the overall frequency (1–8) or median values (9). NRPCC: the number of reads per clonal copy.
Fig. 3
Fig. 3. Genomic classification of lung cancer in never smokers based on somatic copy number alterations.
a, Left panel shows unsupervised clustering of arm-level SCNA events: piano, mezzo-forte and forte. The relative copy number is calculated as: total copy number - ploidy (non-WGD=2 and WGD=4). Samples in rows are annotated by tumor purity, WGD status, HLA LOH, RTK-RAS status, TP53 deficiency, and tumor histological type. Top panel shows SCNA frequency including amplification, deletion and copy neutral LOH (black line). b, Comparison of genomic aberrations or features (Y=“with”, N=“without”) among forte, mezzo-forte, piano-LUAD, and piano-Carcinoids tumors. Left five panels: tumor mutation burden, percentage of genome with SCNAs, SV burden, T/N TL ratio and subclonal mutation ratio. P-values are calculated using two-sided Mann-Whitney U test. Right six panels: enrichments for WGD, Kataegis, BRCA2 LOH, BRCA1 LOH, HRD LOH and HLA LOH. P-values and OR are calculated using two-sided Fisher’s exact test. All statistical analyses were performed between forte and piano-LUAD.
Fig. 4
Fig. 4. Landscape of mutational processes in Sherlock-Lung.
Mutational signature profile of single base substitutions (SBS) across 232 Sherlock-Lung samples. Panels from top to bottom: 1) Unsupervised clustering based on the proportion of SBS signatures; 2) Tumor histological type; 3) SCNA cluster; 4) Pie chart showing the percentage of mutations contributed to each SBS signature and the barplot presenting the total number of SNVs assigned to each SBS signature; 5) Cosine similarity between original mutational profile and signature decomposition result; 6) Proportions of SBS mutational signatures in each sample. 7) Proportions of SBS mutational signatures in each SCNA subtype.
Fig. 5
Fig. 5. Comparison of mutational spectra between passive smokers and non-passive smokers in Sherlock-Lung.
Identification of tumor purity (a) and alkylation-induced mutagenesis (hTg → hGg signature) (b) between passive smokers (Y, N=62) and non-passive smokers (N, N=148). Mutational spectra comparison of single base substitutions (c), double base substitutions (d) and indels (e) between passive-smokers and non-passive smokers.
Fig. 6
Fig. 6. Diagram of estimated ordering of significant SCNAs (including chromosome gains/losses and mutations) relative to WGD in three lung cancer subtypes based on SCNA clusters forte, mezzo-forte and piano.
The size of violin plots denotes the uncertainty of timing for specific events across all samples and the short black solid lines represent the median time. The vertical dashed line indicates the median time for WGD events. Ordering of genomic events was based on the PlacketLuce package model with 95% CI. The frequency of each event is labeled on the right y-axis.
Fig. 7
Fig. 7. Reconstruction of the evolutionary history of lung cancer in never smokers.
a, Estimated age at which the most recent common ancestor (MRCA) emerged in tumors (y-axis), grouped by genomic alterations or features (x-axis, frequency >3%) as shown in Figure 2. The color of each dot represents the tumor histological subtype. The orange solid and dashed lines indicate the median estimated MRCA age and the median age at diagnosis in the same group, respectively. The blue solid and dashed lines indicate the median estimated MRCA age and the median age at diagnosis in all samples, respectively. b, Boxplots show the latency between the MRCA and the age at diagnosis based on 1× acceleration rate across forte, mezzo-forte, and piano subtypes with 95% CI for each tumor. c, Similar to a, estimated MRCA age among SCNA subtypes: forte, mezzo-forte, piano-LUAD and piano-carcinoids. For box plots from a to c, center lines show the medians; box limits indicate the 25th and 75th percentiles; whiskers extend 1.5 times the interquartile range from the 25th and 75th percentiles.
Fig. 8
Fig. 8. Association between genomic aberrations and clinical outcomes in never smoker lung cancer patients.
Kaplan-Meier survival curves for overall survival stratified by (a) TP53 mutations and MDM2 amplification, (b) activation of individual driver genes in the RTK-RAS pathway, (c) CHEK2 LOH, (d) Chr22q loss, (e) Chr15q loss, and (f) Risk score based on the burden of five genomic alterations. P-values for significance and hazard ratios (HR) of difference are calculated using the cox proportional hazards regression (two-sided) with adjustment for age, gender and tumor stage. No multiple-testing correction applied. For groups in each plot, Y= “with” aberration; N=“without” aberration. The numbers in brackets indicate the number of patients.

Comment in

References

    1. The Cancer Atlas: Lung Cancer. The Cancer Atlas https://canceratlas.cancer.org/the-burden/lung-cancer/.
    1. Cho J. et al.Proportion and clinical features of never-smokers with non-small cell lung cancer. Chin. J. Cancer 36, 20 (2017). - PMC - PubMed
    1. Campbell JD et al.Distinct patterns of somatic genome alterations in lung adenocarcinomas and squamous cell carcinomas. Nat. Genet 48, 607–616 (2016). - PMC - PubMed
    1. Cancer Genome Atlas Research Network. Comprehensive molecular profiling of lung adenocarcinoma. Nature 511, 543–550 (2014). - PMC - PubMed
    1. Chen J. et al.Genomic landscape of lung adenocarcinoma in East Asians. Nat. Genet 52, 177–186 (2020). - PubMed

Method References

    1. Jørsboe E, Hanghøj K & Albrechtsen A fastNGSadmix: admixture proportions and principal component analysis of a single NGS sample. Bioinformatics 33, 3148–3150 (2017). - PubMed
    1. Cibulskis K. et al.Sensitive detection of somatic point mutations in impure and heterogeneous cancer samples. Nat. Biotechnol. 31, 213–219 (2013). - PMC - PubMed
    1. Kim S. et al.Strelka2: fast and accurate calling of germline and somatic variants. Nat. Methods 15, 591–594 (2018). - PubMed
    1. Freed D, Pan R & Aldana R TNscope: Accurate Detection of Somatic Mutations with Haplotype-based Variant Candidate Detection and Machine Learning Filtering. bioRxiv 250647 (2018) doi:10.1101/250647. - DOI
    1. Zhu B. et al.The genomic and epigenomic evolutionary history of papillary renal cell carcinomas. Nat. Commun 11, 3096 (2020). - PMC - PubMed

Publication types

MeSH terms