. 2021 Sep;53(9):1311-1321.
doi: 10.1038/s41588-021-00923-x. Epub 2021 Sep 6.

Genomic and phenotypic insights from an atlas of genetic effects on DNA methylation

Josine L Min #  1   2 Gibran Hemani #  3   4 Eilis Hannon  5 Koen F Dekkers  6 Juan Castillo-Fernandez  7 René Luijk  6 Elena Carnero-Montoro  7   8 Daniel J Lawson  3   4 Kimberley Burrows  3   4 Matthew Suderman  3   4 Andrew D Bretherick  9 Tom G Richardson  3   4 Johanna Klughammer  10 Valentina Iotchkova  11 Gemma Sharp  3   4 Ahmad Al Khleifat  12 Aleksey Shatunov  12 Alfredo Iacoangeli  12   13 Wendy L McArdle  4 Karen M Ho  4 Ashish Kumar  14   15   16 Cilla Söderhäll  17 Carolina Soriano-Tárraga  18 Eva Giralt-Steinhauer  18 Nabila Kazmi  3   4 Dan Mason  19 Allan F McRae  20 David L Corcoran  21 Karen Sugden  21   22 Silva Kasela  23 Alexia Cardona  24   25 Felix R Day  24 Giovanni Cugliari  26   27 Clara Viberti  26   27 Simonetta Guarrera  26   27 Michael Lerro  28 Richa Gupta  29   30 Sailalitha Bollepalli  29   30 Pooja Mandaviya  31 Yanni Zeng  9   32   33 Toni-Kim Clarke  34 Rosie M Walker  35   36 Vanessa Schmoll  37 Darina Czamara  37 Carlos Ruiz-Arenas  38   39   40 Faisal I Rezwan  41 Riccardo E Marioni  35   36 Tian Lin  20 Yvonne Awaloff  37 Marine Germain  42 Dylan Aïssi  43 Ramona Zwamborn  44 Kristel van Eijk  44 Annelot Dekker  44 Jenny van Dongen  45 Jouke-Jan Hottenga  45 Gonneke Willemsen  45 Cheng-Jian Xu  46   47 Guillermo Barturen  8 Francesc Català-Moll  48 Martin Kerick  49 Carol Wang  50 Phillip Melton  51   52   53 Hannah R Elliott  3   4 Jean Shin  54 Manon Bernard  54 Idil Yet  7   55 Melissa Smart  56 Tyler Gorrie-Stone  57 BIOS ConsortiumChris Shaw  12   58 Ammar Al Chalabi  12   58   59 Susan M Ring  3   4 Göran Pershagen  14 Erik Melén  14   60 Jordi Jiménez-Conde  18 Jaume Roquer  18 Deborah A Lawlor  3   4 John Wright  19 Nicholas G Martin  61 Grant W Montgomery  20 Terrie E Moffitt  21   22   62   63 Richie Poulton  64 Tõnu Esko  23   65 Lili Milani  23 Andres Metspalu  23 John R B Perry  24 Ken K Ong  24 Nicholas J Wareham  24 Giuseppe Matullo  26   27 Carlotta Sacerdote  27   66 Salvatore Panico  67 Avshalom Caspi  21   22   62   63 Louise Arseneault  63 France Gagnon  28 Miina Ollikainen  29   30 Jaakko Kaprio  29   30 Janine F Felix  68   69 Fernando Rivadeneira  31 Henning Tiemeier  70   71 Marinus H van IJzendoorn  72   73 André G Uitterlinden  31 Vincent W V Jaddoe  68   69 Chris Haley  9 Andrew M McIntosh  34   36 Kathryn L Evans  35   36 Alison Murray  74 Katri Räikkönen  75 Jari Lahti  75 Ellen A Nohr  76   77 Thorkild I A Sørensen  3   4   78   79 Torben Hansen  78 Camilla S Morgen  78   80 Elisabeth B Binder  37   81 Susanne Lucae  37 Juan Ramon Gonzalez  38   39   40 Mariona Bustamante  38   39   40   82 Jordi Sunyer  38   39   40   83 John W Holloway  84   85 Wilfried Karmaus  86 Hongmei Zhang  86 Ian J Deary  36 Naomi R Wray  20   87 John M Starr  36   88 Marian Beekman  6 Diana van Heemst  89 P Eline Slagboom  6 Pierre-Emmanuel Morange  90 David-Alexandre Trégouët  42 Jan H Veldink  44 Gareth E Davies  91 Eco J C de Geus  45 Dorret I Boomsma  45 Judith M Vonk  92 Bert Brunekreef  93   94 Gerard H Koppelman  46 Marta E Alarcón-Riquelme  8   14 Rae-Chi Huang  95 Craig E Pennell  50 Joyce van Meurs  31 M Arfan Ikram  96 Alun D Hughes  97 Therese Tillin  97 Nish Chaturvedi  97 Zdenka Pausova  54 Tomas Paus  98 Timothy D Spector  7 Meena Kumari  56 Leonard C Schalkwyk  57 Peter M Visscher  20   87 George Davey Smith  3   4 Christoph Bock  10   99 Tom R Gaunt  3   4 Jordana T Bell  7 Bastiaan T Heijmans  6 Jonathan Mill  5 Caroline L Relton  3   4
Affiliations

Genomic and phenotypic insights from an atlas of genetic effects on DNA methylation

Josine L Min et al. Nat Genet. 2021 Sep.

Abstract

Characterizing genetic influences on DNA methylation (DNAm) provides an opportunity to understand mechanisms underpinning gene regulation and disease. In the present study, we describe results of DNAm quantitative trait locus (mQTL) analyses on 32,851 participants, identifying genetic variants associated with DNAm at 420,509 DNAm sites in blood. We present a database of >270,000 independent mQTLs, of which 8.5% comprise long-range (trans) associations. Identified mQTL associations explain 15-17% of the additive genetic variance of DNAm. We show that the genetic architecture of DNAm levels is highly polygenic. Using shared genetic control between distal DNAm sites, we constructed networks, identifying 405 discrete genomic communities enriched for genomic annotations and complex traits. Shared genetic variants are associated with both DNAm levels and complex diseases, but only in a minority of cases do these associations reflect causal relationships from DNAm to trait or vice versa, indicating a more complex genotype-phenotype map than previously anticipated.


Conflict of interest statement

Competing interests

T.R.G receives funding from GlaxoSmithKline and Biogen for unrelated research. Other authors declare no competing interests.

Figures

Extended Data Fig. 1
Extended Data Fig. 1. Quality control of 36 studies.
We used 337 independent SNPs on chromosome 20 with a p-value<1e-14. The number of SNPs used for each study are indicated in the bottom plot. a. Mstatistic for each of the 36 cohorts. b. Boxplot of mQTL effect sizes for each of the 36 studies. The center line of a boxplot corresponds to the median value. The lower and upper box limits indicate the first and third quartiles (the 25th and 75th percentiles). The length of the whiskers corresponds to values up to 1.5 times the IQR in either direction.
Extended Data Fig. 2
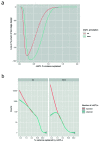
Extended Data Fig. 2. Distance of SNP from DNAm site.
a. Density plot of the distance of SNP from DNAm site against the -log10 p-value of 4,533 intra-chromosomal trans-mQTL associations (>1Mb). b. Density plot of the distance of SNP from DNAm site against the -log10 p-value of 248,607 cis-mQTL associations (<1Mb).
Extended Data Fig. 3
Extended Data Fig. 3. Effect sizes and weighted standard deviation (SD) for each mQTL category.
a. For each DNAm site, the strongest absolute effect size (the maximum absolute additive change in DNAm level measured in SD per allele) was selected. The kernel density estimations of the effect sizes were shown for all sites with a mQTL (n=190,102), sites with cis only effects (n=170,986), cis effects for sites with cis and trans effects (n=11,902), trans effects for sites with cis and trans effects (n=11,902) and sites with trans only effects (n=7,214). Comparing the strongest effect size for each site in a two-sided linear regression model showed that cis+trans sites had larger cis effect sizes (per allele SD change = 0.05 (s.e.= 0.002), p<2e-16) as compared to cis only sites and weaker trans effect sizes (per allele SD change = -0.06 (s.e.= 0.002), p<2e-16) as compared to trans only sites. To detect these small trans effect sizes at sites with both a cis and a trans association, it is crucial to regress out the cis effect to decrease the residual variance and improve power to detect a trans effect. b. The violin plots represent kernel density estimates of the weighted SD across 36 cohorts for each DNAm site. The center line of the boxplot in the violin plots corresponds to the median value. The lower and upper box limits indicate the first and third quartiles (the 25th and 75th percentiles). The length of the whiskers corresponds to values up to 1.5 times the IQR in either direction.
Extended Data Fig. 4
Extended Data Fig. 4. Impact of the two-stage design on mQTL coverage.
a. Loss in power in two-stage design. We calculated the power of detecting a cis association in at least one of the 22 studies at p<1e-5 or a trans association in at least two of 22 studies at p<1e-5. b. Expected number of mQTLs. Using the number of mQTLs with a particular r2 value, and the power of detecting mQTLs with that r2 value, we calculated how many mQTLs would expect to exist with that value.
Extended Data Fig. 5
Extended Data Fig. 5. Correlation of mQTL effects (p<1e-14) between blood and other tissues.
For each mQTL category, the correlation of genetic effects between tissues (rb) was estimated using the rb method where we used the blood mQTLs as reference. DNAm levels are categorized as low (<0.2), intermediate (0.2-0.8) or high (>0.8).
Extended Data Fig. 6
Extended Data Fig. 6. Two-dimensional enrichment of SNP and DNAm site TFBS annotation.
a. To test if the annotations of the SNPs involved in trans-mQTLs were specific to the annotations of the DNAm sites that they influence, we compared the real SNP-DNAm site pairs against permuted SNP-DNAm site pairs, where the biological link between SNP and site is severed whilst maintaining the distribution of annotations for the SNPs and sites. We constructed 100 such permuted datasets. b. SNP and site positions were annotated against genomic features, and we quantified how frequently mQTLs were found for each pair of SNP-DNAm site annotations. This enabled the construction of two-dimensional annotation matrices for both the real trans-mQTL list and the permuted trans-mQTL lists. c. Distribution of two-dimensional enrichment values of trans-mQTLs. There was substantial departure from the null in the real dataset for all tissues indicating that the TFBS of a site depended on the TFBS of the SNP that influenced it. d. A bipartite graph of the two-dimensional enrichment for trans-mQTLs, SNPs annotations (blue) with pemp< 0.01 after multiple testing correction co-occur with particular site annotations (red).
Extended Data Fig. 7
Extended Data Fig. 7. Correspondence of MR estimates amongst multiple independent instruments.
a. To evaluate if a site having a shared causal variant with a trait was potentially due to the site being on the causal pathway to the trait, we reasoned that independent instruments for the site should exhibit consistent effects on the outcome consistent with the original colocalizing variant. b. Amongst the putative colocalizing signals, 440 involved a DNAm site that had at least one other independent mQTL. The plot shows the causal effect estimate estimated from the original colocalizing signal against the causal effect estimates obtained from the independent variants (n=440). Grey regions represent the 95% confidence of the slope. c. Correspondence of MR estimates amongst multiple independent instruments on 36 blood traits. To evaluate if a site having a shared causal variant with a blood trait was potentially due to the site being on the causal pathway to the trait, we reasoned that independent instruments for the site should exhibit consistent effects on the outcome consistent with the original colocalizing variant. Amongst the putative colocalizing signals, 30% involved a DNAm site that had at least one other independent mQTL. The plot shows the causal effect estimate estimated from the original colocalizing signal against the causal effect estimates obtained from the independent variants. The HLA region has been removed and betas are plotted.
Extended Data Fig. 8
Extended Data Fig. 8. Genomic inflation factors for genome-wide scans of causal effects of traits on DNAm sites.
Each trait (x-axis) was tested for causal effects against (on average) 317,659 DNAm sites, excluding sites in the MHC region. The p-values from IVW MR analysis were used to estimate the genomic inflation for each trait (y-axis). Traits are ordered by genomic inflation factor.
Figure 1
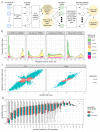
Figure 1. Discovery and replication of mQTLs
a. Study Design. In the first phase, 22 cohorts performed a complete mQTL analysis of up to 480,000 sites against up to 12 million variants; retaining their results for p<1e-5. In the second phase, 120 million SNP-DNAm site pairs selected from the first phase, and GWA catalog SNPs against 345k DNAm sites, were tested in 36 studies (including 20 phase 1 studies) and meta-analyzed. QC, quality control. b. Distributions of the weighted mean of DNAm across 36 cohorts for cis only, cis+trans and trans only sites. The weighted mean DNAm level across 36 studies was defined as low (<20%), intermediate (20%-80%) or high (>80%). Plots are colored with respect to the genomic annotation. Cis only sites showed a bimodal distribution of DNAm. Cis+trans sites showed intermediate levels of DNAm. Trans only sites showed low levels of DNAm. c. Discovery and replication effect size estimates between GoDMC (n=27,750) and Generation Scotland (n=5,101) for 169,656 mQTL associations. The regression coefficient is 1.13 (se=0.0007). d. Relationship between DNAm site heritability estimates and DNAm variance explained in Generation Scotland. The center line of a boxplot corresponds to the median value. The lower and upper box limits indicate the first and third quartiles (the 25th and 75th percentiles). The length of the whiskers corresponds to values up to 1.5 times the IQR in either direction. The regression coefficient for the twin family study was 3.16 (se=0.008) and for the twin study 2.91 (se=0.008) across 403,353 DNAm sites. The variance explained for DNAm sites with missing r2 (n=277,428) and/or h2=0 (Twin family: n=80,726 Twins: n=34,537) were set to 0. GS, Generation Scotland.
Figure 2
Figure 2. Cis- and trans-mQTLs operate through distinct mechanisms
a. Distributions of enrichments for chromatin states and gene annotations among mQTL sites and SNPs. Enrichment analyses were performed using 25 combinatorial chromatin states from 127 cell types (including 27 blood cell types) and gene annotations. The heatmap represents the distribution of ORs for cis only, trans only, or cis+trans sites and SNPs. For the enrichment of chromatin states, ORs were averaged across cell types. The following chromatin states were analyzed: TssA, Active TSS; PromU, Promoter Upstream TSS; PromD1, Promoter Downstream TSS with DNase; PromD2, Promoter Downstream TSS; Tx5', Transcription 5'; Tx, Transcription; Tx3', Transcription 3'; TxWk, Weak transcription; TxReg, Transcription Regulatory; TxEnh5', Transcription 5' Enhancer; TxEnh3', Transcription 3' Enhancer; TxEnhW, Transcription Weak Enhancer; EnhA1, Active Enhancer 1; EnhA2, Active Enhancer 2; EnhAF, Active Enhancer Flank; EnhW1, Weak Enhancer 1; EnhW2, Weak Enhancer 2; EnhAc, Enhancer Acetylation Only; DNase, DNase only; ZNF/Rpts, ZNF genes & repeats; Het, Heterochromatin; PromP, Poised Promoter; PromBiv, Bivalent Promoter; ReprPC, Repressed PolyComb, Quies Quiescent/Low. The significance was categorized as: *=FDR<0.001;**=FDR<1e-10;***=FDR<1e-50 b. Distributions of enrichment for occupancy of TFBSs among mQTL sites and SNPs. Each density curve represents the distribution of ORs for cis only, trans only, or cis+trans sites (left) and SNPs (right). c. Distributions of enrichment of mQTLs among 41 complex traits and diseases. Each density curve represents the distribution of ORs for cis only, trans only, or cis+trans SNPs.
Figure 3
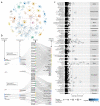
Figure 3. Communities constructed from trans-mQTLs.
a. A network depicting all communities in which there were twenty or more sites. Random walks were used to generate communities (colors), so occasionally a DNA site connects different communities. b. The relationship between genomic annotations, mQTLs and communities. Communities 9 and 22 comprised DNAm sites that are related through shared genetic factors. The sankey plots show the genomic annotations for the genetic variants (left) and for the DNAm sites (right). The DNAm sites comprising these communities are enriched for TFBSs related to the cohesin complex and NFkB, respectively. c. Enrichment of GWA traits among community SNPs. The genomic loci for each of the 56 largest communities were tested for enrichment of low p-values in 133 complex trait GWASs (y-axis) against a null background of community SNPs. The x-axis depicts the two-sided -log10 p-value for enrichment, with the 5% FDR shown by the vertical dotted line. Colors represent log odds ratios. Enrichments were particularly strong for blood-related phenotypes (including circulating metal levels).
Figure 4
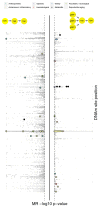
Figure 4. Identifying putative causal relationships between sites and traits using bi-directional MR.
Aggregated results from a systematic bi-directional MR analysis between DNAm sites and 116 complex traits. The y-axis represents the two-sided p-value from MR analysis. The top plot depicts results from tests of DNAm sites colocalizing with complex traits. The light grey points represent MR estimates that either did not surpass multiple testing, or shared small p-values at both the DNAm site and complex trait but had weak evidence of colocalization. Bold, colored points are those that showed strong evidence for colocalization (Posterior probability>0.8 for H4 - one shared SNP for DNAm and trait.). The bottom plot shows the two-sided -log10 p-values from MR analysis of risk factor or genetic liability of disease on DNAm levels. Extensive follow up was performed on DNAm site-trait pairs with putative associations, and those that pass filters are plotted in bold and colored according to the trait category. A substantial number of MR results in both directions exhibited very strong effects but failed to withstand sensitivity analyses.

References

    1. Petronis A. Epigenetics as a unifying principle in the aetiology of complex traits and diseases. Nature. 2010;465:721–7. - PubMed
    1. van Dongen J, et al. Genetic and environmental influences interact with age and sex in shaping the human methylome. Nat Commun. 2016;7:11115. - PMC - PubMed
    1. Hannon E, et al. Characterizing genetic and environmental influences on variable DNA methylation using monozygotic and dizygotic twins. PLoS Genet. 2018;14:e1007544. - PMC - PubMed
    1. Kerkel K, et al. Genomic surveys by methylation-sensitive SNP analysis identify sequence-dependent allele-specific DNA methylation. Nat Genet. 2008;40:904–8. - PubMed
    1. Schadt EE, et al. Genetics of gene expression surveyed in maize, mouse and man. Nature. 2003;422:297–302. - PubMed

Publication types

MeSH terms

Grants and funding