. 2021 Sep;53(9):1334-1347.
doi: 10.1038/s41588-021-00911-1. Epub 2021 Sep 6.

A single-cell and spatially resolved atlas of human breast cancers

Affiliations

A single-cell and spatially resolved atlas of human breast cancers

Sunny Z Wu et al. Nat Genet. 2021 Sep.

Abstract

Breast cancers are complex cellular ecosystems where heterotypic interactions play central roles in disease progression and response to therapy. However, our knowledge of their cellular composition and organization is limited. Here we present a single-cell and spatially resolved transcriptomics analysis of human breast cancers. We developed a single-cell method of intrinsic subtype classification (SCSubtype) to reveal recurrent neoplastic cell heterogeneity. Immunophenotyping using cellular indexing of transcriptomes and epitopes by sequencing (CITE-seq) provides high-resolution immune profiles, including new PD-L1/PD-L2+ macrophage populations associated with clinical outcome. Mesenchymal cells displayed diverse functions and cell-surface protein expression through differentiation within three major lineages. Stromal-immune niches were spatially organized in tumors, offering insights into antitumor immune regulation. Using single-cell signatures, we deconvoluted large breast cancer cohorts to stratify them into nine clusters, termed 'ecotypes', with unique cellular compositions and clinical outcomes. This study provides a comprehensive transcriptional atlas of the cellular architecture of breast cancer.


Conflict of interest statement

Competing Interests

CMP is an equity stock holder and consultant of BioClassifier LLC; CMP is also listed as an inventor on patent applications for the Breast PAM50 Subtyping assay.

JL is an author on patents owned by Spatial Transcriptomics AB covering technology presented in this paper. The remaining authors declare no competing interests.

Figures
Extended Data Fig. 1
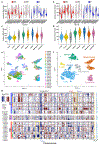
Extended Data Fig. 1. Identification of malignant cells, single-cell RNA sequencing metrics and non-integrated data of stromal and immune cells
a-b, Number of unique molecular identifiers (a) and genes (b) per tumor analyzed by scRNA-Seq in this study. Tumors are stratified by the clinical subtypes TNBC (red), HER2 (pink) and ER (blue). Diamond points represent the mean. c-d, Number of unique molecular identifiers (UMIs;c) and genes (d) per major lineage cell types identified in this study. These major lineage tiers are grouped by T-cells, B-cells, Plasmablasts, Myeloid, Epithelial, Cycling, Mesenchymal (cancer-associated fibroblasts and perivascular-like cells) and Endothelial. Diamond points represent the mean. e-f, UMAP visualization of all 71,220 stromal and immune cells without batch correction and data integration. UMAP dimensional reduction was performed using 100 principal components in the Seurat v3 package. Cells are grouped by tumor (e) and major lineage tiers (f) as identified using the Garnett cell classification method. g, InferCNV heatmaps of all malignant cells grouped by clinical subtypes. Common subtype-specific CNVs and a chr6 artefact reported by Tirosh et. al. are marked (Tirosh et al., 2016b).
Extended Data Fig. 2
Extended Data Fig. 2. Supplementary data for scSubtype classifier
a-b, Hierarchical Clustering of Allcells-Pseudobulk (indicated by yellow stars) and Ribozero mRNA-Seq (indicated by blue stars) profiles of the patient samples with TCGA patient mRNA-Seq data. a, View of the basal cluster showing pairing of Allcells-Pseudobulk and Ribozero mRNA-Seq profiles of 2 representative tumors (CID4495 and CID4515) in the present study. b, View of the luminal cluster showing pairing of Allcells-Pseudobulk and Ribozero mRNA-Seq profiles of 4 representative tumors (CID4067, CID4463, CID4290 and CID3948) in the present study. c, Heatmap of scSubtype gene sets across the training and test samples in each individual group. Colored outlined boxes highlighting the top expressed genes per group. d, Barplot representing proportions of scSubtype calls in individual samples. Test dataset samples are highlighted within the golden colored outline. e, Scatterplot of individual cancer cells plotted according to the Proliferation score (x-axis) and Differentiation – DScore (y-axis). Individual cells are colored based on the scSubtype calls. f, Scatterplot of individual TCGA breast tumors plotted according to the Proliferation score (x-axis) and Differentiation – DScore (y-axis). Individual patients are colored based on the PAM50 subtype calls.
Extended Data Fig. 3
Extended Data Fig. 3. Supplementary data for breast cancer gene modules
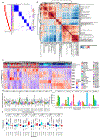
a, Spherical k-means (skmeans) based consensus clustering of the Jaccard similarities between 574 signatures of neoplastic cell ITTH. This showed the probability (p1-p7) of each signature of ITTH being assigned to one of seven clusters/classes. Silhouette scores are shown for each signature. b, Heatmap of pair-wise Pearson correlations of the scaled AUCell signature scores, across all individual neoplastic cells, for each of the seven ITTH gene-modules (bolded) and a curated set of breast cancer related gene-signatures. Hierarchical clustering was performed using Pearson correlations and average linkage c, Heatmap showing the scaled AUCell signature scores of each of the seven ITTH gene-modules (rows) across all individual neoplastic cells (columns). Hierarchical clustering was done using Pearson correlations and average linkage. (HER2_AMP = Clinical HER2 amplification status). d, Distributions of signature scores (z-score scaled) for each of the gene-module signatures (24,489 cells from 21 tumors). Cells are grouped according to the gene-module (GM1-7) cell-state. e, Barchart showing the proportion of cells assigned to each of the gene-module cell-states (GM1-7) with cells grouped according to the scSubtypes. f, Distributions of scSubtype scores for each of the gene-module signatures (24,489 cells from 21 tumors). Cells are grouped according to the gene-module (GM1-7) cell-state. Kruskal-Wallis tests were performed to calculate the significance between the four scSubtype score groups in each of the gene-module groups, p-value shown. Wilcox tests were used to identify which scSubtype had significantly increased scSubtype scores in the cells assigned to each gene-module, the scores of each scSubtype were compared to the rest of the scSubtype scores (****: Holm adjusted p-value < 0.0001, ns: Holm adjusted p-value > 0.05). Box plots in d and f depict the first and third quartiles as the lower and upper bounds, respectively. The whiskers represent 1.5x the interquartile range and the centre depicts the median.
Extended Data Fig. 4
Extended Data Fig. 4. CITE-Seq vignette
a, UMAP Visualization of a TNBC sample with 157 DNA barcoded antibodies (Supplementary Table 11). Cluster annotations were extracted from our final breast cancer atlas cell annotations. b, Heatmap visualization of the cluster averaged antibody derived tag (ADT) values for the 157 CITE-seq antibody panel. Only immune cells are shown. c-d, Expression featureplots of measured experimental ADT values (shown in top rows) against the CITE-Seq imputation ADT levels (shown in bottom rows), as determined using the seurat v3 method. Selected markers for immunophenotyping T-cells (c; CD4, CD8A, PD-1 and CD103) and myeloid cells (d; PD-L1, CD86, CD49f and CD14) are shown.
Extended Data Fig. 5
Extended Data Fig. 5. Supplementary data for T-cells and innate lymphoid cells.
a, Dotplot visualizing averaged expression of canonical markers across T-cell and innate lymphoid clusters. b, Cytotoxic and dysfunctional gene signature scores across T-cell and innate lymphoid clusters. A Kruskal-Wallis test was performed to compare significance between (pairwise two-sided t-test for each cluster compared to the mean, p-values denoted by asterisks: *p < 0.05, **p < 0.01, ***p < 0.001 and ****p < 0.0001). Red line indicates the median expression. c, Dysfunctional gene signature scores of CD8 : LAG3 and CD8+ T : IFNG clusters across clinical subtypes (n = 26; 11 TNBC, 10 ER+ and 5 HER2+). A pairwise two-sided t-test for each cluster was performed to determine significance. P-values denoted by asterisks: *p < 0.05, **p < 0.01, ***p < 0.001 and ****p < 0.0001. d, Differentially expressed immune modulator genes, stratified by T-cell and Myeloid clusters, compared across breast cancer subtypes. A pairwise MAST comparison was performed to obtain bonferroni corrected p-values. All genes displayed are statistically significant (p-value < 0.05). e, Pairwise two-sided t-test comparison of LAG3, CD27, PD-1 (PDCD1), CD70 and CD27 Log-normalised expression found in LAG3/c8 T-cells across breast cancer subtypes (n = 26; 11 TNBC, 10 ER+ and 5 HER2+). f, Enrichment of PDCD1, CD27, LAG3, CD70 expression in METABRIC cohort between clinical subtypes (n = 1,608; 209 Basal, 224 Her2, 700 LumA and 475 LumB). A pair-wise Wilcox test was performed to identify statistical significance. P-values denoted by asterisks: *p < 0.05, **p < 0.01, ***p < 0.001 and ****p < 0.0001. Box plots in b and f depict the first and third quartiles as the lower and upper bounds, respectively. The whiskers represent 1.5x the interquartile range and the centre depicts the median.
Extended Data Fig. 6
Extended Data Fig. 6. Gene expression of immune cell surface receptors across malignant, immune and mesenchymal clusters and breast cancer clinical subtypes
a, Averaged expression and clustering of 133 clinically targetable receptor or ligand immune modulator markers across all cell types grouped by clinical breast cancer subtypes (TNBC, HER2+ and ER+). Gene list was manually curated through systematic literature search of known immune modulating proteins expressed on the surface of cells. Default parameters for hierarchical clustering were used via the “pheatmap” package for the visualization of gene expression values.
Extended Data Fig. 7
Extended Data Fig. 7. Supplementary data for B-cells, Plasmablasts and Myeloid cells
a, UMAP visualization of all reclustered B-cells (n = 3,202 cells) and Plasmablasts (n = 3,525 cells) as annotated using canonical gene expression markers. b, Featureplots of CD27, IGHD, IGKC and IGLC2 across naïve B cells, memory B cells, and Plasmablasts. c, Tumour associated macrophage (TAM) signature score obtained from Cassetta et al. 2019 and the expression of log-normalised levels of CCL8 across all myeloid clusters (9,675 cells from 26 tumors). A pairwise two-sided t-test was performed to determine statistical significance for clusters of interest. P-values denoted by asterisks: *p < 0.05, **p < 0.01, ***p < 0.001 and ****p < 0.0001. Dashed red line marks median TAM module score or gene expression. A Kruskal-Wallis test was performed to compare significance between groups’. d, LAM and DC : LAMP3 gene expression signatures acquired from Jaitin et al. 2019 and Zhang et al. 2019 respectively, visualized on UMAP myeloid clusters. e, Heatmap visualizing GO enrichment pathways across Myeloid clusters. f, Proportional of myeloid clusters across clinical subtypes. Statistical significance was determined using a two-sided t-test in a pairwise comparison of means between groups (n = 26; 11 TNBC, 10 ER+ and 5 HER2+). P-values denoted by asterisks: *p < 0.05, **p < 0.01, ***p < 0.001 and ****p < 0.0001. g, Violin plot of Imputed CITE-seq PD-L1 and PD-L2 expression values found on Myeloid cells. Box plots in c and f depict the first and third quartiles as the lower and upper bounds, respectively. The whiskers represent 1.5x the interquartile range and the centre depicts the median.
Extended Data Fig. 8
Extended Data Fig. 8. Supplementary data for mesenchymal cell states and subclusters
a, UMAP visualization CAFs, PVL cells and endothelial cells using Seurat reclustered with default resolution parameters (0.8). b, Pseudotime plot for CAFs, PVL cells and endothelial cells, as determined using monocle. Coordinates are as in main Figure 5c, 5e and 5g. c, UMAP visualizations for CAFs, PVL cells and endothelial cells with monocle derived cell states overlaid. d, Heatmaps for CAFs, PVL cells and endothelial cells show cell state averaged log normalised expression values for all differentially expressed genes determined using the MAST method, with select stromal markers highlighted. e, Top 10 gene ontologies (GO) of each mesenchymal cell state, as determined using pathway enrichment with ClusterProfiler with all differentially expressed genes as input. f, Stromal cell state averaged signature scores for pancreatic ductal adenocarcinoma myofibroblast-like, inflammatory-like and antigen-presenting CAF sub-populations, as determined using AUCell. g, Enrichment of antigen-presenting CAF markers CLU, CD74 and CAV1 in various stromal cell states. h, Subclusters of CAFs, PVL cells and endothelial cells determined using Seurat show a strong integration with three normal breast tissue datasets, highlighting similarities in subclusters across disease status and clinical subtypes of breast cancer. i, Cell states of CAFs, PVL cells and endothelial cells determined using monocle show a strong integration with three normal breast tissue datasets and breast cancer clinical subtypes.
Extended Data Fig. 9
Extended Data Fig. 9. Supplementary data for spatial transcriptomics.
a, H&E images for the remaining five breast tumors analysed using Visium (TNBC: CID4465, 1142243F and 1160920F; ER+: CID4535 and CID4290). Scale bars represent 500 μm. b, Histograms of cancer deconvolution values, as estimated using Stereoscope. Red line indicates the 10% cutoff used to select spots for scoring breast cancer gene-modules. Spots are colored by the pathology annotation. c, Box plot of gene module scores for all cancer filtered spots, as determined using AUCell, grouped by sample (TNBC=red; ER=blue). Statistical significance was determined using a two-sided t-test, with p-values adjusted using the Benjamini–Hochberg procedure. Box plots depict the first and third quartiles as the lower and upper bounds, respectively. The whiskers represent 1.5x the interquartile range and the centre depicts the median. P-values denoted by asterisks: *p < 0.05, **p < 0.01, ***p < 0.001 and ****p < 0.0001. d, Clustered gene module correlations across all cancer filtered spots. Color scales represent Pearson correlation values and are scaled per GM (“n.s” denotes not significant; two-sided correlation coefficient, Benjamini–Hochberg adjusted p-value < 0.05). e, Heatmap of the deconvolution values for inflammatory-like CAFs, myofibroblast-like CAFs, Macrophage CXCL10/c9, LAM1 and LAM2 clusters. Spots (columns) are grouped by sample and pathology. Deconvolution abundances (rows) are scaled by cell type. f, Predicted signaling in tissue spots enriched for iCAFs and CD4/CD8+ T-cells. Spots filtered for CAF-ligands and T-cell receptors detected by scRNA-Seq. The mean interaction scores of cell-signaling pairs are defined as the product of the ligand and receptor expression. g, Plots of PD-1 (PDCD1; y axis) expression with PD-L1 (CD274; x axis) or PD-L2 (PDCD1LG2; x axis) expression in spots enriched for CD4/CD8+ T-cells and LAM2 cells, as determined by Stereoscope. Abundance of CD4/CD8 T-cells (combined as T_cell here) and LAM2 are overlaid on the expression plots.
Extended Data Fig. 10
Extended Data Fig. 10. Supplementary figure for CIBERSORTx cell-type deconvolution
a, Bar and boxplot (inset) of the Pearson correlation for 45 cell-types between the actual cell-fractions captured by scRNA-Seq and the CIBERSORTx predicted fractions from pseudo-bulk expression profiles (*denotes significance p<0.05, two-sided correlation coefficient). Inset box plot depicts the first and third quartiles as the lower and upper bounds, respectively. The whiskers represent 1.5x the interquartile range and the centre depicts the median. b, Barplot comparing the Pearson correlation for cell-types between the actual cell-fractions captured by scRNA-Seq and the CIBERSORTx (red) and DWLS (blue) predicted fractions from pseudo-bulk expression profiles (*denotes significance p<0.05, two-sided correlation coefficient). c, Boxplot comparing the CIBERSORTx predicted scSubtype and Cycling cell-fractions in each METABRIC tumor, stratified by PAM50 subtypes (n = 1,608; 209 Basal, 224 Her2, 700 LumA and 475 LumB). Box plots depicted as described in b. d, Heatmap of ecotypes formed from the common METABRIC tumors (columns) identified from combining ecotypes generated using CIBERSORTx with all 32 significantly correlated cell-types (rows), when using CIBERSORTx on pseudo-bulk samples. e-f, Relative proportion of the PAM50 subtypes (e) and major cell-types (f) in each ecotype, when combining CIBERSORTx consensus clustering results. g-h, Kaplan-Meier (KM) plot of all patients with common tumors in each of the ecotypes (g) and patients with tumors in ecotypes E4 and E7 (h), when combining CIBERSORTx consensus clustering results. p-values calculated using the log-rank test. i-j, Relative proportion of the PAM50 molecular subtypes (i) and major cell-types (j) of the common tumors from combining CIBERSORT and DWLS generated ecotypes. k, KM plot of the patients with tumors in ecotypes E4 and E7, formed from combining CIBERSORT and DWLS generated ecotypes. p-value calculated using the log-rank test. l, Relative proportion of the METABRIC integrative cluster annotations of the tumors in each ecotype, as determined using CIBERSORTx across all cell-types.
Figure 1.
Figure 1.
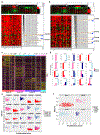
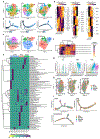
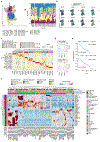
Cellular composition of primary breast cancers and the identification of malignant epithelial cells. a, Integrated dataset overview of 130,246 cells analyzed by scRNA-Seq. Clusters are annotated for their cell types as predicted using canonical markers and signature-based annotation using Garnett. b, Log normalized expression of markers for epithelial cells (EPCAM), proliferating cells (MKI67), T-cells (CD3D), myeloid cells (CD68), B-cells (MS4A1), plasmablasts (JCHAIN), endothelial cells (PECAM1) and mesenchymal cells (fibroblasts/perivascular-like; PDGFRB). c, Relative proportions of cell types highlighting a strong representation of the major lineages across tumors and clinical subtypes. d-f, UMAP visualization of all epithelial cells, from tumours with at least 200 epithelial cells, colored by tumor (d), clinical subtype (e) and inferCNV classification (f).
Figure 2.
Figure 2.
Identifying drivers of neoplastic breast cancer cell heterogeneity. a, Heatmap showing the average expression (scaled) of all cells assigned to each of the four scSubtypes. The top-5 most highly expressed genes in each subtype are shown, and selected others are highlighted. b, Percentage of neoplastic cells in each tumor that are classified as each of the scSubtypes. Tumor samples are grouped according to their Allcells-pseudobulk classifications (NL = Normal-like). c, Representative images of CK5 (top) and ER (bottom) immunohistochemistry (IHC) from two tumors (CID4066, left; CID4290, right) with intrinsic subtype heterogeneity from b (n = 24 breast tumors analysed). The left panel represents whole tissue sections, with two regions of interest labelled (A and B). The middle panel represents CK5-/ER+ areas (insert A), whilst the right panel shows CK5+/ER− areas (insert B). Scale bar represent 100 μm. d, Scatter plot of the proliferation scores and Differentiation Scores (DScores) of each neoplastic cell. Individual cancer cells are colored and grouped based on the scSubtype calls. All pairwise comparisons between cells from each scSubtype were significantly different (Wilcox test p<0.001) for both proliferation and DScores. e, Gene-set enrichment, using ClusterProfiler, of the 200 genes in each of the gene-modules (GM1-7). Significantly enriched (bonferroni adjusted p-value < 0.05) gene-sets from the MSigDB HALLMARK collection are shown. f, Proportion of cells assigned to each of the scSubtype subtypes grouped according to gene-module. g, Scaled signature scores of each of the seven intra-tumor transcriptional heterogeneity gene-modules (rows) across all individual neoplastic cells (columns). Cells are ordered based on the strength of the gene-module signature score. h, Percentage of neoplastic cells assigned to each of the seven gene-modules.
Figure 3.
Figure 3.
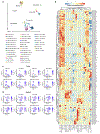
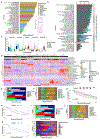
T-cell and Innate lymphoid cell landscape of breast cancers. a, Reclustering T-cells and innate lymphoid cells and their relative proportions across tumors and clinical subtypes (n = 35,233 cells from 26 tumors). b, Imputed CITE-Seq protein expression values for selected markers and checkpoint molecules. c, Pairwise t-test comparisons revealing the significant enrichment of T-cells : IFIT1, T-cells : KI67, CD8+ T-cells : LAG3 in TNBC tumors, (n = 26; 11 TNBC, 10 ER+ and 5 HER2+). Box plots depict the first and third quartiles as the lower and upper bounds, respectively. The whiskers represent 1.5x the interquartile range and the centre depicts the median. Statistical significance was determined using a two-sided t-test in a pairwise comparison of means between groups, with p-values adjusted using the Benjamini–Hochberg procedure. P-values denoted by asterisks: *p < 0.05, p < 0.01, *p < 0.001 and ****p < 0.0001. d, Cluster averaged dysfunctional and cytotoxic effector gene signature scores in T-cells and innate lymphoid cells stratified by clinical subtypes.
Figure 4.
Figure 4.
Myeloid landscape of breast cancers. a, Reclustered myeloid cells and their relative proportions across tumors and clinical subtypes (n = 9,678 cells from 26 tumors). b, Imputed CITE-Seq expression values for canonical markers and checkpoint molecules across Myeloid clusters. c, Cluster averaged expression of various published gene signatures acquired from independent studies used for Myeloid cluster annotation. Selected genes of interest from each signature are listed. d, Proportions of LAM 1 : FABP5 and LAM 2: APOE (n = 26; 11 TNBC, 10 ER+ and 5 HER2+) across clinical subtypes. Box plot depict the first and third quartiles as the lower and upper bounds, respectively. The whiskers represent 1.5x the interquartile range and the centre depicts the median. Statistical significance was determined using a two-sided t-test in a pairwise comparison of means between groups, with p-values adjusted using the Benjamini–Hochberg procedure. P-values denoted by asterisks: *p < 0.05, p < 0.01, *p < 0.001 and ****p < 0.0001. e, Kaplan Meier plots showing associations between LAM 1 : FABP5 or LAM 2 : APOE with overall survival in METABRIC cohort (top 30% and bottom 30%, n = 180 per group). P-values were calculated using log-rank test. Time (x-axis) is represented in months. f, Cluster averaged gene expression of clinically relevant immunotherapy targets. Clusters are grouped by breast cancer clinical subtype and immune cell type annotations. Genes are grouped as receptor (purple) or ligand (green), the inhibitory (red) or stimulatory status (blue) and the expected major lineage cell types known to express the gene (lymphocyte, green; myeloid, pink; both, light purple).
Figure 5.
Figure 5.
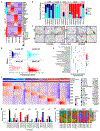
Transcriptional profiling and phenotyping of diverse mesenchymal differentiation states across breast cancers. a, UMAP visualization of reclustered mesenchymal cells, including CAFs (6,573 cells), perivascular-like (PVL) cells (5,423 cells), endothelial cells (7,899 cells; ECs), lymphatic ECs (203 cells) and cycling PVL (50 cells). Cell sub-states are defined using pseudotemporal ordering using Monocle (as in c-h). b, Featureplots of canonical markers for CAFs (PDGFRA, COL1A1, ACTA2, PDGFRB), PVL (ACTA2, PDGFRB and MCAM) and ECs (PECAM1, CD34 and VWF). UMAP axes correspond to Figure 5a. c–h, Cell states and the expression of genes that change as a function of pseudotime for CAFs (c-h), PVL cells (e-f) and ECs (g-h). c-d, Five states of CAFs: CAF s1 and s2 both resemble mesenchymal stem cells (MSC; ALDH1A1) and inflammatory CAF-like states (iCAF; CXCL12); CAF s2 was distinct from s1 by DLK1; CAF s4 and s5 resemble myofibroblast-like states (myCAF; ACTA2) which were enriched for ECM genes (COL1A1); transitioning CAF s3 shared features of both MSC/iCAFs and myCAFs. e-f, Three PVL states: s1 and s2 resemble progenitor and immature states (imPVL; ALDH1A1); PVL s3 resembles a contractile and differentiated state (dPVL; MYH11). g-h, Three EC states: s1 resemble a venular stalk-like state (ACKR1) and two tip-like states (DLL4), s2 and s3, that are distinguished by RGS5 and CXCL12, respectively. i, Featureplots of imputed CITE-Seq antibody-derived tag (ADT) protein levels for canonical markers of CAFs (PDPN), PVL cells (CD146/MCAM) and ECs (CD31 and CD34). UMAP coordinates correspond to those in a. j, Heatmap of cluster averaged imputed CITE-Seq values for additional cell surface markers and functional molecules.
Figure 6.
Figure 6.
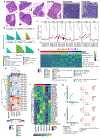
Mapping breast cancer heterogeneity using spatial transcriptomics. a, Complete H&E images of all three tissue regions analysed using Visium for the sample TNBC CID44971. Pathological annotation of morphological regions into distinct categories including normal ductal (green), stroma and adipose (blue), lymphocyte aggregates (yellow), ductal carcinoma in-situ (DCIS; orange) and invasive cancer (red). Black scale bars represent 500 μm. b, Deconvolution of the major cell type lineages in TNBC CID44971. Values signify the scaled cell type abundances per spots (columns), and are grouped by pathology annotation as in a. c, Box plot of gene module scores grouped by clinical subtype across the six cases (n = 11,535 spots from 4 x TNBC tumors and 2 x ER tumors). Only cancer filtered spots were used for this analysis. Signature scores were computed using the AUCell method. Statistical significance was determined using a two-sided t-test in a comparison of means between groups, with p-values adjusted using the Benjamini–Hochberg procedure. Box plots depict the first and third quartiles as the lower and upper bounds, respectively. The whiskers represent 1.5x the interquartile range and the centre depicts the median. P-values denoted by asterisks: *p < 0.05, **p < 0.01, ***p < 0.001 and ****p < 0.0001. d, Pearson correlation heatmap of breast cancer gene modules in TNBC CID44971 (“n.s” represent non-significant correlations; two-sided correlation coefficient, Benjamini–Hochberg adjusted p-values < 0.05). Spots with high cancer epithelial abundances (>10%), were scored with gene module (GM) signatures using AUCell. e, Negative correlation between GM3 (EMT) and GM4 (Proliferation/Cell Cycle) across all cancer epithelial spots from six breast cancers analysed by ST (two-sided correlation coefficient, *denotes p-value < 0.05). f-g, Scaled AUCell signature scores of GM3 (f) and GM4 (g) overlaid onto cancer epithelial spots in TNBC CID44971, as defined in the bottom left and right tissue sections in Figure 6a.
Figure 7.
Figure 7.
Spatially mapping novel heterotypic cellular interactions. a, Heatmap of Pearson correlation values between subclasses of CAFs, PVL cells, endothelial cells, macrophage subsets and lymphocytes in 13 cases (two-sided correlation coefficient, *denotes Benjamini–Hochberg adjusted p-value < 0.05). Each tumor is stratified by the clinical subtype, including four TNBC (blue) and two ER+ (red) analysed in this study and seven HER2+ (pink) cases from the Lundeberg et al. study. b-e, Scaled deconvolution values for iCAFs (b), myCAFs (c), CD4+ (d) and CD8+ T-cells (e) overlaid onto tissue spots, as defined in the bottom left and right tissue sections in Figure 6a. Representative TNBC case CID44971 is shown. f, Spatial proximity of selected CAF T-cell signalling molecules. Heatmap of interaction scores for selected ligand receptor pairs in the top 10% of tissue spots enriched for iCAFs and CD4/CD8+ T-cells. Only differentially expressed CAF-ligands and T-cell receptors detected by scRNA-Seq using MAST were included. g, Scaled deconvolution values for Macrophage CXCL10/c9 cells overlaid onto tissue spots, as defined in Figure 6a. Representative TNBC case CID44971 is shown.
Figure 8.
Figure 8.
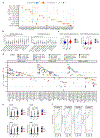
Deconvolution of breast cancer cohorts using single-cell signatures reveals robust ecotypes associated with patient survival and intrinsic subtypes. a, Consensus clustering of all tumors (columns) in METABRIC showing nine robust tumor ecotypes and 4 groups of cell enrichments from 45 cell-types in the breast cancer cell taxonomy. Total 1,985 tumors (E1 = 266, E2= 269, E3 = 205, E4 = 263, E5 = 195, E6 = 215, E7 = 199, E8 = 213, E9 = 160). b, Relative proportion of the PAM50 molecular subtypes of the tumors in each ecotype. c, Relative average proportion of the major cell-types enriched in the tumors in each ecotype. d-f, Kaplan-Meier (KM) plot of the patients with tumors in each of the nine ecotypes (d), patients with tumors in ecotypes E2 and E7 (e), patients with tumors in ecotypes E4 and E7 (f). p-values calculated using the log-rank test. g, Summary of the major epithelial, immune and stromal cell types identified in this study grouped by their major (inner), minor and subset (outer) level classification tiers.

References

    1. Kim HK et al. Discordance of the PAM50 Intrinsic Subtypes Compared with Immunohistochemistry-Based Surrogate in Breast Cancer Patients: Potential Implication of Genomic Alterations of Discordance. Cancer Res Treat 51, 737–747 (2019). - PMC - PubMed
    1. Picornell AC et al. Breast cancer PAM50 signature: correlation and concordance between RNA-Seq and digital multiplexed gene expression technologies in a triple negative breast cancer series. BMC Genomics 20, 452 (2019). - PMC - PubMed
    1. Parker JS et al. Supervised risk predictor of breast cancer based on intrinsic subtypes. J Clin Oncol 27, 1160–7 (2009). - PMC - PubMed
    1. Perou CM et al. Molecular portraits of human breast tumours. Nature 406, 747–52 (2000). - PubMed
    1. Sorlie T et al. Gene expression patterns of breast carcinomas distinguish tumor subclasses with clinical implications. Proc Natl Acad Sci U S A 98, 10869–74 (2001). - PMC - PubMed

Publication types

MeSH terms