

SERS-based lateral flow immunoassay for sensitive and simultaneous detection of anti-SARS-CoV-2 IgM and IgG antibodies by using gap-enhanced Raman nanotags
- PMID: 34493903
- PMCID: PMC8413105
- DOI: 10.1016/j.snb.2021.130706
SERS-based lateral flow immunoassay for sensitive and simultaneous detection of anti-SARS-CoV-2 IgM and IgG antibodies by using gap-enhanced Raman nanotags
Abstract
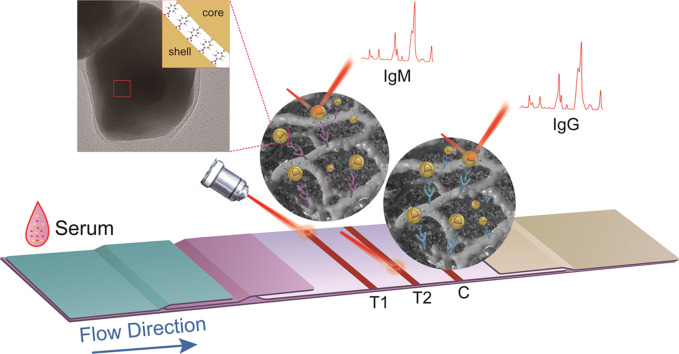
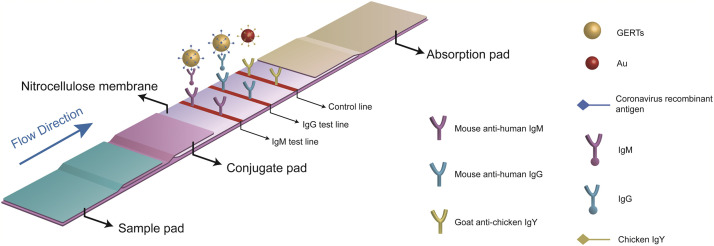
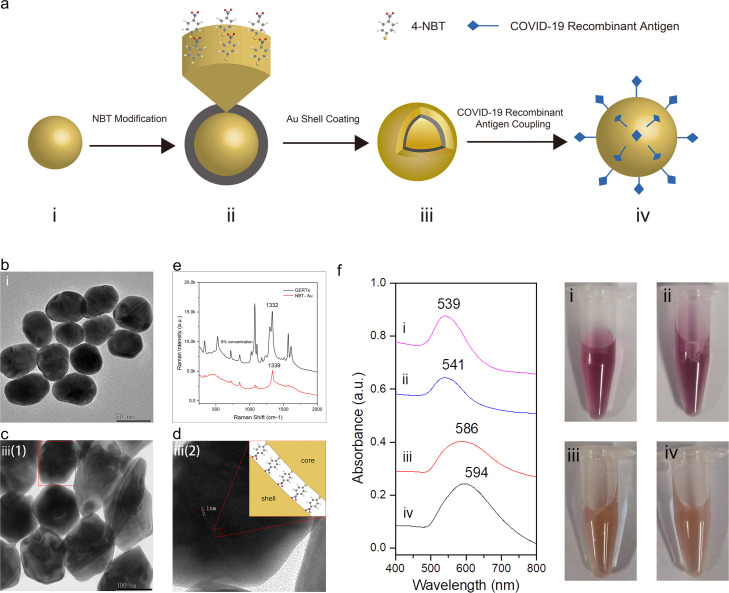
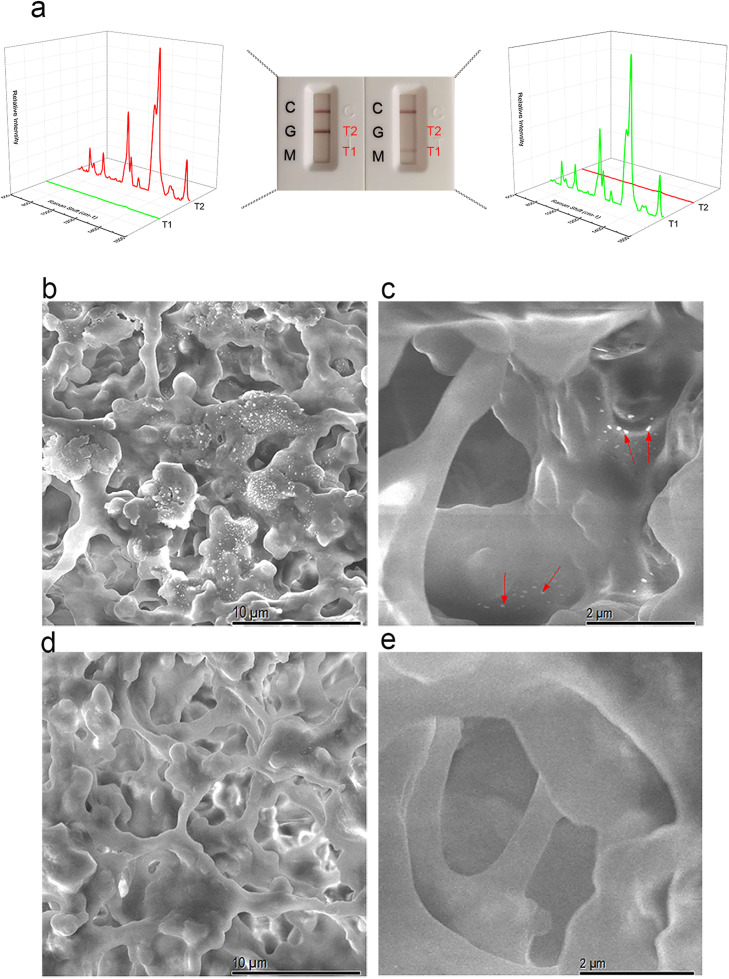
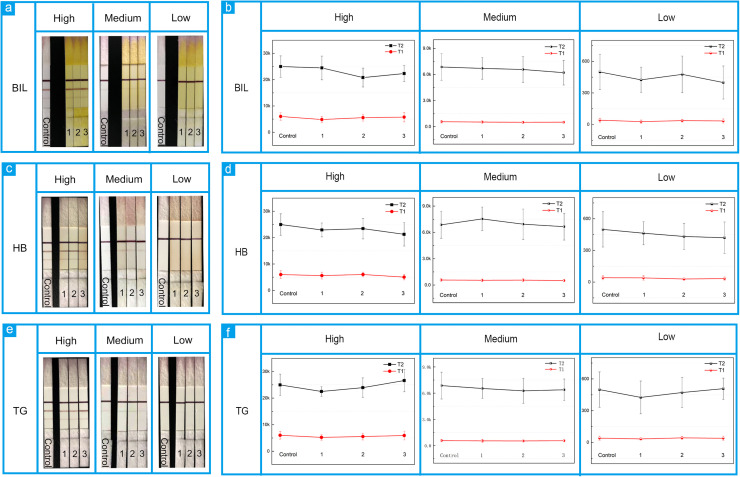
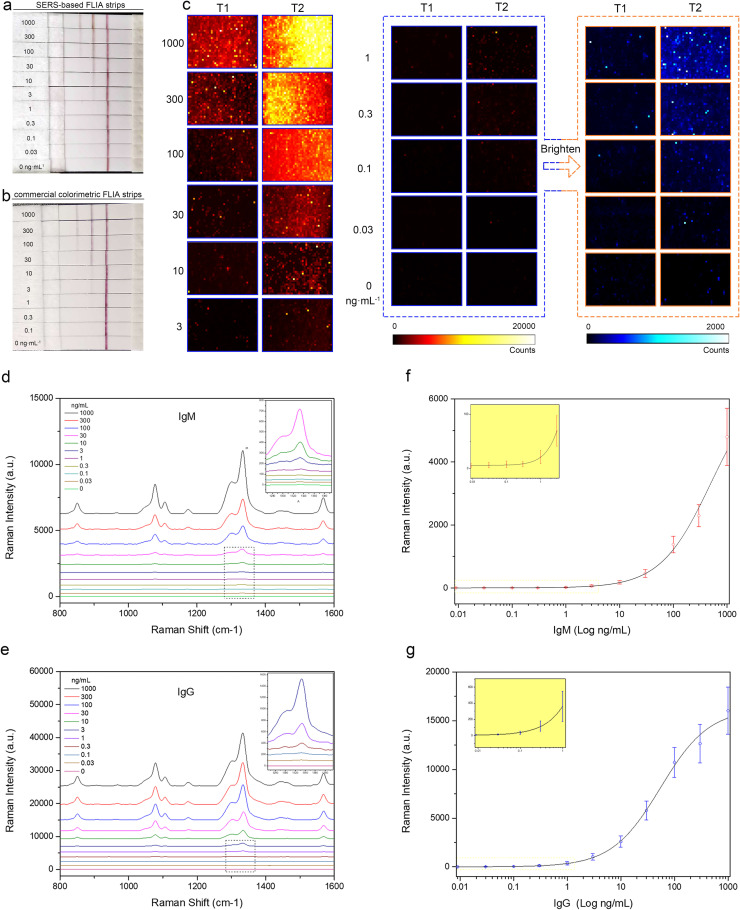
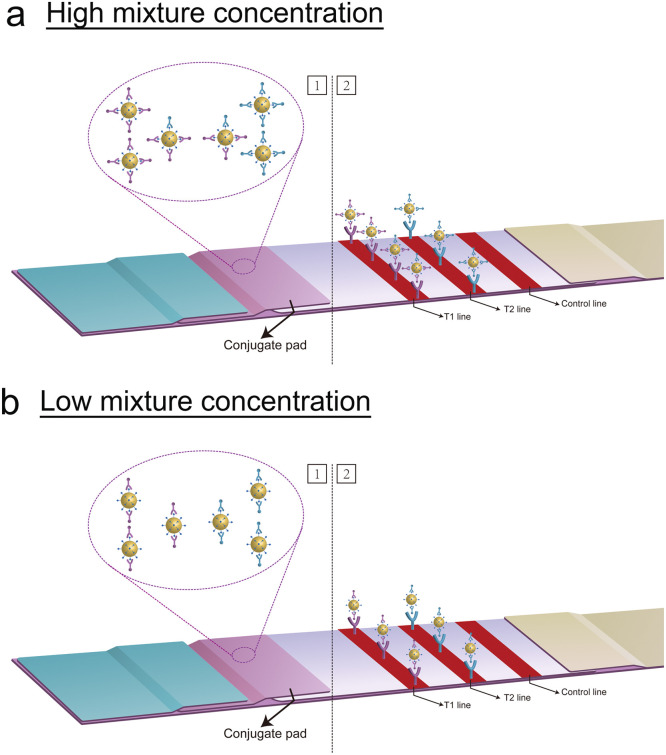
The lateral flow immunoassay (LFIA) has played a crucial role in early diagnosis during the current COVID-19 pandemic owing to its simplicity, speed and affordability for coronavirus antibody detection. However, the sensitivity of the commercially available LFIAs needs to be improved to better prevent the spread of the infection. Here, we developed an ultra-sensitive surface-enhanced Raman scattering-based lateral flow immunoassay (SERS-based LFIA) strip for simultaneous detection of anti-SARS-CoV-2 IgM and IgG by using gap-enhanced Raman nanotags (GERTs). The GERTs with a 1 nm gap between the core and shell were used to produce the "hot spots", which provided about 30-fold enhancement as compared to conventional nanotags. The COVID-19 recombinant antigens were conjugated on GERTs surfaces and replaced the traditional colloidal gold for the Raman sensitive detection of human IgM and IgG. The LODs of IgM and IgG were found to be 1 ng/mL and 0.1 ng/mL (about 100 times decrease was observed as compared to commercially available LFIA strips), respectively. Moreover, under the condition of common nano-surface antigen, precise SERS signals proved the unreliability of quantitation because of the interference effect of IgM on IgG.
Keywords: COVID-19; Gap-enhanced Raman nanotags (GERTs); IgM/IgG; Lateral flow immunoassay; SARS-CoV-2; Surface-enhanced Raman scattering (SERS).
© 2021 Elsevier B.V. All rights reserved.
Conflict of interest statement
The authors declare that they have no known competing financial interests or personal relationships that could have appeared to influence the work reported in this paper.None.
Figures
Similar articles
-
Development of a SERS-based lateral flow immunoassay for rapid and ultra-sensitive detection of anti-SARS-CoV-2 IgM/IgG in clinical samples.Sens Actuators B Chem. 2021 Feb 15;329:129196. doi: 10.1016/j.snb.2020.129196. Epub 2020 Nov 18. Sens Actuators B Chem. 2021. PMID: 33230369 Free PMC article.
-
Multiplexed lateral flow immunoassays using high photostability gap-enhanced Raman nanotags: Highly sensitive, rapid, efficient and portable point-of-care tests.Biosens Bioelectron. 2025 Jun 15;278:117377. doi: 10.1016/j.bios.2025.117377. Epub 2025 Mar 14. Biosens Bioelectron. 2025. PMID: 40107069
-
Lateral Flow Immunoassay of SARS-CoV-2 Antigen with SERS-Based Registration: Development and Comparison with Traditional Immunoassays.Biosensors (Basel). 2021 Dec 10;11(12):510. doi: 10.3390/bios11120510. Biosensors (Basel). 2021. PMID: 34940267 Free PMC article.
-
SERS Based Lateral Flow Immunoassay for Point-of-Care Detection of SARS-CoV-2 in Clinical Samples.ACS Appl Bio Mater. 2021 Apr 19;4(4):2974-2995. doi: 10.1021/acsabm.1c00102. Epub 2021 Mar 17. ACS Appl Bio Mater. 2021. PMID: 35014387 Review.
-
Development and Efficacy of Lateral Flow Point-of-Care Testing Devices for Rapid and Mass COVID-19 Diagnosis by the Detections of SARS-CoV-2 Antigen and Anti-SARS-CoV-2 Antibodies.Diagnostics (Basel). 2021 Sep 24;11(10):1760. doi: 10.3390/diagnostics11101760. Diagnostics (Basel). 2021. PMID: 34679458 Free PMC article. Review.
Cited by
-
Raman Scattering-Based Biosensing: New Prospects and Opportunities.Biosensors (Basel). 2021 Dec 13;11(12):512. doi: 10.3390/bios11120512. Biosensors (Basel). 2021. PMID: 34940269 Free PMC article. Review.
-
Recent progress on field-effect transistor-based biosensors: device perspective.Beilstein J Nanotechnol. 2024 Aug 6;15:977-994. doi: 10.3762/bjnano.15.80. eCollection 2024. Beilstein J Nanotechnol. 2024. PMID: 39136041 Free PMC article. Review.
-
Current Advances in Paper-Based Biosensor Technologies for Rapid COVID-19 Diagnosis.Biochip J. 2022;16(4):376-396. doi: 10.1007/s13206-022-00078-9. Epub 2022 Aug 10. Biochip J. 2022. PMID: 35968255 Free PMC article. Review.
-
Recent Progress on Rapid Lateral Flow Assay-Based Early Diagnosis of COVID-19.Front Bioeng Biotechnol. 2022 May 3;10:866368. doi: 10.3389/fbioe.2022.866368. eCollection 2022. Front Bioeng Biotechnol. 2022. PMID: 35592553 Free PMC article. Review.
-
Challenges in the Detection of SARS-CoV-2: Evolution of the Lateral Flow Immunoassay as a Valuable Tool for Viral Diagnosis.Biosensors (Basel). 2022 Sep 5;12(9):728. doi: 10.3390/bios12090728. Biosensors (Basel). 2022. PMID: 36140114 Free PMC article. Review.
References
-
- Amanat F., Stadlbauer D., Strohmeier S., Nguyen T.H.O., Chromikova V., McMahon M., Jiang K., Arunkumar G.A., Jurczyszak D., Polanco J., Bermudez-Gonzalez M., Kleiner G., Aydillo T., Miorin L., Fierer D.S., Lugo L.A., Kojic E.M., Stoever J., Liu S., Cunningham-Rundles C., Felgner P.L., Moran T., García-Sastre A., Caplivski D., Cheng A.C., Kedzierska K., Vapalahti O., Hepojoki J.M., Simon V., Krammer F. A serological assay to detect SARS-CoV-2 seroconversion in humans. Nat. Med. 2020;26:1033–1036. - PMC - PubMed
LinkOut - more resources
Full Text Sources
Miscellaneous
