[Preprint]. 2021 Sep 2:2021.08.28.21262748.
doi: 10.1101/2021.08.28.21262748.

Projected resurgence of COVID-19 in the United States in July-December 2021 resulting from the increased transmissibility of the Delta variant and faltering vaccination

Affiliations

Projected resurgence of COVID-19 in the United States in July-December 2021 resulting from the increased transmissibility of the Delta variant and faltering vaccination

Shaun Truelove et al. medRxiv. .

Update in

  • Projected resurgence of COVID-19 in the United States in July-December 2021 resulting from the increased transmissibility of the Delta variant and faltering vaccination.
    Truelove S, Smith CP, Qin M, Mullany LC, Borchering RK, Lessler J, Shea K, Howerton E, Contamin L, Levander J, Kerr J, Hochheiser H, Kinsey M, Tallaksen K, Wilson S, Shin L, Rainwater-Lovett K, Lemairtre JC, Dent J, Kaminsky J, Lee EC, Perez-Saez J, Hill A, Karlen D, Chinazzi M, Davis JT, Mu K, Xiong X, Pastore Y Piontti A, Vespignani A, Srivastava A, Porebski P, Venkatramanan S, Adiga A, Lewis B, Klahn B, Outten J, Orr M, Harrison G, Hurt B, Chen J, Vullikanti A, Marathe M, Hoops S, Bhattacharya P, Machi D, Chen S, Paul R, Janies D, Thill JC, Galanti M, Yamana TK, Pei S, Shaman JL, Healy JM, Slayton RB, Biggerstaff M, Johansson MA, Runge MC, Viboud C. Truelove S, et al. Elife. 2022 Jun 21;11:e73584. doi: 10.7554/eLife.73584. Elife. 2022. PMID: 35726851 Free PMC article.

Abstract

What is already known about this topic?: The highly transmissible SARS-CoV-2 Delta variant has begun to cause increases in cases, hospitalizations, and deaths in parts of the United States. With slowed vaccination uptake, this novel variant is expected to increase the risk of pandemic resurgence in the US in July-December 2021.

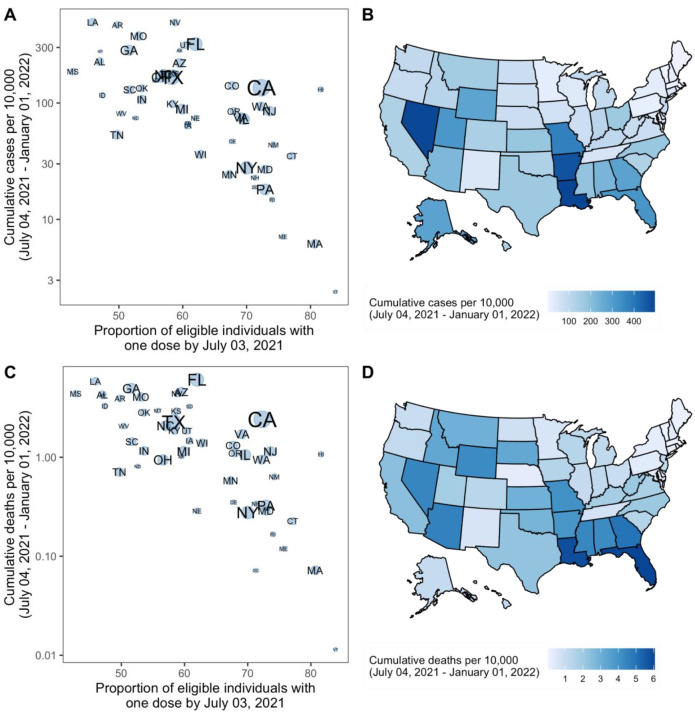
What is added by this report?: Data from nine mechanistic models project substantial resurgences of COVID-19 across the US resulting from the more transmissible Delta variant. These resurgences, which have now been observed in most states, were projected to occur across most of the US, coinciding with school and business reopening. Reaching higher vaccine coverage in July-December 2021 reduces the size and duration of the projected resurgence substantially. The expected impact of the outbreak is largely concentrated in a subset of states with lower vaccination coverage.

What are the implications for public health practice?: Renewed efforts to increase vaccination uptake are critical to limiting transmission and disease, particularly in states with lower current vaccination coverage. Reaching higher vaccination goals in the coming months can potentially avert 1.5 million cases and 21,000 deaths and improve the ability to safely resume social contacts, and educational and business activities. Continued or renewed non-pharmaceutical interventions, including masking, can also help limit transmission, particularly as schools and businesses reopen.


Figures

FIGURE 1.
FIGURE 1.. Historical data and weekly ensemble projections of reported numbers of COVID-19 cases (A), hospitalizations (B), and deaths (C) under four scenarios representing different levels of vaccination and Delta variant transmissibility increase — United States, October, 2020–December, 2021.
Projections are ensemble estimates of 9 models projecting four 6-month scenarios with 95% prediction intervals (the grey shading encompasses the prediction intervals from all four scenarios). Projections used empirical data from up to July 3, 2021, to calibrate models. The vertical lines indicate the beginning of each projection, only data available prior to that point were used to fit the projections.
FIGURE 2.
FIGURE 2.. Projected cumulative cases and mortality in the most pessimistic scenario (low vaccination, high variant transmissibility) and current vaccination coverage by state — United States, July 4 2021–January 1, 2022.
(A) Correlation between cumulative projected cases per 10,000 population during the 6-month period and proportion of the eligible population vaccinated with at least one COVID-19 vaccine dose by July 3, 2021, by state. Circle sizes represent population size. (B) Cumulative projected cases per 10,000 population during the 6-month period, by state. (C) Correlation between cumulative projected deaths per 10,000 population during the 6-month period and proportion of the eligible population vaccinated with at least one COVID-19 vaccine dose by July 3, 2021, by state. Circle sizes represent population size. (D) Cumulative projected deaths per 10,000 population during the 6-month period, by state.
FIGURE 3.
FIGURE 3.. Comparison of the median projected and observed state-level total COVID-19 case incidences occurring during July 4–31, 2021, United States.
Comparison is based on ranking of incidence per capita in 50 states + DC (Spearman’s rank correlation=0.867). The grey solid line represents perfect agreement between ranks (y=x), while the dashed line and grey shaded area represent a regression line fitted to the data, with confidence intervals.

References

    1. Centers for Disease Control and Prevention. COVID Data Tracker. https://covid.cdc.gov/covid-data-tracker/#nowcast (accessed June 19, 2021).
    1. Borchering RK, Viboud C, Howerton E, et al.Modeling of Future COVID-19 Cases, Hospitalizations, and Deaths, by Vaccination Rates and Nonpharmaceutical Intervention Scenarios — United States, April–September 2021. MMWR Morb Mortal Wkly Rep 2021; 70: 719–24. - PMC - PubMed
    1. COVID-19 Scenario Modeling Hub. COVID-19 Scenario Modeling Hub. https://covid19scenariomodelinghub.org/viz.html.
    1. Johns Hopkins University & Medicine. Coronavirus Resource Center. 2020. https://coronavirus.jhu.edu/region/mexico (accessed May 29, 2021).
    1. US Department of Health and Human Services. COVID-19 Reported Patient Impact and Hospital Capacity by State Timeseries. 2020. https://healthdata.gov/Hospital/COVID-19-Reported-Patient-Impact-and-Hos... (accessed May 29, 2021).

Publication types