. 2021 Sep 15;134(18):jcs259221.
doi: 10.1242/jcs.259221. Epub 2021 Sep 24.

Rab7b regulates dendritic cell migration by linking lysosomes to the actomyosin cytoskeleton

Affiliations

Rab7b regulates dendritic cell migration by linking lysosomes to the actomyosin cytoskeleton

Katharina Vestre et al. J Cell Sci. .

Abstract

Lysosomal signaling facilitates the migration of immune cells by releasing Ca2+ to activate the actin-based motor myosin II at the cell rear. However, how the actomyosin cytoskeleton physically associates to lysosomes is unknown. We have previously identified myosin II as a direct interactor of Rab7b, a small GTPase that mediates the transport from late endosomes/lysosomes to the trans-Golgi network (TGN). Here, we show that Rab7b regulates the migration of dendritic cells (DCs) in one- and three-dimensional environments. DCs are immune sentinels that transport antigens from peripheral tissues to lymph nodes to activate T lymphocytes and initiate adaptive immune responses. We found that the lack of Rab7b reduces myosin II light chain phosphorylation and the activation of the transcription factor EB (TFEB), which controls lysosomal signaling and is required for fast DC migration. Furthermore, we demonstrate that Rab7b interacts with the lysosomal Ca2+ channel TRPML1 (also known as MCOLN1), enabling the local activation of myosin II at the cell rear. Taken together, our findings identify Rab7b as the missing physical link between lysosomes and the actomyosin cytoskeleton, allowing control of immune cell migration through lysosomal signaling. This article has an associated First Person interview with the first author of the paper.

Keywords: Actomyosin; Cell migration; Dendritic cells; Rab protein; Rab7b.


Conflict of interest statement

Competing interests The authors declare no competing or financial interests.

Figures

Fig. 1.
Fig. 1.
Rab7b is required for DC polarization. (A) MDDCs were transfected by electroporation with either control siRNA or Rab7b siRNA, and stimulated with LPS for 48 h. Thereafter, DCs were plated on PLL-coated coverslips and left to adhere for additional 24 h, before fixation and immunostaining with anti-myosin II (green). Actin was labeled with Rhodamine-conjugated phalloidin (red) and nuclei with Hoechst 33258 (blue). Images represent maximum intensity projections of Z stacks. Scale bars: 10 µm. (B) Quantification of the percentage of polarized cells. Polarized cells have a clear podosome-rich leading edge and a trailing edge devoid of podosomes. Cells with podosomes equally distributed and with no distinction between leading and trailing edges are accounted as not polarized. Data represent the mean±s.d. of three independent experiments (n>145). **P<0.005 (two-tailed unpaired Student's t-test). (C,D) Quantification of the number (C) and size (D) of podosomes per cell. The graphs show the mean±s.d. from three independent experiments (n>120).
Fig. 2.
Fig. 2.
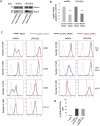
Rab7b depletion does not affect DC maturation and antigen presentation ability. (A) MDDCs were transfected by electroporation with either control siRNA or Rab7b siRNA. 18 h (for immature DCs; imDCs) or 48 h (for LPS-DCs) after transfection the DCs were harvested, lysed and subjected to western blot analysis with antibodies against Rab7b and tubulin as a loading control. (B) Quantification of Rab7b levels in MDDCs silenced with control siRNA or Rab7b siRNA. The intensity of the bands from western blots was quantified using ImageQuant, and the level of Rab7b was normalized to the amount of tubulin. Data represent the mean±s.d. of three independent experiments. ***P<0.0001 (two-tailed unpaired Student's t-test). (C) FACS analysis of the surface expression markers CD80, CD86 CD83 and CD11c (left panels), and HLA-DR, HLA class I and CCR7 (right panels). A representative histogram overlay is shown for each marker. The black line represents mock electroporated (without siRNA) MDDCs, the blue line the control siRNA and the red line the Rab7b siRNA electroporated MDDCs. The gray line corresponds to isotype antibodies. The x-axis represents the mean fluorescence intensity of the conjugated markers indicated for each histogram. The histograms are representative examples from one out of three independent experiments. All experiments were repeated three independent times. (D) Radium-1 TCR-expressing T cells were stimulated for 5 h with either control siRNA- or Rab7b siRNA-treated DCs loaded with a specific 19-mer peptide encoded by the TGFBR2 frameshift mutation. An anti-CD107a antibody was used to assess the amount of degranulation by CD8+ cytotoxic T cells specifically activated by DCs. Data represents the mean±s.d. of three independent experiments.
Fig. 3.
Fig. 3.
Rab7b is required for fast and persistent migration of LPS-DCs. (A) Scheme of a micro-fabricated device used to study DC motility under confinement. Cells are loaded in the loading chambers, and spontaneously enter into the microchannels (inset with arrows indicating entry points). (B) BMDCs were either mock treated or LPS-treated for 20 min, before transfection with either control siRNA or Rab7b siRNA. DCs were loaded in 5×5 µm micro-fabricated channels and imaged for 20 h in an epifluorescence Nikon TiE microscope equipped with a cooled CCD camera, using a 10× objective and acquiring one transmission phase image every 2 min. Representative kymographs are shown for DCs treated with either control siRNA, with or without LPS (left panels), or Rab7b siRNA, with or without LPS (right panels). Scale bars: horizontal (distance), 20 µm; vertical (time), 30 min. (C) Quantification of the mean±s.d cell speed (µm/min). n>150, three independent experiments. *P<0.05 (two-tailed unpaired Student's t-test). (D) Quantification of mean±s.d. speed fluctuations [calculated as s.d./mean instantaneous speed (Chabaud et al., 2015; Faure-Andre et al., 2008)]. n>150, three independent experiments. *P<0.05 (two-tailed unpaired Student's t-test). (E) Chemotactic response of LPS-DCs embedded in a collagen gel containing a CCL21 gradient. The plot represents movement in the x- and y-direction of single cells, each track starting at distance 0, from one representative experiment. (F) Quantification of the mean cell speed of WT and Rab7b KO LPS-DCs. Data represents the mean±s.d. of four independent experiments (n=238 and 284 cells for WT and Rab7b-KO, respectively). *P<0.05 (two-tailed paired Student's t-test). (G) Quantification of the cell persistency of WT and Rab7b KO LPS-DCs. Cell persistency was calculated by dividing the Euclidian distance with the accumulated distance of each cell trajectory, and is presented relative to WT. Data represents the mean±s.d. of four independent experiments (n=238 and 284 cells for WT and Rab7b-KO, respectively). *P<0.05 (two-tailed unpaired Student's t-test).
Fig. 4.
Fig. 4.
Rab7b affects actomyosin distribution. (A,B) LPS-DCs were loaded in 5×8 µm micro-fabricated channels, fixed after 16 h and stained with an antibody against myosin II. The intensity of each cell for each condition was averaged into a single density map. One representative experiment out of three is shown. imDCs, immature DCs. (C) Quantification of the myosin front-to-back ratio. Data represents the mean±s.d. of three independent experiments (n>48 cells for each condition). *P<0.05; ***P<0.001 (two-tailed unpaired Student's t-test). (D) LPS-DCs were loaded in 5×8 µm micro-fabricated channels, fixed after 16 h and labeled with Rhodamine-conjugated phalloidin to visualize actin. The intensity of each cell for each condition was averaged into a single density map. One representative experiment out of three is shown. (E) Quantification of the F-actin front-to-back rratio relative to WT. Data represents the mean±s.d. of three independent experiments (n=51 and 57 cells for WT and Rab7b KO, respectively). *P<0.05 (two-tailed unpaired Student's t-test). (F) LPS-DCs were loaded in 5×8 µm micro-fabricated channels, fixed after 16 h and labeled with Rhodamine-conjugated phalloidin to visualize actin. Representative images from one out of three independent experiments are shown. Images are inverted to improve visualization. Scale bars: 5 µm.
Fig. 5.
Fig. 5.
Rab7b affects macropinocytosis and lysosome signaling. (A) LPS-DCs were loaded in 5×8 µm micro-fabricated channels. After 16 h, the channels were filled with 10 kDa Alexa Fluor 647-conjugated dextran (magenta) and the cells were imaged 30 min later. Representative images of live WT and Rab7b KO cells are shown. Scale bars: 10 µm. (B) Quantification of the area of internalized dextran in WT and Rab7b KO cells. The graph represents the mean±s.d. of three independent experiments (n=39 and 32 cells for WT and Rab7b-KO, respectively). *P<0.05 (two-tailed unpaired Student's t-test). (C) Distribution of macropinosome numbers for WT and Rab7b KO cells from three independent experiments. Data represents the mean±s.d. (n=39 and 32 cells for WT and Rab7b KO, respectively). **P<0.01 (two-tailed unpaired Student's t-test). (D) Quantification of the lifetime of macropinosomes in WT and Rab7b KO cells. Data represents the mean±s.d. of three independent experiments (>100 tracked macropinosomes per condition, n=23 and 28 cells for WT and Rab7b KO, respectively). ***P<0.001 (two-tailed unpaired Student's t-test). (E) Spinning disk images of live WT and Rab7b KO LPS-DCs stained with Alexa Fluor 594-conjugated WGA to label lysosomes (cyan) and loaded in 5×8 µm micro-fabricated channels filled with 10 kDa Alexa Fluor 647-conjugated dextran (magenta). Representative images from one out of three independent experiments are shown. Scale bar: 10 µm. The magnified area shows a lysosome (arrow) moving towards a macropinosome in a control cell. Image contrast has been increased to improve visualization. (F) Quantification of the number of lysosomes with area <0.5 µm2 per cell. Data represents the mean±s.d. of three independent experiments (n=29 cells for WT and Rab7b-KO). *P<0.05 (two-tailed unpaired Student's t-test). (G) BMDCs from WT and Rab7b KO mice were pulsed with 100 ng/ml LPS for 30 min and lysed after 6 h. Cytosolic and nuclear fractions were subjected to immunoblotting analysis with the indicated antibodies. Histone 3 was used as control of the cytosolic and nuclear fraction separation. (H) The graph shows the quantification of the nucleus-to-cytosol ratio for TFEB in Rab7b-KO DCs relative to WT. Data represents the mean±s.d. of four independent experiments. **P<0.01 (two-tailed unpaired Student's t-test).
Fig. 6.
Fig. 6.
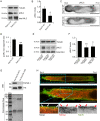
Rab7b regulates myosin II activation and interacts with the lysosomal Ca2+ channel TRPML1. (A) Lysates from BMDCs from WT and Rab7b KO mice pulsed with 100 ng/ml LPS for 30 min were subjected to immunoblotting analysis with the indicated antibodies. Tubulin was used as loading control. (B) The graph shows the quantification of phosphorylated myosin light chain (pMLC) levels in WT and Rab7b KO DCs normalized to the tubulin levels. Data represents the mean±s.d. of four independent experiments. *P<0.05 (two-tailed unpaired Student's t-test). (C) LPS-DCs were loaded in 5×8 µm micro-fabricated channels, fixed after 16 h and stained with and antibody against phosphorylated myosin light chain (pMLC). Representative images from one out of three independent experiments are shown. Images are inverted to improve visualization. Scale bars: 10 µm. (D) Quantification of the pMLC rear edge-to-cell ratio. Data represents the mean±s.d. of three independent experiments (n=72 and 84 cells for WT and Rab7b-KO, respectively). **P<0.01 (two-tailed unpaired Student's t-test). (E) BMDCs from WT and Rab7b KO mice pulsed with 100 ng/ml LPS for 30 min were treated with either DMSO or ML-SA1 20 µM overnight and then lysed. Lysates were subjected to immunoblotting analysis with the indicated antibodies. Tubulin was used as loading control. (F) The graph shows the quantification of pMLC levels in WT and Rab7b KO DCs normalized to the tubulin levels. Data represents the mean±s.d. of five independent experiments. *P<0.05; **P<0.01 (two-tailed unpaired Student's t-test). (G) Lower panel, Coomassie Blue staining of bacterially expressed His–Rab7b Q67L (constitutively active mutant) and His–Rab33b Q92L (constitutively active mutant) purified using Ni-NTA agarose matrix. Upper panel: bacterially expressed and purified His–Rab7b Q67L and His–Rab33b Q92L were incubated with lysates from LPS-treated MDDCs. Proteins were pulled down using cobalt-coated magnetic beads and subjected to western blot (WB) analysis using antibodies against His and TRPML1. (H) LPS-MDDCs were loaded in 5×8 µm micro-fabricated channels, fixed after 16 h and stained with antibodies against TRPML1 (red) and Rab7b (green). The red and white arrows indicate colocalization between TRPML1 and Rab7b. Scale bars: 10 µm. The magnified images were acquired using super-resolution mode.
Fig. 7.
Fig. 7.
Model to illustrate the role of Rab7b in DCs. Upon microbial sensing, DCs increase their migration ability and decrease their capacity of antigen uptake by macropinocytosis. Upregulation of Rab7b promotes this switch by recruiting myosin II from macropinosomes to late endocytic compartments, bringing the motor in close proximity to TRPML1, which activates myosin II at the cell rear and promotes fast DC motility. In the absence of Rab7b, myosin II is retained on macropinosomes at the front of the cells, promoting formation of large macropinosomes and slowing down migration.

References

    1. Alvarez, D., Vollmann, E. H. and von Andrian, U. H. (2008). Mechanisms and consequences of dendritic cell migration. Immunity 29, 325-342. 10.1016/j.immuni.2008.08.006 - DOI - PMC - PubMed
    1. Banchereau, J., Briere, F., Caux, C., Davoust, J., Lebecque, S., Liu, Y.-J., Pulendran, B. and Palucka, K. (2000). Immunobiology of dendritic cells. Annu. Rev. Immunol. 18, 767-811. 10.1146/annurev.immunol.18.1.767 - DOI - PubMed
    1. Berg-Larsen, A., Landsverk, O. J. B., Progida, C., Gregers, T. F. and Bakke, O. (2013). Differential regulation of Rab GTPase expression in monocyte-derived dendritic cells upon lipopolysaccharide activation: a correlation to maturation-dependent functional properties. PLoS ONE 8, e73538. 10.1371/journal.pone.0073538 - DOI - PMC - PubMed
    1. Borg, M., Bakke, O. and Progida, C. (2014). A novel interaction between Rab7b and actomyosin reveals a dual role in intracellular transport and cell migration. J. Cell Sci. 127, 4927-4939. 10.1242/jcs.155861 - DOI - PMC - PubMed
    1. Borg Distefano, M., Hofstad Haugen, L., Wang, Y., Perdreau-Dahl, H., Kjos, I., Jia, D., Morth, J. P., Neefjes, J., Bakke, O. and Progida, C. (2018). TBC1D5 controls the GTPase cycle of Rab7b. J. Cell Sci. 131, jcs216630. 10.1242/jcs.216630 - DOI - PubMed

Publication types