. 2022 Jan;38(1):16-28.
doi: 10.1007/s12264-021-00762-0. Epub 2021 Sep 7.

Association of Increased Amygdala Activity with Stress-Induced Anxiety but not Social Avoidance Behavior in Mice

Affiliations

Association of Increased Amygdala Activity with Stress-Induced Anxiety but not Social Avoidance Behavior in Mice

Shou-He Huang et al. Neurosci Bull. 2022 Jan.

Abstract

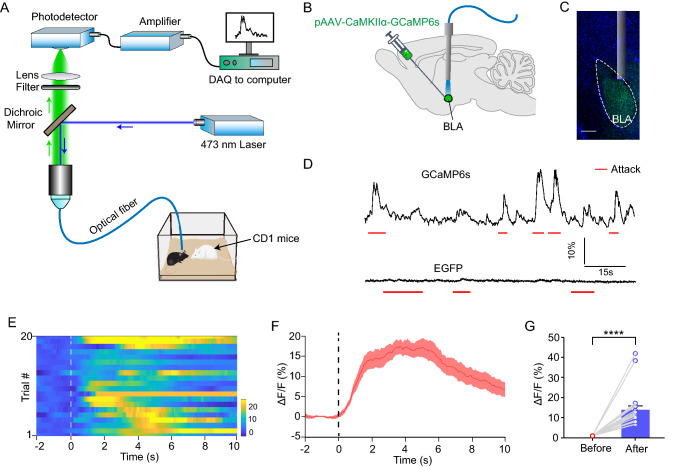
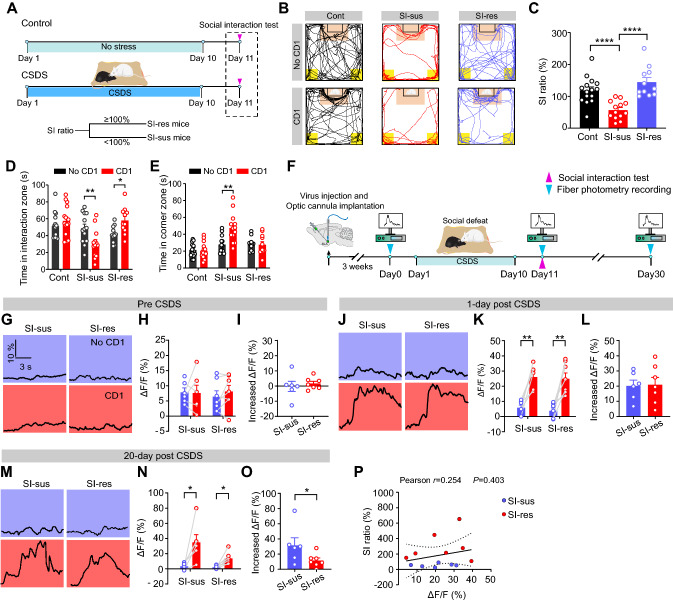
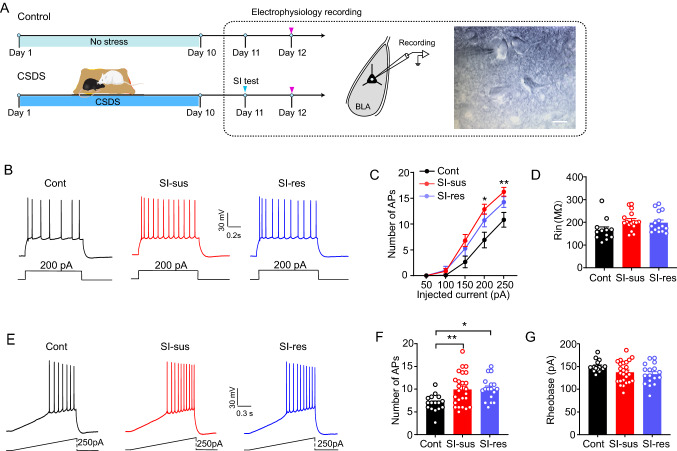
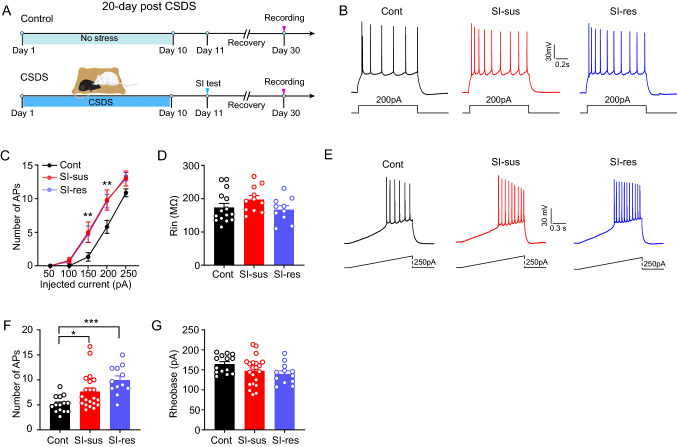
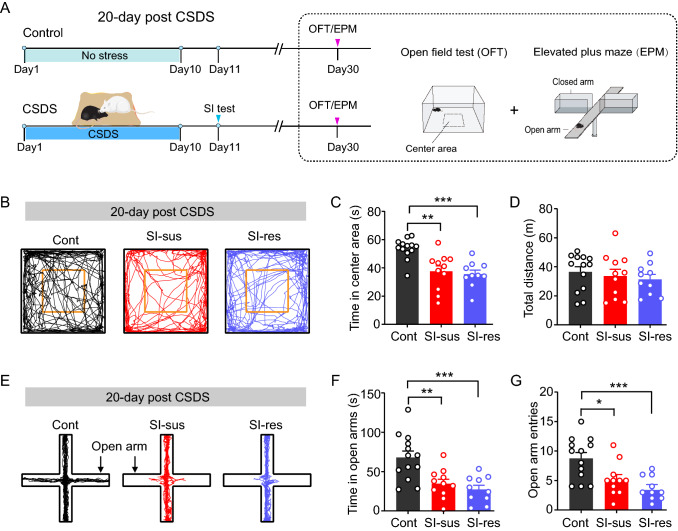
Chronic stress leads to many psychiatric disorders, including social and anxiety disorders that are associated with over-activation of neurons in the basolateral amygdala (BLA). However, not all individuals develop psychiatric diseases, many showing considerable resilience against stress exposure. Whether BLA neuronal activity is involved in regulating an individual's vulnerability to stress remains elusive. In this study, using a mouse model of chronic social defeat stress (CSDS), we divided the mice into susceptible and resilient subgroups based on their social interaction behavior. Using in vivo fiber photometry and in vitro patch-clamp recording, we showed that CSDS persistently (after 20 days of recovery from stress) increased BLA neuronal activity in all the mice regardless of their susceptible or resilient nature, although impaired social interaction behavior was only observed in susceptible mice. Increased anxiety-like behavior, on the other hand, was evident in both groups. Notably, the CSDS-induced increase of BLA neuronal activity correlated well with the heightened anxiety-like but not the social avoidance behavior in mice. These findings provide new insight to our understanding of the role of neuronal activity in the amygdala in mediating stress-related psychiatric disorders.

Keywords: Amygdala; Anxiety; Chronic stress; Fiber photometry; Neuronal activity; Stress vulnerability.


Conflict of interest statement

The authors declare that no competing interests.

Figures

Fig. 1
Fig. 1
Acute defeat stress increases calcium signals in BLA projection neurons. A Schematic of the in vivo fiber photometry setup. B Diagram showing the injection of GCaMP6s-carrying adeno-associated virus (AAV) vectors into the BLA to record Ca2+ signals. C Representative image showing a cannula implanted onto the BLA (green, GCaMP6s expression in BLA neurons; blue, DAPI counterstaining of cell nuclei; scale bar, 200 μm). D Raw traces of fluorescence changes showing that social attack by a CD1 aggressor rapidly increases the Ca2+ signal in a GCaMP6s-expressing neuron (upper) but not in an EGFP-expressing neuron (lower) (red lines indicate social attacks). E Trial-by-trial heatmap representation of Ca2+ signals in the BLA neurons from a GCaMP6s-expressing mouse. Each row represents a trial (20 trials from 8 mice). F Peri-event plot of the averaged Ca2+ signals from the 8 mice as in (E). Thick line indicates the mean, and shaded area indicates the SEM. G Summary plots of the ΔF/F signal before (2 s) and after attack (5 s) bouts in GCaMP6s-expressing BLA neurons (n = 20; P <0.0001, paired t-test; before attack: average ΔF/F = 0% ± 0%; after attack: average ΔF/F = 13.95% ± 2.06%); ****P <0.0001).
Fig. 2
Fig. 2
Chronic social defeat stress persistently activates BLA projection neurons. A Experimental procedures for controls and mice subjected to chronic social defeat stress (CSDS). B Representative activity tracking during the social interaction (SI) test for control, SI-sus, and SI-res mice in the absence or presence of a CD1 target. C Summary plots of the SI ratio of control (Cont), susceptible (SI-sus), and resilient (SI-res) mice (Cont, n = 15 mice; SI-sus, n = 13 mice; SI-res, n = 11 mice; one-way ANOVA, F(2, 36)=15.97, P <0.0001; Bonferroni post hoc comparison, Cont versus SI-sus, P = 0.0006; Cont vs SI-res, P = 0.24; SI-sus vs SI-res, P<0.0001). D, E Summary plots of time in interaction zone (D) and time in corner zone (E) of the three groups in the absence or presence of a CD1 target. Same sample sizes as in C. Time in interaction zone: two-way ANOVA, main effect of stress vulnerability: F(2, 36) = 4.56, P = 0.017; main effect of CD1 present: F(1, 36) = 0.29, P = 0.59; interaction: F(2, 36) = 11.86, P = 0.0001. Bonferroni post hoc comparison, SI-sus, P = 0.003; SI-res, P = 0.014. Time in corner zone: two-way ANOVA, main effect of stress vulnerability: F(2,36) = 13.78, P <0.0001; main effect of CD1 present: F(1,36) = 6.44, P = 0.0157; interaction: F(2,36) = 8.78, P = 0.0008. Bonferroni post hoc comparison, SI-sus, P <0.0001. F Experimental procedures for recording dynamic Ca2+ signals in BLA projection neurons by in vivo fiber photometry. G Representative traces of Ca2+ signals aligned with first proximal interaction before CSDS in the absence (upper) or presence (lower) of a CD1 target. H Summary plots of ΔF/F signal during proximal interaction before CSDS. The susceptible and resilient mice were defined after CSDS. SI-sus, n = 6 mice; SI-res, n = 7 mice. ΔF/F: two-way ANOVA, main effect of CD1 present: F(1, 11) = 0.18, P = 0.679; main effect of stress vulnerability: F(1, 11) = 0.036, P = 0.85; interaction: F(1, 11) = 0.297, P = 0.597. I Percentage change inΔF/F signal in H. t test, P = 0.6). J Representative traces of Ca2+ signal 1-day after CSDS. K Summary plots as in J. Same sample sizes as in H. ΔF/F: two-way ANOVA, main effect of CD1 present: F(1, 11) = 43.29, P <0.0001; main effect of stress vulnerability: F(1, 11) = 0.367, P = 0.557; interaction: F(1, 11) = 0.017, P = 0.9. L Percentage change inΔF/F in J. t test, P = 0.9. M Representative traces of Ca2+ signal 20 days after CSDS. N Summary plots as in M. Same sample sizes as in H. ΔF/F: Wilcoxon signed-rank test. SI-sus, P = 0.028; SI-res, P = 0.018. O Percentage change in ΔF/F as in L. Mann-Whitney test, P = 0.035. P Correlation between the SI ratio andΔF/F in stressed mice. Pearson r = 0.254, P = 0.403. All data are presented as the mean ± SEM. *P <0.05, **P <0.01, ****P <0.0001.
Fig. 3
Fig. 3
CSDS increases the intrinsic excitability of BLA projection neurons. A Experimental procedures for electrophysiological recordings in controls and mice subjected to chronic social defeat stress (CSDS) (scale bar, 15 μm). B Representative traces of action potential (AP) firing in response to injection of current from control (Cont), susceptible (SI-sus), and resilient (SI-res) mice (scale bars, 0.2 s, 30 mV). C Summary plots of AP numbers as a function of injected current strength, as in (B). Cont, n = 12 neurons/3 mice; SI-sus, n = 16 neurons/5 mice; SI-res, n = 15 neurons/4 mice. two-way ANOVA, main effect of depolarization steps: F(4, 160) = 252.3, P <0.0001; main effect of CSDS: F(2, 40) = 4.463, P = 0.0178; main effect of interaction: F(8, 160) = 4.223, P = 0.0001. Bonferroni post hoc comparison, current strength = 200 pA, Cont vs SI-sus, P <0.0001, Cont vs SI-res, P = 0.021; current strength = 250 pA, Cont vs SI-sus, P = 0.0004, Cont vs SI-res, P = 0.046. D Summary plots of input resistance (Rin). One-way ANOVA, F(2,40) = 2.953, P = 0.0636. E As in (B), except that ramped depolarizing current is injected into BLA projection neurons. F Summary plots of AP numbers, as in (E). Cont, n = 16 neurons/4 mice; SI-sus, n = 25 neurons/6 mice; SI-res, n = 17 neurons/5 mice. One-way ANOVA, F(2,55) = 6.318, P = 0.0034. Bonferroni post hoc comparison, Cont vs SI-sus, P = 0.0065; Cont vs SI-res, P = 0.0104. G Summary plots of rheobase of APs, as in (E). One-way ANOVA, F(2,55) = 3.032, P = 0.0564. All data are presented as the mean ± SEM. *P <0.05, **P <0.01.
Fig. 4
Fig. 4
The augmented excitability of BLA projection neurons persists 20 days after CSDS. A Experimental procedures for electrophysiological recordings. B Representative traces of action potential (AP) firing in response to injection of current from control (Cont), susceptible (SI-sus), and resilient (SI-res) mice. C Summary plots of AP numbers as a function of injected current, as in (B). Cont, n = 15 neurons/5 mice; SI-sus, n = 11 neurons/3 mice; SI-res, n = 10 neurons/3 mice. Two-way ANOVA, main effect of depolarizing steps: F(4, 132) = 261.4, P <0.0001; main effect of CSDS: F(2, 33) = 4.361, P = 0.0209; main effect of interaction: F(8, 132) = 3.406, P = 0.0014. Bonferroni post hoc comparison, current strength = 150 pA, Cont vs SI-sus, P = 0.004, Cont vs SI-res, P = 0.006; current strength = 200 pA, Cont vs SI-sus, P = 0.001, Cont vs SI-res, P = 0.002. D Summary plots of Rin. One-way ANOVA, F(2,33) = 1.621, P = 0.213. E As in (B), except that ramped depolarizing current is injected into BLA projection neurons. F Summary plots of AP numbers, as in (E). Cont, n = 14 neurons/5 mice; SI-sus, n = 21 neurons/6 mice; SI-res, n = 12 neurons/3 mice. One-way ANOVA, F(2,44) = 9.276, P = 0.0004. Bonferroni post hoc comparison, Cont vs SI-sus, P = 0.0422; Cont vs SI-res, P = 0.0003. G Summary plots of rheobase of APs, as in (E). One-way ANOVA, F(2,44) = 2.367, P = 0.0106. Bonferroni post hoc comparison, Cont vs SI-sus, P = 0.3129; Cont vs SI-res, P = 0.133. All data are presented as the mean ± SEM. *P <0.05, **P <0.01, ***P <0.001.
Fig. 5
Fig. 5
CSDS increases anxiety-like behavior in SI-sus and SI-res mice. A Experimental procedures for anxiety-like behavioral tests. B Representative activity tracking in the OFT for control (Cont), susceptible (SI-sus), and resilient (SI-res) mice. C Summary plots of time in center area in the OFT. Cont, n = 13 mice; SI-sus, n = 11 mice; SI-res, n = 10 mice. One-way ANOVA, F(2,31) = 8.985, P = 0.0008. Bonferroni post hoc comparison, Cont vs SI-sus, P = 0.0022; Cont vs SI-res, P = 0.0044. D Summary plots of total distance travelled in the OFT. One-way ANOVA, F(2,31) = 0.079, P = 0.924. E Representative activity tracking in the EPM. F Summary plots of time in open arms. Same sample sizes as in C. One-way ANOVA, F(2,31) = 13.74, P <0.0001. Bonferroni post hoc comparison, Cont vs SI-sus, P = 0.0004; Cont vs SI-res, P = 0.0002. G Summary plots of open arms entries. Same sample sizes as in C. One-way ANOVA, F(2,31) = 8.262, P = 0.0013. Bonferroni post hoc comparison, Cont vs SI-sus, P = 0.0089; Cont vs SI-res, P = 0.0025. All data are presented as the mean ± SEM. **P <0.01, ***P <0.001.
Fig. 6
Fig. 6
CSDS persistently increases anxiety-like behavior in SI-sus and SI-res mice 20 days after CSDS. A Experimental procedures for anxiety-like behavioral tests 20-day after CSDS. B Representative activity tracking in the OFT for control (Cont), susceptible (SI-sus), and resilient (SI-res) mice. C Summary plots of time in center area in the OFT. Cont, n = 13 mice; SI-sus, n = 11 mice; SI-res, n = 10 mice. One-way ANOVA, F(2,31) = 15.85, P <0.0001. Bonferroni post hoc comparison, Cont vs SI-sus, P <0.0001; Cont vs SI-res, P = 0.0002. D Summary plots of total distance travelled in the OFT. One-way ANOVA, F(2,31) = 0.443, P = 0.646. E Representative activity tracking in the EPM for the three groups. F Summary plots of time in open arms in the EPM. Same sample size as in C. One-way ANOVA, F(2,31) = 12.81, P <0.0001. Bonferroni post hoc comparison, Cont vs SI-sus, P = 0.0007; Cont vs SI-res, P = 0.0003. G Summary plots of open arm entries in the EPM. One-way ANOVA, F(2,31) = 9.292, P = 0.0007. Bonferroni post hoc comparison, Cont vs SI-sus, P = 0.0146; Cont vs SI-res, P = 0.0008. All data are presented as the mean ± SEM. * P <0.05, ** P <0.01, *** P <0.001.
Fig. 7
Fig. 7
Correlations between CSDS-induced increase of BLA neuronal activity and anxiety-like behavior and social avoidance behavior. A, B Correlations between the AP numbers induced by step current injection and time in center region in the OFT (A) and time in open arms in the EPM (B) (AP number in response to injection current of 250 pA). C, D Correlations between the AP numbers induced by ramp current injection and time in center region in the OFT (C) and time in open arms in the EPM (D). E, F Correlations between SI ratio and the AP numbers induced by step (E) and ramp (F) depolarizing current injection. G, H Correlations between SI ratio and time in center region in the OFT (G) and time in open arms in the EPM (H). n = 16 mice. Note that two data sets are overlapped in B.

References

    1. de Kloet ER, Joëls M, Holsboer F. Stress and the brain: From adaptation to disease. Nat Rev Neurosci. 2005;6:463–475. - PubMed
    1. Craske MG, Stein MB, Eley TC, Milad MR, Holmes A, Rapee RM, et al. Anxiety disorders. Nat Rev Dis Primers. 2017;3:1–19. - PMC - PubMed
    1. Twining RC, Vantrease JE, Love S, Padival M, Rosenkranz JA. An intra-amygdala circuit specifically regulates social fear learning. Nat Neurosci. 2017;20:459–469. - PMC - PubMed
    1. Yin YN, Hu J, Wei YL, Li ZL, Luo ZC, Wang RQ, et al. Astrocyte-derived lactate modulates the passive coping response to behavioral challenge in male mice. Neurosci Bull. 2021;37:1–14. - PMC - PubMed
    1. Krishnan V, Han MH, Graham DL, Berton O, Renthal W, Russo SJ, et al. Molecular adaptations underlying susceptibility and resistance to social defeat in brain reward regions. Cell. 2007;131:391–404. - PubMed