. 2021 Sep 8:10:e70514.
doi: 10.7554/eLife.70514.

Activity-dependent modulation of synapse-regulating genes in astrocytes

Affiliations

Activity-dependent modulation of synapse-regulating genes in astrocytes

Isabella Farhy-Tselnicker et al. Elife. .

Abstract

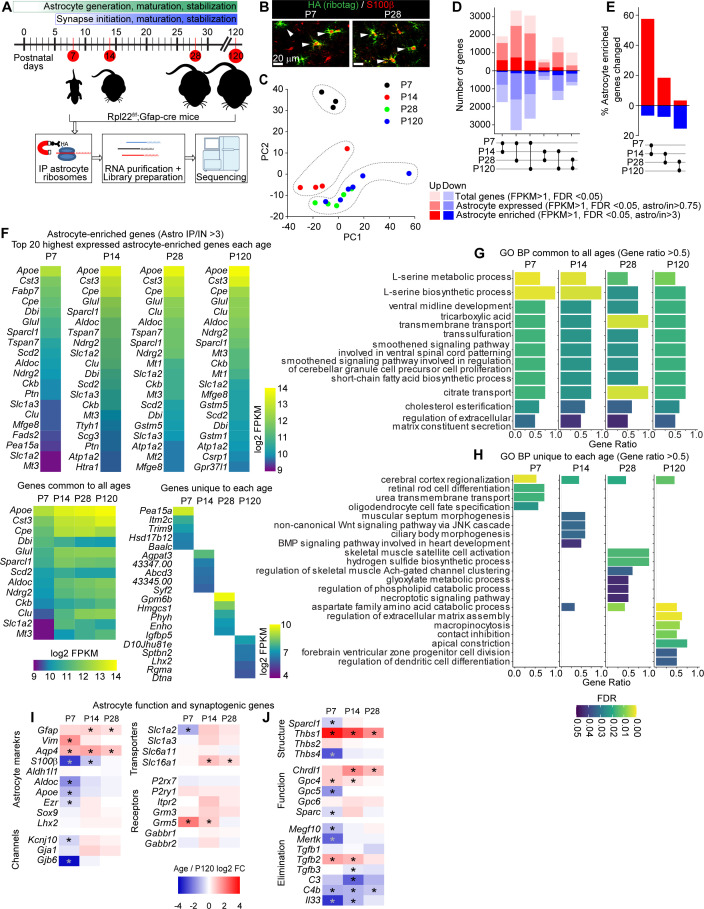
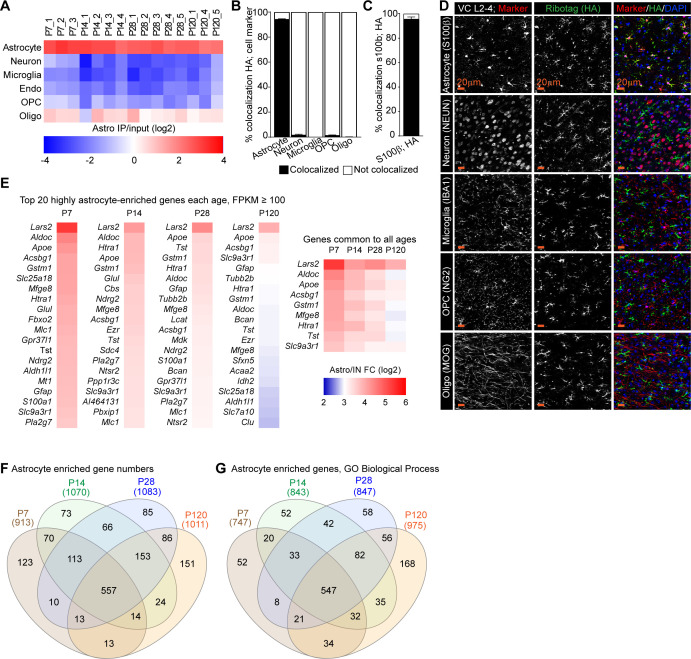
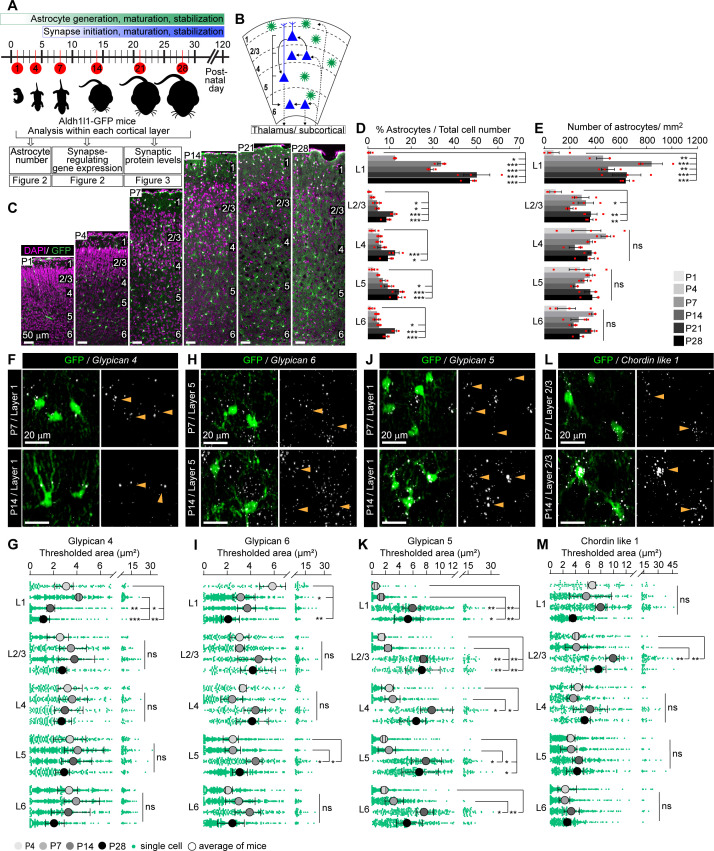
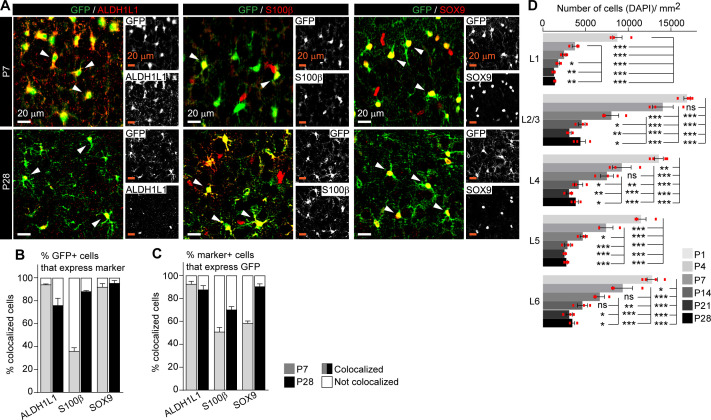
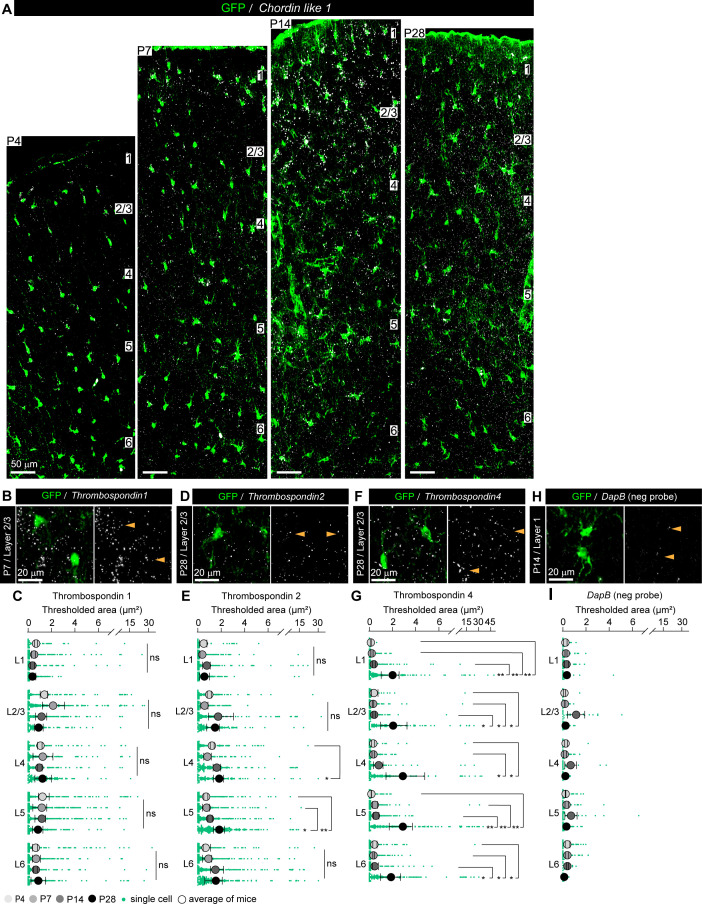
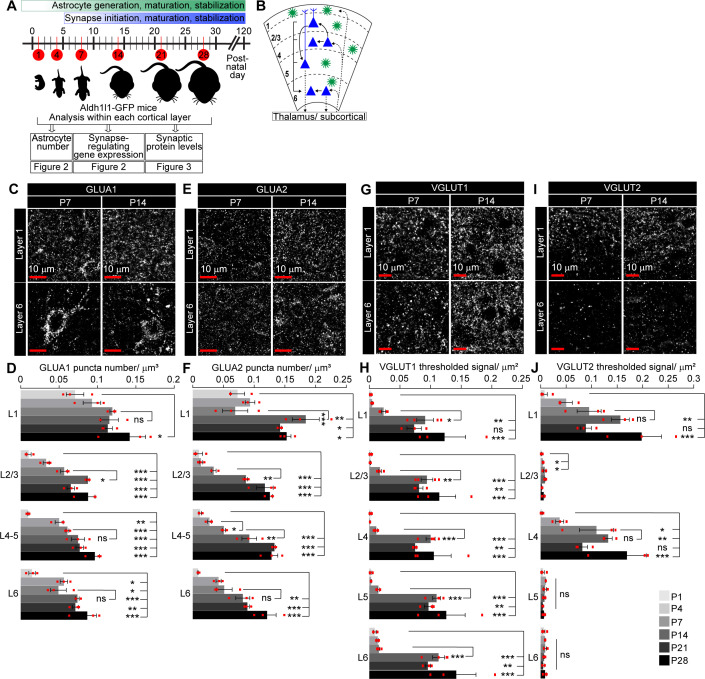
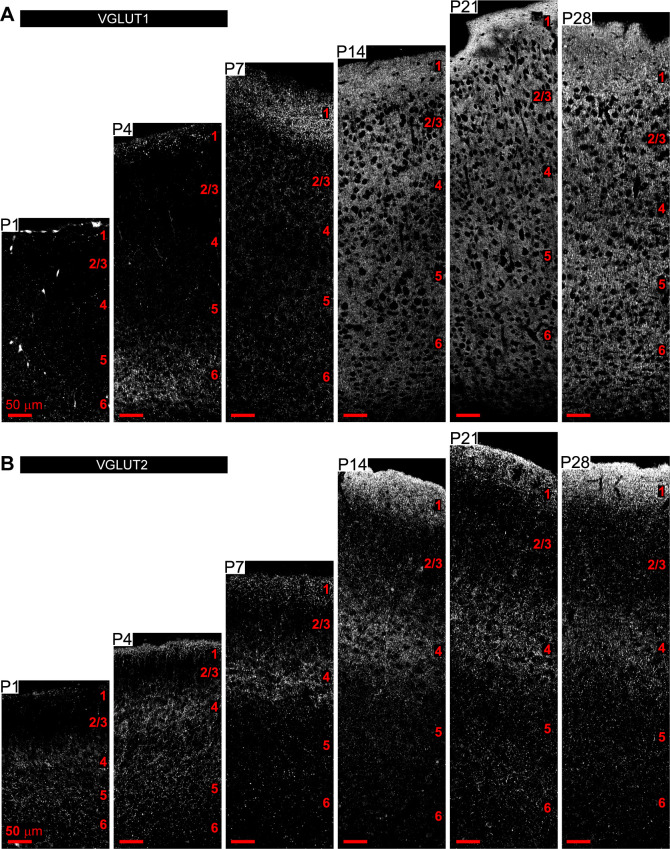
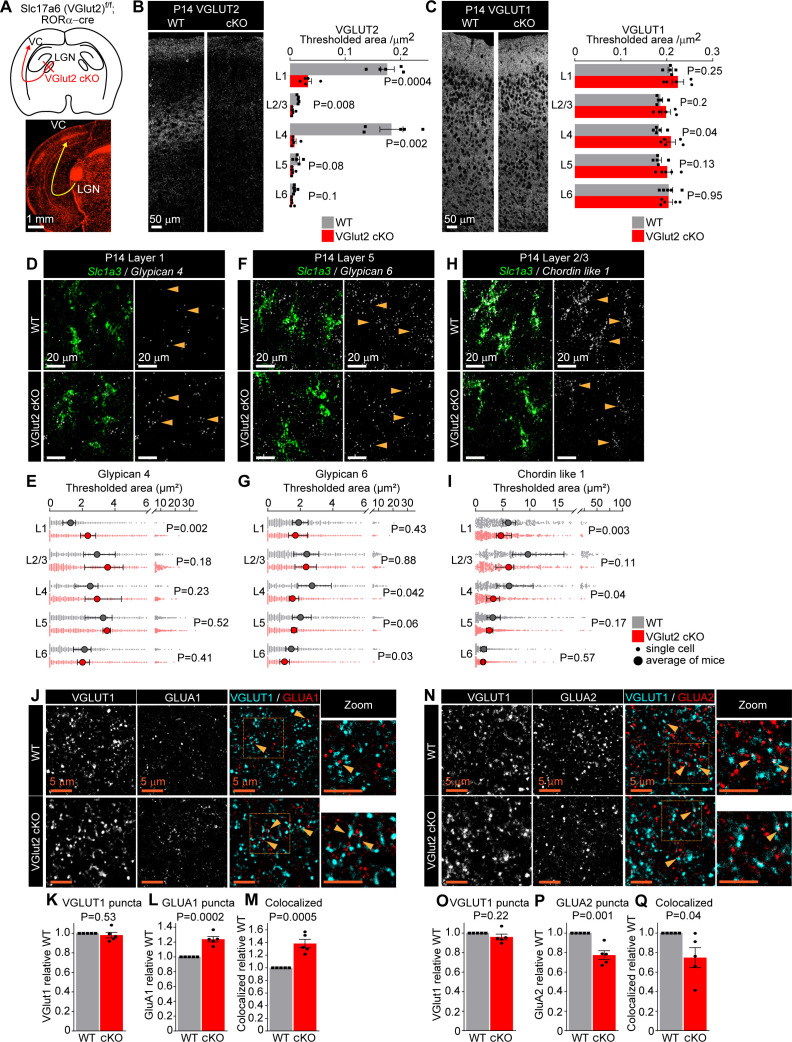
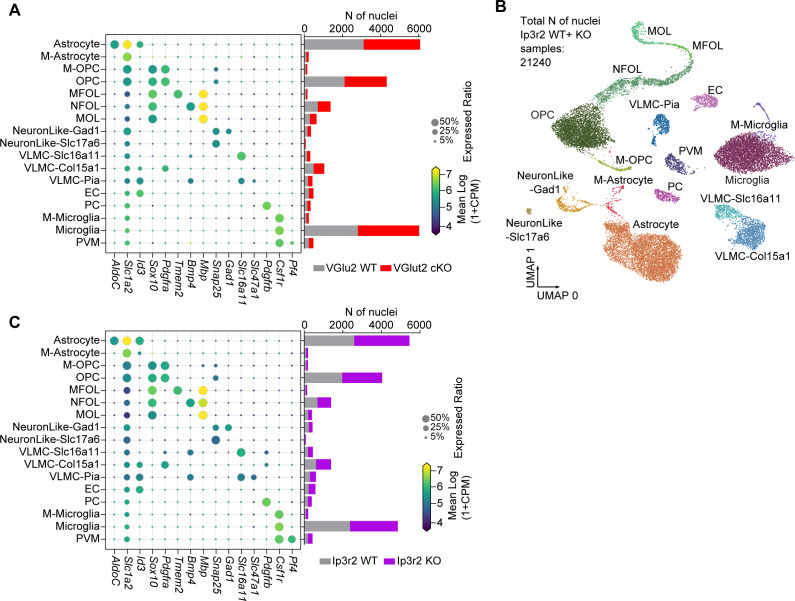
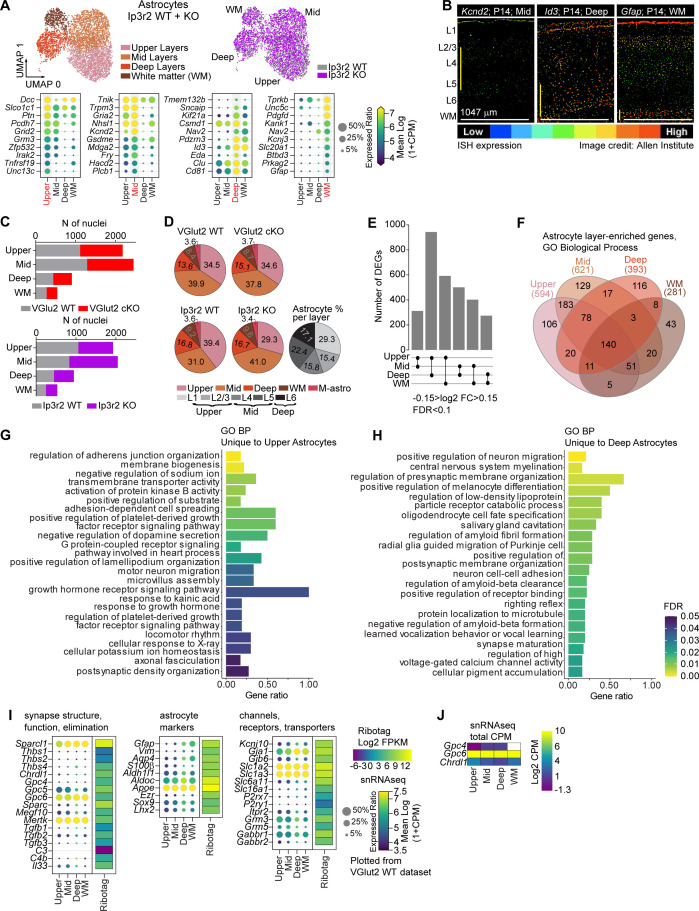
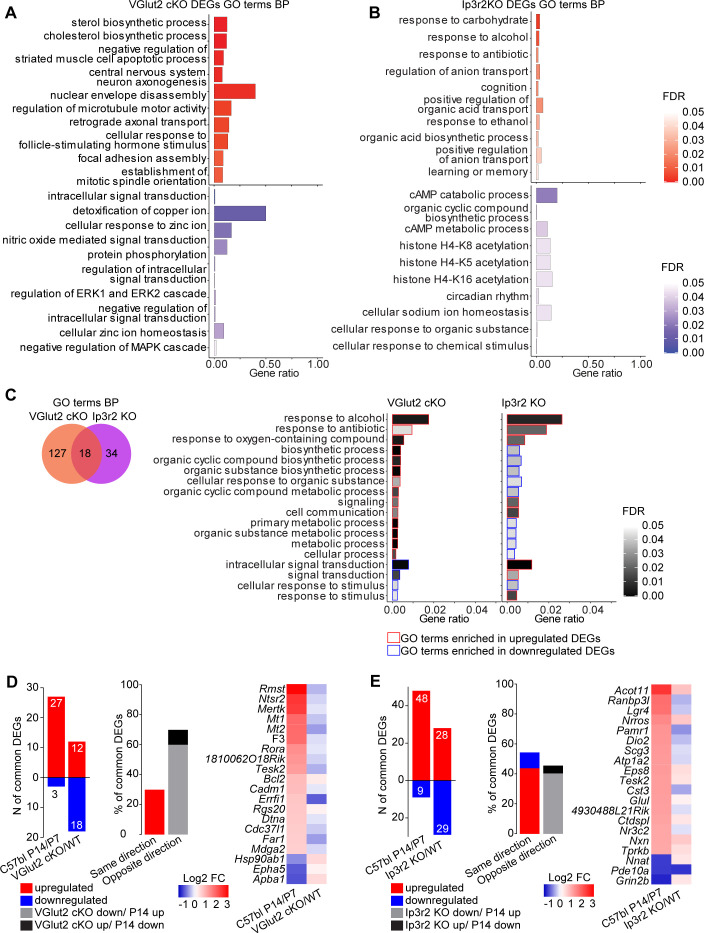
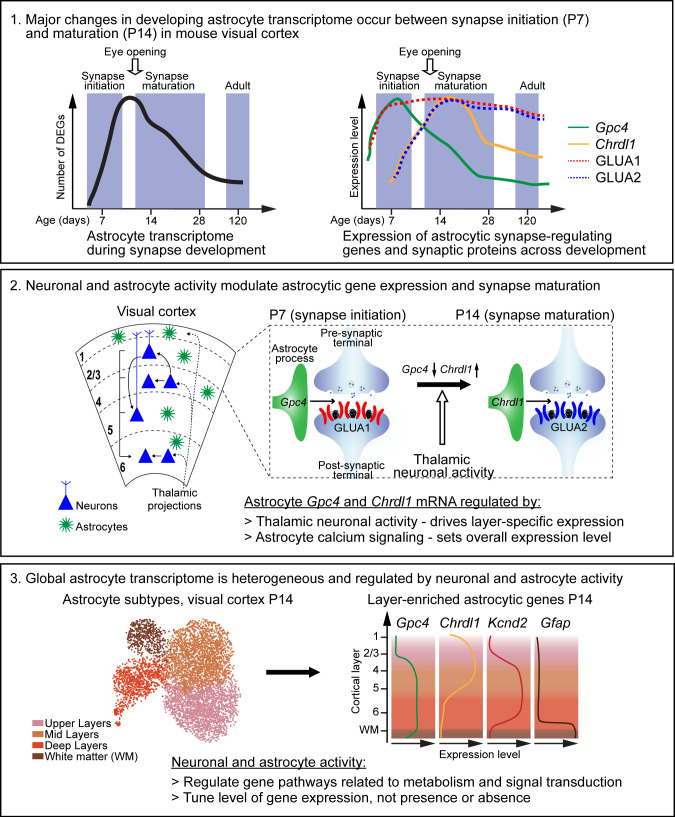
Astrocytes regulate the formation and function of neuronal synapses via multiple signals; however, what controls regional and temporal expression of these signals during development is unknown. We determined the expression profile of astrocyte synapse-regulating genes in the developing mouse visual cortex, identifying astrocyte signals that show differential temporal and layer-enriched expression. These patterns are not intrinsic to astrocytes, but regulated by visually evoked neuronal activity, as they are absent in mice lacking glutamate release from thalamocortical terminals. Consequently, synapses remain immature. Expression of synapse-regulating genes and synaptic development is also altered when astrocyte signaling is blunted by diminishing calcium release from astrocyte stores. Single-nucleus RNA sequencing identified groups of astrocytic genes regulated by neuronal and astrocyte activity, and a cassette of genes that show layer-specific enrichment. Thus, the development of cortical circuits requires coordinated signaling between astrocytes and neurons, highlighting astrocytes as a target to manipulate in neurodevelopmental disorders.

Keywords: astrocytes; developmental biology; gene expression; mouse; neuronal activity; neuroscience; synaptic terminals; visual development.


Conflict of interest statement

IF, MB, HL, CD, GE, EB, CF, MS, JE, NA No competing interests declared

Figures

Figure 1.
Figure 1.. Developmental profiling of the astrocyte transcriptome in the postnatal visual cortex (VC).
See also Figure 1—figure supplement 1, Figure 1—source data 1. (A) Outline of experiment: VCs from Rpl22-HAf/+; Gfap-cre 73.12 mice were collected at different time points corresponding to synapse development and maturation, and subjected to Ribotag pulldown protocol, followed by RNA purification, library preparation and sequencing. (B) Example images of VC at postnatal day (P)7 and P28 as labeled, showing colocalization between Ribotag (green, HA) and astrocyte marker S100β (red). Scale bars = 20 μm. (C) Principal component analysis of RNAseq data shows P7 and P14 samples clustering separately from other ages, while P28 and P120 samples cluster together, suggesting similar gene expression profiles (N = 3 at P7, 4 at P14, 5 at P28, 3 at P120; for statistical comparisons, 3xP120 samples published in Boisvert et al., 2018 were added to increase the power of the analysis, giving an N = 6 P120). (D) Pairwise comparison of differentially expressed genes (DEGs; red: upregulated; blue: downregulated) between each time point showing total genes (light hue, all DEGs identified with FPKM >1), astrocyte expressed genes (darker hue, expression level in pulldown sample/input >0.75), and astrocyte-enriched genes (dark hue, expression level in pulldown sample; astro/input >3). (E) Percent of all astrocyte-enriched genes that are differentially expressed between each age. Percent DEGs is highest between P7 and P14. (F) Heatmaps of top 20 astrocyte-enriched genes at each age, sorted by expression level, along with 13 genes common to all time points (left), and top 5 most enriched genes at each age (right). Colors represent log2 FPKM of expression level. (G, H) Gene Ontology (GO) terms analysis with String db of Biological Process (BP) in astrocyte-enriched genes at each time point. (G) Plot of GO terms common to all time points with a gene ratio >0.5. (H) Plot of GO terms unique to each age with a gene ratio >0.5. Bar length is gene ratio, fill color is false discovery rate (FDR). See also Figure 1—source data 1B. (I, J) Heatmaps of select genes related to astrocyte function (I) and synaptic regulation (J) plotted as log2 fold change (FC) at each age relative to P120. * Adjusted p value (FDR) < 0.05 by DESeq2 with Benjamini–Hochberg’s correction when comparing P120 to each age.
Figure 1—figure supplement 1.
Figure 1—figure supplement 1.. Developmental profiling of the astrocyte transcriptome in the postnatal visual cortex (VC).
(A) Analysis of cell-specific genes in HA-pulldown/input samples (log2) from RNA sequencing demonstrates enrichment for astrocyte genes and depletion of other cells in all samples (N = 3 at postnatal day [P]7, 4 at P14, 5 at P28, 3 at P120; for statistical comparisons, 3xP120 samples published in Boisvert et al., 2018 were added to increase the power of the analysis). (B–D) Immunostaining for the HA tag and cell-specific markers to determine cell-type expression of tagged ribosomes in P28 visual cortex. (D) Representative images, left panels: cell marker; middle panels: HA; right panels: merge with DAPI to mark nuclei. (B, C) Quantification of (D). (B) Quantification of colocalization of HA with each cell-specific marker, expressed as % of marker + cells, demonstrates that majority of HA+ cells are astrocytes. (C) Quantification of number of astrocytes (s100β+) that are also HA+ demonstrates that majority of astrocytes express HA-tagged ribosomes. N = 4 mice S100β, NEUN, IBA1; 3 mice MOG; 2 mice NG2. Bar graphs mean ± s.e.m. Scale bars = 20 µm. (E) Heatmaps of top 20 most astrocyte-enriched genes (highest astro/IN ratio; FPKM > 100) at each time point, as well as those in the top 20 at all time points, represented as fold change (FC) of astrocyte/input (log2). (F) Venn diagram showing overlap in astrocyte-enriched genes at each age. (G) Gene Ontology (GO) terms analysis with String db of Biological Process (BP) in astrocyte-enriched genes at each time point. Venn diagram showing overlap in GO terms at each age.
Figure 2.
Figure 2.. Astrocytic synapse-regulating genes show differential spatio-temporal expression patterns.
See also Figure 2—figure supplements 1 and 2, Figure 2—source data 1. (A) Schematic of experiments described in Figures 2–3: visual cortex (VC) sections from Aldh1l1-GFP mice analyzed for astrocyte numbers, gene expression, and synaptic proteins at developmental time points as indicated. (B) Diagram of VC depicting neuronal (blue) laminar arrangement and connectivity (arrows). Astrocytes (green) are present in all layers. (C–E) Astrocyte number increases in the VC across development. (C). Example images of the VC from Aldh1l1-GFP mice at time points analyzed. GFP marks astrocytes (green), DAPI (magenta) labels nuclei. Layers (L) labeled by numbers on the right in each panel. (D) Quantification of (C), astrocytes as a percentage of total cells within each cortical layer. (E) Quantification of (C), number of astrocytes per mm2 of VC within each layer. Scale bar in (C): 50 μm; N = 4 mice for postnatal day (P)1; N = 3 mice for P4–P28. Graphs show mean ± s.e.m., red squares are average of individual mouse. *p≤0.05, **p<0.01, ***p<0.001, ns (not significant) by one-way ANOVA comparing expression between time points within each layer; see also Figure 2—source data 1A. (F–M) Synapse-regulating genes show differential spatio-temporal expression patterns. (F, H, J, L) Example images showing Gpc4, Gpc6, Gpc5, or Chrdl1 mRNA (white) in astrocytes (green) at each age and layer as labeled. Merged panel on the left, single-channel probe panel on the right. (G, I, K, M) Quantification of (F, H, J, L), respectively. (F) Gpc4 expression is reduced at P14 specifically in L1. (H) Gpc6 expression is increased at P14 in L5. (J) Gpc5 expression is increased at P14 in all layers. (L) Chrdl1 expression is increased at P14 in L2/3. Scale bars in (F, H, J, L) = 20 μm. Arrowheads in single-channel panel mark astrocyte cells on the left. N = 3 mice/age for each probe. Data presented as scatter with mean + range. Green dots are mRNA signal measured in individual astrocytes. Large circles colored according to age are average signal. N = 3 mice/age, n = ~50–350 astrocytes/per age total; averages and statistical analysis are calculated based on N = 3, i.e.,data per mouse. *p≤0.05, **p<0.01, ***p<0.001, ns (not significant) by one-way ANOVA comparing expression between time points within each layer. See also Figure 2—source data 1B and C.
Figure 2—figure supplement 1.
Figure 2—figure supplement 1.. Astrocytic synapse-regulating genes show differential spatio-temporal expression patterns.
(A–C) Aldh1l1-GFP signal colocalizes with astrocyte markers during development. (A) Example images of the visual cortex (VC) from Aldh1l1-GFP mice immunostained with antibodies for GFP (green), and astrocyte markers Aldh1l1, S100β, or Sox9 (as indicated, red) at the different time points as indicated. Inset is single-channel image for each antibody. (B, C) Quantification of (A). (B) Quantification of % of GFP+ cells that are also immunopositive for the astrocyte marker, demonstrating the majority of GFP+ cells express astrocyte markers and are astrocytes. (C) Quantification of % of astrocyte marker+ cells that express GFP, demonstrating that not all S100β and SOX9+ cells express GFP at postnatal day (P)7. Data shows mean ± s.e.m. Arrowheads mark representative cells with colocalized GFP and marker. N = 4 mice for P1; N = 3 mice for P4–P28. Scale bars = 20 µm. (D) Quantification of Figure 2C, number of DAPI labeled cells per mm2 of VC within each layer. N = 3 mice/age. Graphs show mean ± s.e.m., red squares are average of individual mouse. *p≤0.05, **p<0.01, ***p<0.001, by one-way ANOVA comparing expression between time points within each layer.
Figure 2—figure supplement 2.
Figure 2—figure supplement 2.. Astrocytic synapse-regulating genes show differential spatio-temporal expression patterns.
(A) Example images of the entire span of the visual cortex (VC) showing Chrdl1 mRNA (white) in astrocytes (green) at each age and layer as labeled. (B, D, F, H) Example images showing Thbs1, Thbs2, Thbs4, and DapB mRNA (white) in astrocytes (green) at each age and layer as labeled. Merged panel on the left, single-channel probe panel on the right. (C, E, G, I) Quantification of (B, D, F, H), respectively. (C) No significant difference in expression of Thbs1 at any age or layer. (E) Thbs2 expression is increased at P28 in L4–5. (G) Thbs4 expression is increased at P28 in all layers. (I) DapB-negative probe expression level showing detection limit for probe mRNA expression analysis. Arrowheads in single-channel panel mark astrocyte cells on the left. Data presented as scatter with mean + range. Green dots are mRNA signal measured in individual astrocyte. Large circles colored according to age are average signal. N = 3 mice/age, n = ~50–350 astrocytes/per age total; n = ~20–80 astrocytes for DapB-neg probe (H, I) (average and statistical analysis are calculated based on N = 3, i.e., data per mouse). Scale bars = 20 μm. *p≤0.05, **p<0.01, ns (not significant) by one-way ANOVA comparing expression between time points within each layer. See also Figure 2—source data 1B, C.
Figure 3.
Figure 3.. Spatio-temporal profiling of synaptic protein expression in the postnatal visual cortex (VC).
See also Figure 3—figure supplement 1, Figure 3—source data 1. (A) Schematic of experiments described in Figures 2–3: VC sections from Aldh1l1-GFP mice analyzed for astrocyte numbers, gene expression, and synaptic proteins at developmental time points as indicated. (B) Diagram of VC depicting neuronal (blue) laminar arrangement and connectivity (arrows). Astrocytes (green) are present in all layers. (C–F) Developmental expression pattern of the postsynaptic AMPARs GLUA1 and GLUA2 subunits within each cortical layer. (C, E) Example images of GLUA1 or GLUA2 protein levels (white puncta). (D, F) Quantification of (C, E) number of GLUA1 or GLUA2 puncta per cortical volume (μm3). GLUA1 expression is increased from postnatal day (P)1 to P28 in all layers. GLUA2 expression is increased from P1 to P28 in all layers, and between P7 and P14 in L1–5. (G–J) Developmental expression pattern of the presynaptic proteins VGLUT1 and VGLUT2 in each cortical layer. (G, I) Example images of VGLUT1 or VGLUT2 protein levels (white puncta). (H, J) Quantification of (G, I) density of VGLUT1 or VGLUT2 signal as total area of thresholded signal per μm2. VGLUT1 expression increases in all layers between P7 and P14. VGLUT2 expression increases steadily from P1 to P28 in L1 and L4. Scale bars = 10 μm. N = 3 mice/age. Graphs show mean ± s.e.m., red squares average of individual mouse. *p≤0.05, **p<0.01, ***p<0.001, ns (not significant) p>0.05 by one-way ANOVA comparing expression between time points within each layer.
Figure 3—figure supplement 1.
Figure 3—figure supplement 1.. Spatio-temporal profiling of synaptic protein expression in the postnatal visual cortex (VC).
(A, B) Example images of the entire span of the VC from Aldh1l1-GFP mice immunostained with antibody for VGLUT1 (A) or VGLUT2 (B) as indicated (white puncta) at time points analyzed. Scale bars = 50 µm. Layers indicated by numbers on the right of each panel in red.
Figure 4.
Figure 4.. Thalamic glutamate release tunes astrocyte expression of synapse-regulating genes.
See also Figure 4—figure supplements 1 and 2, Figure 4—source data 1. (A) Schematic of the experiment: VGLUT2 is removed from presynaptic terminals of neurons in the lateral geniculate nucleus of the thalamus (LGN) that project to the visual cortex (VC) by crossing Slc17a6 f/f mouse (WT) with RORαcre mouse line (VGlut2 cKO). Bottom: image of tdTomato reporter expression in the LGN and the VC, when RORαcre mouse is crossed with cre-dependent tdTomato reporter mouse (Ai14). (B) VGLUT2 level in the VC is significantly reduced in VGlut2 cKO mice. Example images of VGLUT2 immunostaining in each genotype and quantification of the thresholded signal within each cortical layer. (C) VGLUT1 level is unaltered in VGlut2 cKO mice. Example images of VGLUT1 immunostaining and quantification. In (B, C), plots show mean signal ± s.e.m. Squares and circles above each bar are the average of signal in each mouse. N = 5 mice/genotype. Scale bar = 50 μm. Statistical analysis by t-test within each layer. p-Value on each plot. (D–I) mRNA expression of astrocyte synapse-regulating genes is altered in VGlut2 cKO at postnatal day (P)14. (D, F, H) Example images of in situ hybridization of Gpc4, Gpc6, and Chrdl1 mRNA (white) as labeled; astrocyte marker Slc1a3 (Glast, green). Merged panel on the left, single-channel probe panel on the right. (E, G, I) Quantification of (D, F, H), respectively. (E) Gpc4 mRNA expression is increased in L1; (G) Gpc6 mRNA expression is decreased in L4–6. (I) Chrdl1 mRNA expression is decreased in L1–4 in VGlut2 cKO mice. Data presented as scatter with mean + range. Gray or red dots are mRNA signals measured in individual astrocyte in WT and VGlut2 cKO, respectively. Large circles are the average signal. N = 5 mice/genotype, n = ~200–450 astrocytes/per age total (average and statistical analysis are calculated based on N = 5, i.e., per mouse). Arrowheads in single-channel panel mark astrocytes. Scale bar = 20 µm. See also Figure 4—source data 1. Statistical analysis by t-test within each layer. p-Value on each plot. (J–M) Increase in GLUA1 protein levels and colocalization between GLUA1 and VGLUT1 in L1 of the VC in VGlut2 cKO mice compared to WT at P14. (J) Example images from WT (top) and cKO (bottom), VGLUT1 in cyan and GLUA1 in red. (K–M) Quantification of VGLUT1, GLUA1, and colocalized puncta, respectively, normalized to WT. (N–Q) Decrease in GLUA2 protein levels and colocalization between GLUA2 and VGLUT1 in L1 of the VC in VGlut2 cKO mice compared to WT at P14. (N) Example images from WT (top) and cKO (bottom), VGLUT1 in cyan and GLUA2 in red. (O–Q) Quantification of VGLUT1, GLUA2, and colocalized puncta, respectively, normalized to WT. In (K–M) and (O–Q), data presented as mean ± s.e.m., squares and circles above each bar are mean fold change of each mouse. N = 5 mice/genotype. Arrowheads mark representative colocalized puncta in (J, N). Inset panels on the right show enlarged colocalized image from box in (J, N). Scale bar = 5 µm. In (J–Q), WT is Slc17a6 +/+; RORαcre+;tdTomato+; cKO is Slc17a6 f/f;RORαcre+;tdTomato+. Statistical analysis by t-test, p-value on each plot.
Figure 4—figure supplement 1.
Figure 4—figure supplement 1.. Thalamic glutamate release tunes astrocyte expression of synapse-regulating genes.
See also Figure 4—figure supplement 1—source data 1. (A) Western blot showing Gpc4 secretion from astrocytes is decreased in the presence of neurons. Example blot on the left, quantification on the right. Data presented as mean ± s.e.m., normalized to control condition, astrocytes cultured alone. N = 4 independent cultures. p by t-test, value on the plot. Red arrow indicates Gpc4 signal at ~36 kDa. (B) Western blot showing Gpc4 secretion from astrocytes is decreased in the presence of neurotransmitters glutamate, adenosine, and ATP as indicated. Left panel shows glypican 4, right panel indicates APOJ used as loading control. Example blot on the top, quantification is below. Data presented as mean ± s.e.m., normalized to control condition, astrocytes cultured alone. N = 4 independent cultures. p by t-test, value on the plot. Red arrow indicates Gpc4 signal at ~36 kDa, APOJ signal ~40 kDa.
Figure 4—figure supplement 2.
Figure 4—figure supplement 2.. Thalamic glutamate release tunes astrocyte expression of synapse-regulating genes.
(A-C) LGN axons terminate in the VC normally in the absence of VGLUT2. (A) Example images of the VC L4 showing thalamic axons (tdTomato, red) and VGLUT2 (cyan) presence in WT, VGlut2 cHet, and VGlut2 cKO mice as labeled. (B-C) Quantification of (A. B) No difference in volume of tdTomato+ LGN axons between the genotypes in either L1 or L4 as indicated. (C) VGLUT2 puncta associated with tdTomato+ processes are reduced in VGlut2 cHet, and VGlut2 cKO compared to WT. Plots show mean signal ± s.e.m. Squares above each bar are average of signal in each mouse. N=3 mice/genotype. Scale bar = 5 μm. P by One-Way ANOVA comparing genotypes within each layer, value on the plot. n.s: not significant. (D, F) Number of astrocytes (Slc1a3 positive cells) is unaltered in VGlut2 cKO mice at P14 or P7. Data presented as mean ± s.e.m. squares aound that neuronal but not astnd circles above each bar are mean fold change of each mouse. N=5 mice/ genotype. P by t-test, value on the plot. (E, G) Slc1a3 (Glast) mRNA expression levels are unaltered in VGlut2 cKO mice at P14 or P7. Data presented as scatter with mean + range. Grey or red dots are mRNA signal measured in individual astrocyte in WT, and VGlut2 cKO respectively. Large circles colored according to genotype are average signal. N=5 mice/genotype, n=~150-450 astrocytes/ per age total (average and statistical analysis is calculated based on N=5 i.e. per mouse). P by t-test, value on the plot. (H-J) mRNA expression of Gpc4, Gpc6 and Chrdl1 is unaltered in VGlut2 cKO mice at P7. Data presented as scatter with mean + range. Grey or red dots are mRNA signal measured in individual astrocyte in WT, and VGlut2 cKO respectively. Large circles colored according to genotype are average signal. N=5 mice/genotype, n=~150-450 astrocytes/ per age total (average and statistical analysis is calculated based on N=5 i.e. per mouse). Statistical analysis by t-test, P value on each plot. (K-N) Increase in GLUA1 protein levels and colocalization between GLUA1 and Bassoon in L1 of the VC in VGlut2 cKO mice compared to VGlut2 WT. (L). Example images from WT (top) and cKO (bottom), Bassoon in green, GLUA1 in red, and tdTomato positive LGN axon in white. (L, M, N) Quantification of Bassoon (number of puncta within the tdTomato positive processes), GLUA1 and colocalized puncta respectively, normalized to WT. (O-R) Decrease in GLUA2 protein levels and colocalization between GLUA2 and Bassoon in L1 of the VC in VGlut2 cKO mice compared to WT. (P) Example images from WT (top) and cKO (bottom), Bassoon in green, GLUA2 in red, and tdTomato positive thalamic axon in white. (P, Q, R) Quantification of Bassoon (number of puncta within the tdTomato positive processes), GLUA2 and colocalized puncta respectively, normalized to WT. In (K-R) data presented as mean ± s.e.m, squares and circles above each bar are mean fold change of each mouse. WT is: Slc17a6+/+; RORαcre+;tdTomato+; cKO is: Slc17a6f/f;RORαcre+;tdTomato+. N=5 mice/ genotype. Arrowheads mark representative colocalized puncta. Inset panels on the right show enlarged colocalized image from box in (K, O) Scale bar = 5 µm. Statistical analysis by t-test, P value on each plot.
Figure 5.
Figure 5.. Astrocytic calcium signaling tunes expression of synapse-regulating genes.
See also Figure 5—figure supplement 1, Figure 5—source data 1 and 2. (A) Schematic of comparison. Lack of the IP3R2 receptor results in diminished Ca2+ transients in astrocytes. (B) Validation of Itpr2 KO model. Western blot image shows absence of IP3R2 signal in visual cortex (VC) of KO mice. (C–H) mRNA expression of astrocyte synapse-regulating genes is altered in Ip3r2 KO mice at postnatal day (P)14. (C, E, G) Example images of in situ hybridization of Gpc4, Gpc6, and Chrdl1 mRNA (white) as labeled; astrocyte marker Slc1a3 (Glast, green). Merged panel on the left, single-channel probe panel on the right. (D, F, H) Quantification of (C, E, G), respectively. (D) Gpc4 mRNA expression is decreased in several layers of the VC in Ip3r2 KO mice. (F) Gpc6 mRNA expression is unaltered in the VC in Ip3r2 KO mice. (H) Chrdl1 mRNA expression is increased in several layers of the VC in Ip3r2 KO mice. Data presented as scatter with mean + range. Gray or purple dots are mRNA signals measured in individual astrocyte in WT and Ip3r2 KO, respectively. Large circles colored according to genotype are average signal. N = 5 mice/genotype, n = ~200–450 astrocytes/per age total (average and statistical analysis are calculated based on N = 5, i.e., per mouse). Arrowheads in single-channel panel mark astrocytes. Scale bar = 20 μm. Statistical analysis by t-test within each layer. p value on each plot. (I–L) Decrease in VGLUT1, GLUA1 protein levels, and colocalization between GLUA1 and VGLUT1 in L1 of the VC in Ip3r2 KO mice at P14. (I) Example images from WT (top) and KO (bottom), VGLUT1 in cyan and GLUA1 in red. (J–L) Quantification of VGLUT1, GLUA1, and colocalized puncta, respectively, normalized to WT. (M–P) Decrease in VGLUT1, and increase GLUA2 protein levels, with no change in colocalization between GLUA2 and VGLUT1 in L1 of the VC in Ip3r2 KO mice at P14. (M) Example images from WT (top) and KO (bottom), VGLUT1 in cyan, and GLUA2 in red. (N–P) Quantification of VGLUT1, GLUA2, and colocalized puncta, respectively, normalized to WT. In (J–L) and (N–P), data presented as mean ± s.e.m. squares and circles above each bar are mean fold change of each mouse. N = 5 mice/genotype. Arrowheads mark representative colocalized puncta. Inset panels on the right show enlarged colocalized image from box in (M). Scale bar = 5 µm. Statistical analysis by t-test, p-value on each plot.
Figure 5—figure supplement 1.
Figure 5—figure supplement 1.. Astrocytic calcium signaling tunes expression of synapse-regulating genes.
(A, C) Number of astrocytes (Slc1a3-positive cells) is unaltered in Ip3r2 KO mice at postnatal day (P)14 or P7. Data presented as mean ± s.e.m., squares and circles above each bar are mean fold change of each mouse. N = 5 mice/genotype. p by t-test, value on the plot. (B, D) Slc1a3 (Glast) mRNA expression levels are unaltered in Ip3r2 KO mice at P14 or P7. Data presented as scatter with mean + range. Gray or purple dots are mRNA signal measured in individual astrocyte in WT and KO, respectively. Large circles are average signal. N = 5 mice/genotype, n = ~50–350 astrocytes/per age total (average and statistical analysis are calculated based on N = 5, i.e., per mouse). Statistical analysis by t-test. (E–G) mRNA expression of Gpc4 (E) and Chrdl1 (G) is unaltered in Ip3r2 KO mice at P7. Gpc6 (F) expression is increased in L4. Data presented as scatter with mean + range. Gray or purple dots are mRNA signal measured in individual astrocyte in WT and KO, respectively. Large circles are average signal. N = 5 mice/genotype, n = ~150–450 astrocytes/per age total (average and statistical analysis are calculated based on N = 5, i.e., per mouse). Statistical analysis by t-test, p value on each plot. See also Figure 5—source data 1. (H–K) Decrease in VGLUT2, GLUA1 protein levels, and colocalization between GLUA1 and VGLUT2 in L1 of the VC in Ip3r2 KO mice. (H) Example images from WT (top) and KO (bottom), VGLUT2 in cyan and GLUA1 in red. (I–K) Quantification of VGLUT2, GLUA1, and colocalized puncta, respectively, normalized to WT. (L–O) Decrease in VGLUT2, and increase GLUA2 protein levels, with no change in colocalization between GLUA2 and VGLUT2 in L1 of the VC in Ip3r2 KO mice. (L) Example images from WT (top) and KO (bottom), VGLUT2 in cyan, and GLUA2 in red. (M–O) Quantification of VGLUT2, GLUA2, and colocalized puncta, respectively, normalized to WT. In (H–O), data presented as mean ± s.e.m., squares and circles above each bar are mean fold change of each mouse. N = 5 mice/genotype. Arrowheads mark representative colocalized puncta. Inset panels on the right show enlarged colocalized image from box in (H, L). Scale bar = 5 µm. Statistical analysis by t-test, p value on each plot.
Figure 6.
Figure 6.. Unbiased determination of astrocyte transcriptomic diversity and activity-regulated genes in the developing visual cortex (VC).
See also Figure 6—figure supplements 1–3, Figure 6—source data 1. (A) Outline of experiment: VCs collected from VGlut2 cKO, Ip3r2 KO, and their respective WT controls at postnatal day (P)14. Nuclei were isolated from VCs and sorted for NEUN-negative population (glia) using flow cytometry. Sorted nuclei were loaded onto 10X Chromium chip, each nucleus barcoded, followed by library preparation and sequencing. N = 8 samples total. (B) UMAP clustering of different cell types identified in the NEUN-negative population of the combined samples from VGlut2 WT and cKO mice. 17 clusters were identified including the three main types of glia: astrocytes, oligodendrocytes, and microglia, as well as endothelial cells, and two subtypes of neurons. (M-astrocyte: mitotic astrocyte; M-OPC: mitotic oligodendrocyte precursor cell; OPC: oligodendrocyte precursor cell; MFOL: myelin-forming oligodendrocyte; NFOL: newly formed oligodendrocyte; MOL: mature oligodendrocyte; VLMC: vascular and leptomeningeal cell; EC: endothelial cell; PC: pericyte; PVM: perivascular macrophage). (C) Unbiased clustering analysis identified four subpopulations of astrocytes in the P14 VC. Upper panels: left – UMAP plots of astrocyte populations annotated to upper, mid, deep, and white matter types following comparison with published datasets. Right panel – UMAP showing similar clustering obtained for WT and VGlut2 cKO groups. Lower panel shows the expression level of select marker genes that label a particular population as indicated. Each dot represents a single nucleus, color represents expression level in log2 counts per million reads mapped (CPM). Below are dot plots showing a select list of 10 genes that are highly expressed in each population as indicated. Size of the circle is expression ratio (percent cells expressing the gene); color is expression level (log2 CPM). (D) Pairwise comparison identified ~200–700 differentially expressed genes (DEGs) between astrocyte populations from WT mice from the VGlut2 cKO model. Larger numbers of DEGs are obtained when comparing upper and deep astrocyte populations. Criteria for DEG selection: log2 fold change (FC) between –0.15 and 0.15; false discovery rate (FDR) < 0.1; see also Figure 6—source data 1A and B. (E–H) Neuronal and astrocyte activity perturbation results in gene expression changes in astrocytes. (E) Number of DEGs identified for each model: VGlut2 cKO: 61 total DEGs; Ip3r2 KO: 131 total DEGs as labeled. Red: upregulated; blue: downregulated. (F, G) Heatmap showing top 20 DEGs identified in each model (F, VGlut2 cKO; G, Ip3r2 KO). Colors represent log2 FC between each condition. Criteria for DEG selection: log2 FC between –0.15 and 0.15; FDR < 0.1. See also Figure 6—source data 1D. (H) Venn diagrams show number of DEGs common to both models. Heatmap shows FC of the 19 common DEGs. Most common DEGs are inversely regulated in each model (upregulated in VGlut2 cKO and downregulated in Ip3r2 KO). (I) Venn diagram showing DEGs common to the VGlut2 cKO vs. WT comparison and genes enriched in astrocyte layer groups. Heatmap of expression level z score of a select list of 10 genes shows dysregulation of layer enrichment in the cKO mice compared to WT. Z-score was calculated for each gene using the combined data for WT and cKO average and standard deviation. (J) Same analysis as (I), but for the Ip3r2 KO model. See also Figure 6—source data 1E.
Figure 6—figure supplement 1.
Figure 6—figure supplement 1.. Unbiased determination of astrocyte transcriptomic diversity and activity-regulated genes in the developing visual cortex (VC).
(A, C) Expression level of select marker genes for each identified cluster (A: VGlut2 cKO model; C: Ip3r2 KO model). Circle size denotes expression ratio (percent cells expressing the gene), color represents expression level (in log2 CPM). Bar chart on the left shows cell numbers identified for each cluster are similar for WT and KO groups for each cluster in each model. (B) UMAP clustering of different cell types identified in the NEUN-negative population of the combined samples from Ip3r2 WT and KO mice. 17 clusters were identified including the three main types of glia: astrocytes, oligodendrocytes, and microglia, as well as endothelial cells, and two subtypes of neurons (for A–C – M-astrocyte: mitotic astrocyte; M-OPC: mitotic oligodendrocyte precursor cell; OPC: oligodendrocyte precursor cell; MFOL: myelin-forming oligodendrocyte; NFOL: newly formed oligodendrocyte; MOL: mature oligodendrocyte; VLMC: vascular and leptomeningeal cell; EC: endothelial cell; PC: pericyte; PVM: perivascular macrophage).
Figure 6—figure supplement 2.
Figure 6—figure supplement 2.. Unbiased determination of astrocyte transcriptomic diversity and activity-regulated genes in the developing visual cortex (VC).
(A) Unbiased clustering analysis identified four subpopulations of astrocytes in the postnatal day (P)14 VC using Ip3r2 WT dataset. Upper panels: left indicates UMAP plots of astrocyte populations annotated to upper, mid, deep, and white matter types following comparison with published datasets. Right panel indicates UMAP showing similar clustering obtained for WT and Ip3r2 KO mice. Lower panels show dot plots of select list of 10 genes that are highly expressed in each population as indicated. Size of the circle is expression ratio; color is expression level (log2 CPM). (B) Images of in situ hybridization from wild-type mouse VC at P14 obtained from the Allen Brain Atlas website (https://developingmouse.brain-map.org/) (Kcnd2 link to image: https://developingmouse.brain-map.org/experiment/show/100041438; Id3 link to image: https://developingmouse.brain-map.org/experiment/show/100071290; Gfap link to image: https://developingmouse.brain-map.org/experiment/show/100045585) showing validation of spatial localization of select genes identified in snRNAseq dataset. Kcnd2 is expressed in the mid layers, Id3 in deep layers, and Gfap is enriched in white matter. Cortical layers indicated on the left, vertical yellow line on the left of each image shows cortical region with highest expression. Scale bar = 1047 µm. (C) Similar number of cells (nuclei) was identified for each of the astrocyte groups in each model. VGlut2 cKO data presented in the top plot, Ip3r2 KO data in the bottom bar chart. (D) Pie charts as labeled showing percent astrocytes for each identified cluster out of total astrocytes. Monochrome pie chart is percent of astrocytes out of total astrocytes observed within each cortical layer in histological experiments (Figure 2C). (E) Pairwise comparison identified ~300–900 differentially expressed genes (DEGs) between populations in Ip3r2 WT mice. Larger numbers of DEGs obtained when comparing upper and deep astrocyte populations. Criteria for DEG selection: log2 fold change (FC) between –0.15 and 0.15; false discovery rate (FDR) < 0.1. See also Figure 6—source data 1B. (F–H) Gene Ontology (GO) terms analysis with String db of Biological Process of layer group-specific genes. (F) Venn diagram showing overlap in GO terms between layer groups. (G, H) Bar plots of GO terms unique to upper (G) and deep (H) astrocytes, showing divergent GO BP enrichment. Bar length is gene ratio, fill color is FDR. See also Figure 6—source data 1D. (I) Comparison of expression levels of astrocyte markers, function, and synapse-related genes identified in bulk RNAseq (Figure 1) with the snRNAseq dataset shows overall positive correlation between expression levels obtained by both methods. For snRNAseq panels, size of the circle is expression ratio; color is expression level (log2 CPM). For bulk RNAseq heatmaps, log2 FPKM is shown. (J) Total CPM expression levels of Gpc4, Gpc6, and Chrdl1 in each cluster as indicated showing expression patterns match those observed with Immunohistochemistry (IHC) described in Figure 2.
Figure 6—figure supplement 3.
Figure 6—figure supplement 3.. Unbiased determination of astrocyte transcriptomic diversity and activity-regulated genes in the developing visual cortex (VC).
(A–C) Gene Ontology (GO) terms analysis with String db of Biological Process in differentially expressed genes (DEGs) from the VGlut2 cKO model (A), Ip3r2 KO model (B), and common DEGs to both models (C). Blue indicates terms enriched in downregulated DEGs, red indicates terms enriched in upregulated DEGs. Bar length is gene ratio, fill color is false discovery rate (FDR). See also Figure 6—source data 1G. (D, E) Comparison between DEGs identified in the VGlut2 cKO dataset with DEGs between postnatal day (P)7 and P14 of WT mice, identified in the bulk RNAseq dataset (Figure 1). A total of 30 VGlut2 cKO DEGs were also significantly up- or downregulated at P14 vs. P7. The majority of common DEGs were inversely regulated (9 [30%] genes commonly regulated, 21 [70%] genes inversely regulated) as shown in the bar graph and heatmap on the right. (E) Same analysis as in (D), but for the Ip3r2 KO model. A total of 57 DEGs were commonly identified in the developmental dataset. About half of the genes were commonly regulated, while the other half were differentially regulated (31 genes commonly regulated, 26 genes differentially regulated) as shown in the bar graph and heatmap on the right. For this analysis, the selection criteria of bulk RNAseq P7–P14 DEGs are FPKM > 1; FDR < 0.1. See also Figure 6—source data 1F.
Figure 7.
Figure 7.. Summary of key findings and working model.
Box 1. Astrocytes and synapses develop across a similar time line in the mouse visual cortex (VC). Left diagram: majority of astrocyte transcriptomic changes (represented as number of differentially expressed genes [DEGs]) occur between postnatal day (P)7 (synapse initiation) and P14 (synapse maturation). Right diagram: select astrocytic synapse-regulating genes (Gpc4 and Chrdl1) and synaptic proteins (GLUA1, GLUA2) are differentially expressed between P7 and P14. Box 2. The spatio-temporal expression of astrocyte synapse-regulating genes is driven by thalamic neuronal activity and astrocyte calcium activity. Left: diagram of VC depicting neuronal (blue) laminar arrangement and connectivity (arrows). Astrocytes (green) are present in all cortical layers. Right: expression of astrocytic Gpc4 and Chrdl1 mRNA, and their regulated synaptic GLUAs during development. Gpc4 expression is decreased at P14, Chrdl1 expression is increased (correlating with increase in GLUA2 subunits, which are regulated by Chrdl1). These changes are regulated by thalamic neuronal activity in a time- and layer-specific manner. Additionally, overall expression of astrocytic genes is regulated by astrocyte calcium signaling. Box 3. Single-cell transcriptomic profiling of VC astrocytes at P14 reveals a heterogeneity of gene expression, with a global transcriptomic dependence on neuronal and astrocyte activity. Left: UMAP plot shows four different astrocyte clusters identified in the wild-type VC, which correspond to spatial organization in the cortex. Right: diagram showing layer-specific expression of select astrocytic genes as labeled.

Similar articles

Cited by

References

    1. Albanese A, Albanese E, Brusco A, Saavedra JP. A quantitative study of visual cortex synapses during the postnatal development of dark-reared rats. Journal of Neurobiology. 1983;14:1–8. doi: 10.1002/neu.480140102. - DOI - PubMed
    1. Allen NJ, Bennett ML, Foo LC, Wang GX, Chakraborty C, Smith SJ, Barres BA. Astrocyte glypicans 4 and 6 promote formation of excitatory synapses via glua1 ampa receptors. Nature. 2012;486:410–414. doi: 10.1038/nature11059. - DOI - PMC - PubMed
    1. Allen NJ. Role of GLIA in developmental synapse formation. Current Opinion in Neurobiology. 2013;23:1027–1033. doi: 10.1016/j.conb.2013.06.004. - DOI - PubMed
    1. Allen Brain Institute 2008. Allen Developing Mouse Brain Atlas. Allen Brain Institute. https://developingmouse.brain-map.org/
    1. Baldwin KT, Eroglu C. Molecular mechanisms of astrocyte-induced synaptogenesis. Current Opinion in Neurobiology. 2017;45:113–120. doi: 10.1016/j.conb.2017.05.006. - DOI - PMC - PubMed

Publication types

Associated data