. 2021 Sep 8;6(17):e149232.
doi: 10.1172/jci.insight.149232.

Nonredundant, isoform-specific roles of HDAC1 in glioma stem cells

Affiliations

Nonredundant, isoform-specific roles of HDAC1 in glioma stem cells

Costanza Lo Cascio et al. JCI Insight. .

Abstract

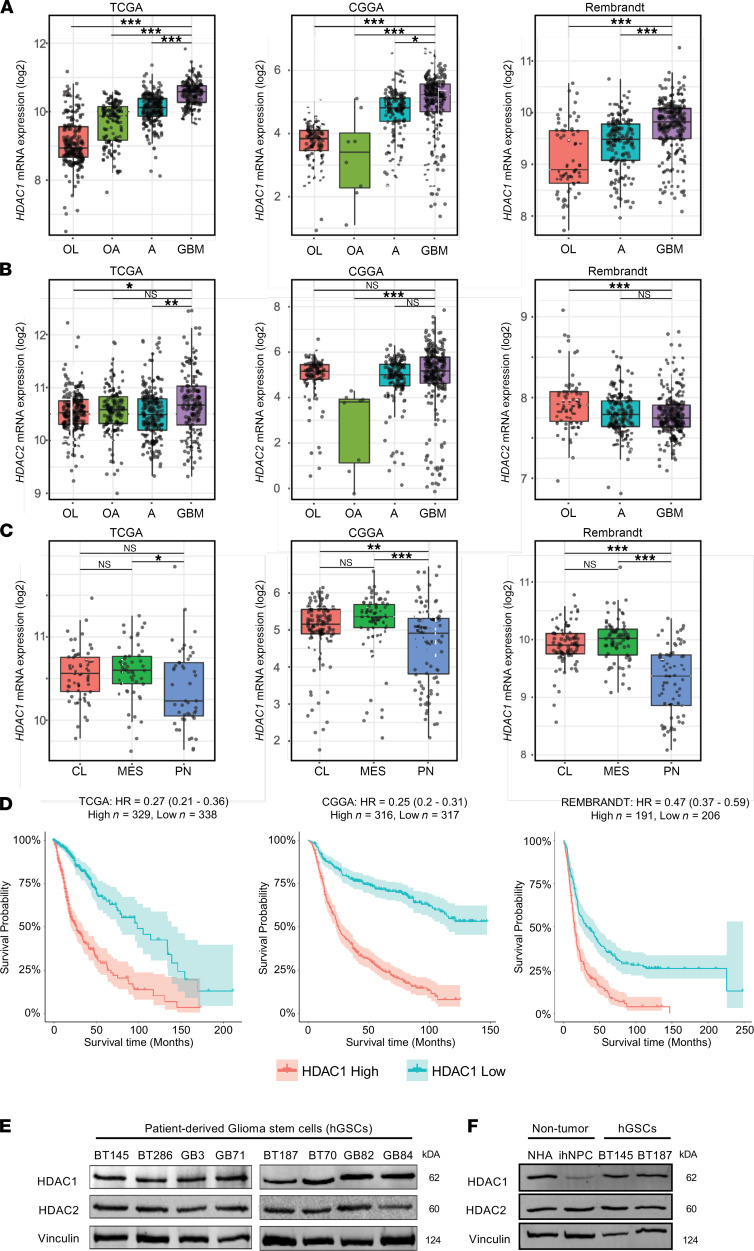
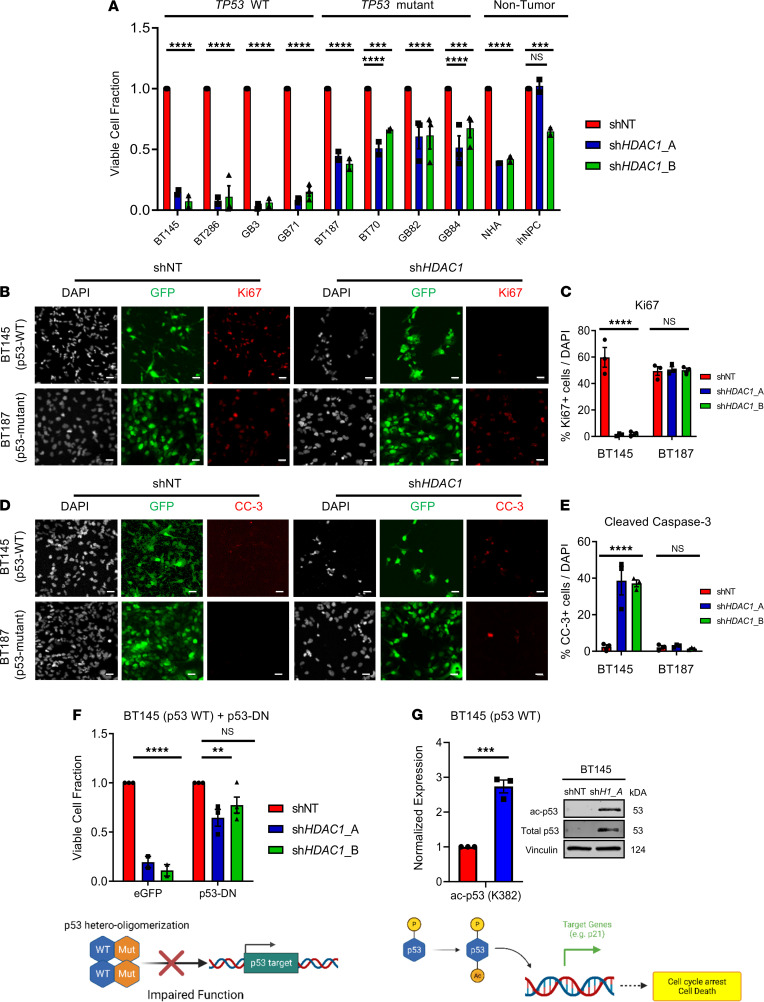
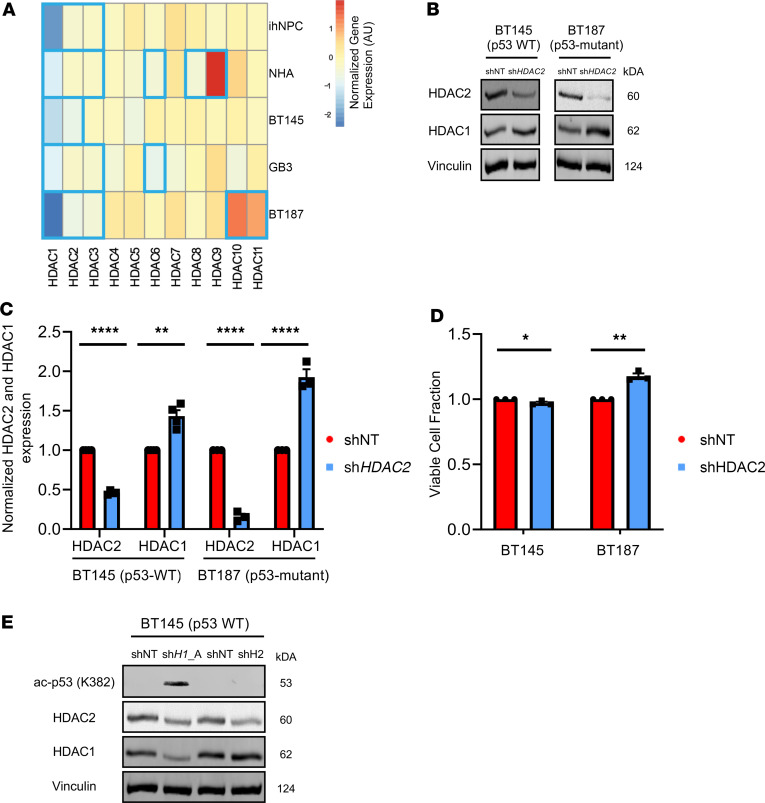
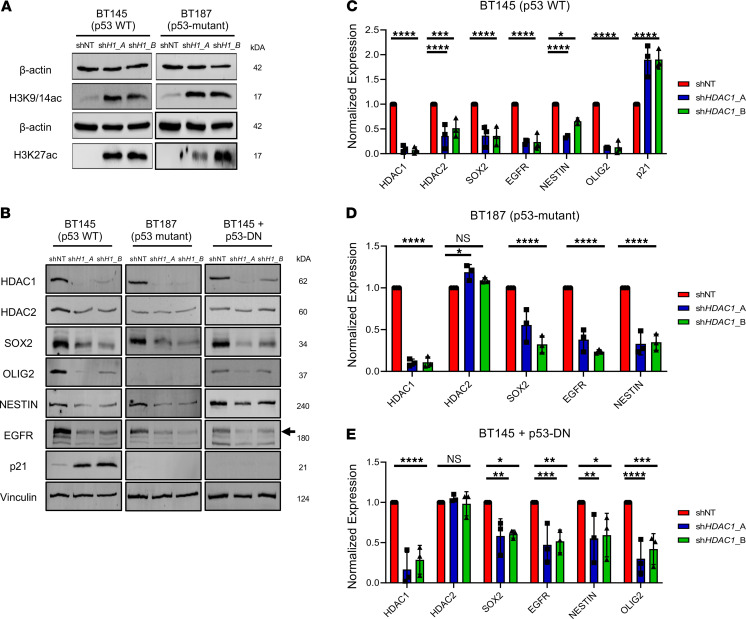
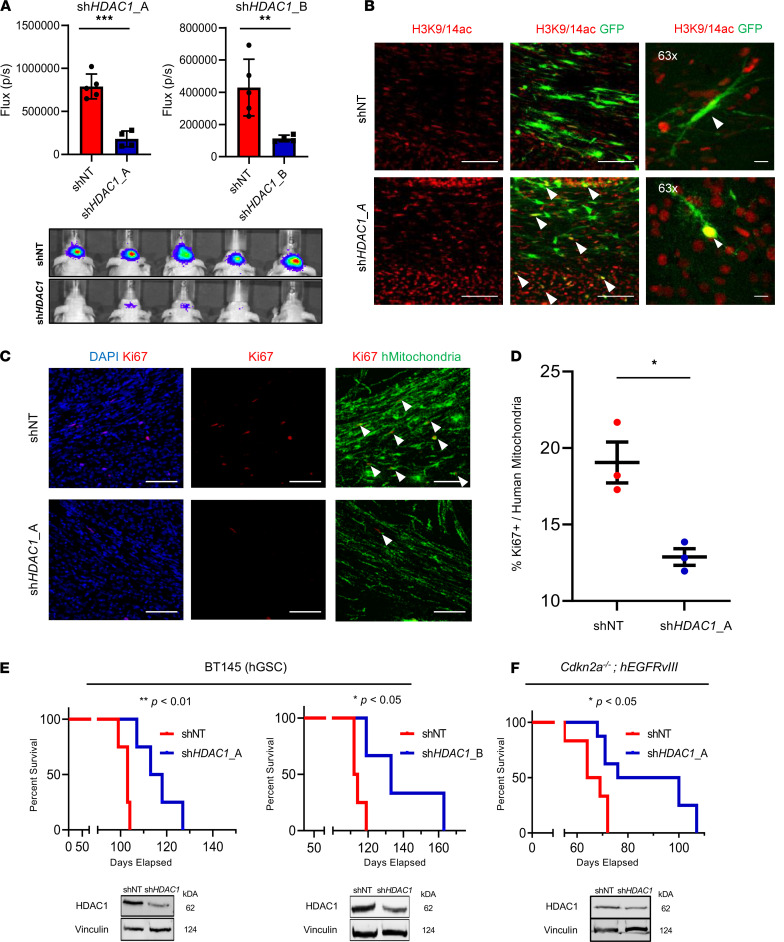
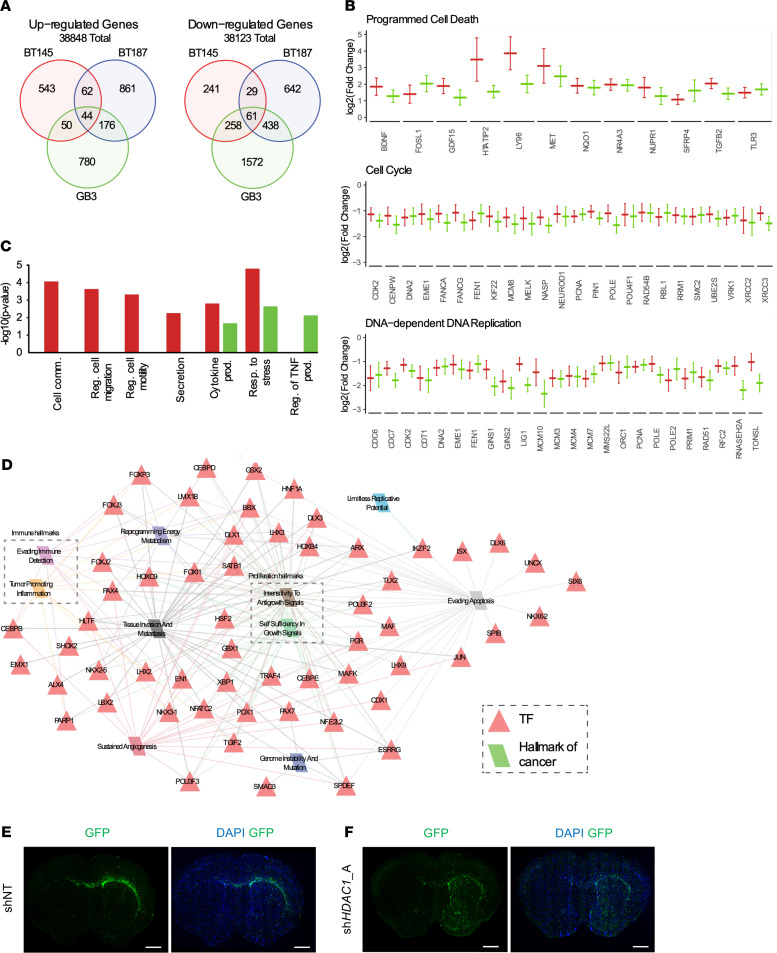
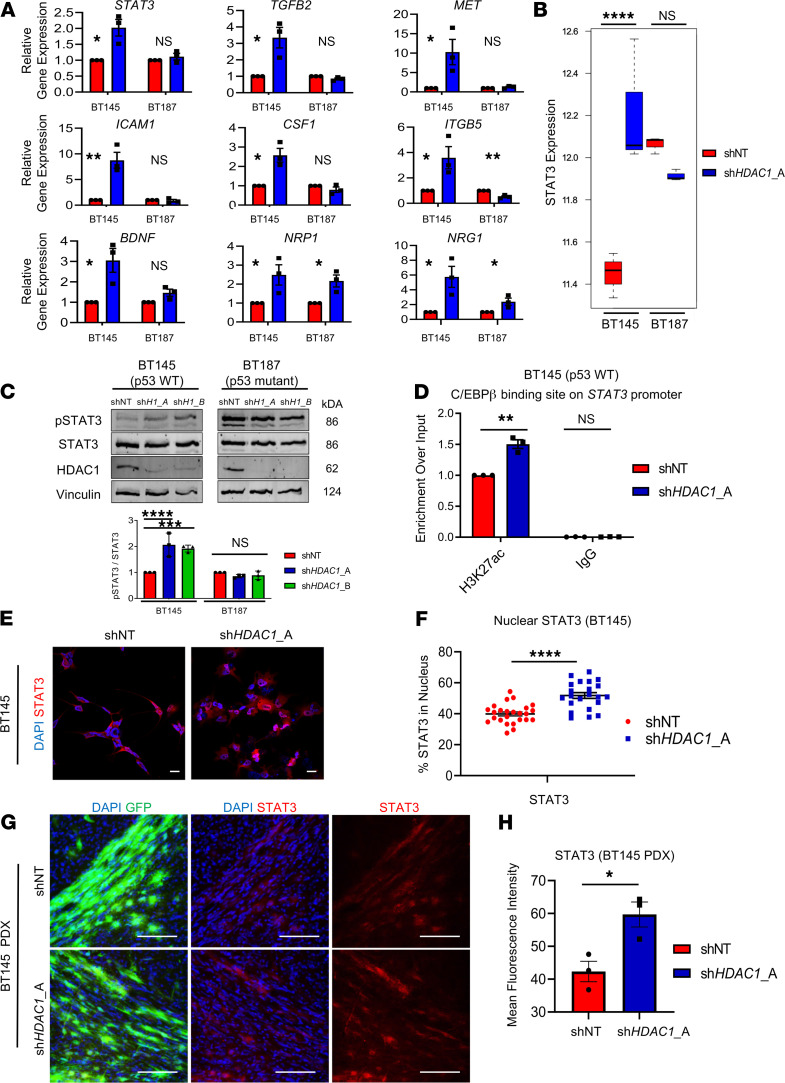
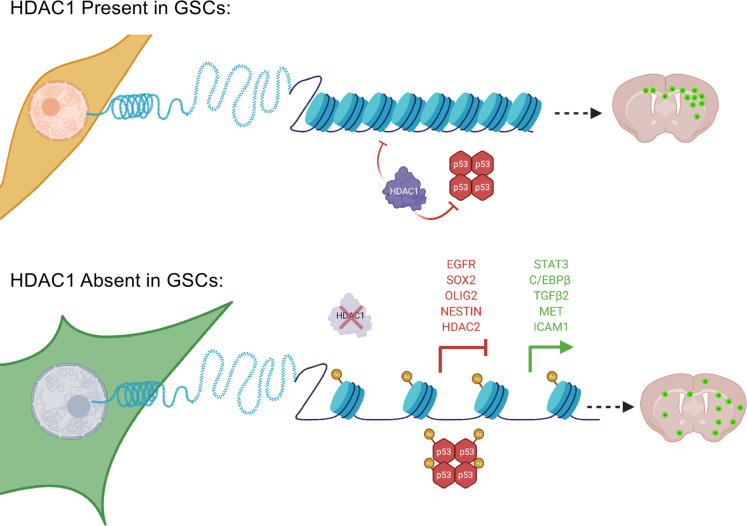
Glioblastoma (GBM) is characterized by an aberrant yet druggable epigenetic landscape. One major family of epigenetic regulators, the histone deacetylases (HDACs), are considered promising therapeutic targets for GBM due to their repressive influences on transcription. Although HDACs share redundant functions and common substrates, the unique isoform-specific roles of different HDACs in GBM remain unclear. In neural stem cells, HDAC2 is the indispensable deacetylase to ensure normal brain development and survival in the absence of HDAC1. Surprisingly, we find that HDAC1 is the essential class I deacetylase in glioma stem cells, and its loss is not compensated for by HDAC2. Using cell-based and biochemical assays, transcriptomic analyses, and patient-derived xenograft models, we find that knockdown of HDAC1 alone has profound effects on the glioma stem cell phenotype in a p53-dependent manner. We demonstrate marked suppression in tumor growth upon targeting of HDAC1 and identify compensatory pathways that provide insights into combination therapies for GBM. Our study highlights the importance of HDAC1 in GBM and the need to develop isoform-specific drugs.

Keywords: Brain cancer; Cancer; Epigenetics; Oncology; Stem cells.


Conflict of interest statement

Conflict of interest: The authors have declared that no conflict of interest exists.

Figures

Figure 1
Figure 1. HDAC1 expression levels in GBM.
(A) HDAC1 (B) and HDAC2 expression levels across various grades of gliomas (OL, oligodendroglioma; OA, oligoastrocytoma; A, astrocytoma; GBM, glioblastoma) within the TCGA, CCGA, and REMBRANDT databases. HDAC1, but not HDAC2, expression significantly increases with malignancy; Tukey’s post hoc test. (C) HDAC1 expression levels across the 3 GBM molecular subtypes (CL, classical; MES, mesenchymal; PN, proneural). (D) Kaplan-Meier analysis stratifying glioma patients with HDAC1 high and low expression within the TCGA, CCGA, and Rembrandt databases; log-rank test. (E) Immunoblot showing basal levels of HDAC1 and HDAC2 in p53-WT hGSCs (BT145, BT286, GB3, and GB71) and p53-mutant hGSCs (BT187, BT70, GB82, and GB84) (n = 3). (F) Immunoblot showing basal levels of HDAC1 and HDAC2 in nontumorigenic normal human astrocytes (NHAs) and induced pluripotent stem cell–derived (iPSC-derived) human neural progenitor cells (ihNPCs) alongside 2 hGSC lines (n = 3). The box plots depict the minimum and maximum values (whiskers), the upper and lower quartiles, and the median. The length of the box represents the interquartile range. *P < 0.05; **P < 0.01; ***P < 0.001. See also Supplemental Figure 1.
Figure 2
Figure 2. Knockdown of HDAC1 reduces viability of hGSCs in a p53-dependent manner.
(A) Quantification of the percentage of viable p53-WT and p53-mutant hGSCs and 2 nontumorigenic cell lines (NHAs, ihNPCs) transduced with shHDAC1_A or shHDAC1_B, compared with control cells transduced with nontarget shRNA (shNT) (n = 3). (B and C) Immunofluorescence staining (B) and quantification (C) of Ki67-positive hGSCs after acute HDAC1 silencing (n = 3). (D and E) Immunofluorescence staining (D) and quantification (E) of cleaved caspase-3–positive cells after acute HDAC1 silencing (n = 3). (F) Quantification of the percentage of viable p53-WT hGSCs overexpressing p53-DN or EGFP after HDAC1 knockdown (n = 3). Schematic below illustrates how overexpression of a p53 mutant (p53-DN) affects p53 function. (G) Quantification of immunoblots for total and acetylated p53 (K382) after HDAC1 silencing (shH1_A, shHDAC1_A) in p53-WT BT145 (n = 3). Schematic below illustrates how HDAC1 opposes p53 activation through direct deacetylation. For each cell line, the data are compiled from at least 3 independent experiments for each shRNA. Error bars indicate SEM. **P < 0.01, ***P < 0.001, ****P < 0.0001. Original magnification, 20×; scale bars, 2 μm. P values were determined using the 2-way ANOVA with Tukey’s multiple comparisons test or unpaired 2-tailed t test. See also Supplemental Figure 2, Supplemental Figure 3, and Supplemental Tables 1 and 2.
Figure 3
Figure 3. HDAC1 function is nonredundant in hGSCs and is not compensated for by its paralogue HDAC2.
(A) Log2 fold change of differential expression for the 11 HDACs (HDAC1–11) after short hairpin HDAC (shHDAC1) knockdown in 2 nontumorigenic (ihNPC and NHA) and 3 hGSC (BT145, GB3, BT187) cell lines. Blue bolded boxes indicate significant differential expression (adjusted P ≤ 0.05). (B) Representative immunoblot showing protein levels of HDAC1 and HDAC2 after acute HDAC2 knockdown (shHDAC2) in p53-WT (BT145) and p53-mutant (BT187) hGSCs. (C) Quantification of expression of HDAC2 and HDAC1 protein (normalized to Vinculin) after HDAC2 knockdown in BT145 (n = 4) and BT187 (n = 3). (D) Quantification of the percentage of viable hGSCs (BT145 and BT187) 7 days after HDAC2 knockdown, relative to shNT controls (n = 3). (E) Immunoblot comparing levels of acetylated p53 (K382) and HDAC1 and HDAC2 protein after HDAC1 and HDAC2 silencing in p53-WT hGSCs (BT145). For each cell line, the data are compiled from at least 3 independent experiments for each shRNA. Error bars indicate SEM. *P < 0.05, **P < 0.01, ****P < 0.0001. P values were calculated using unpaired 2-tailed t test. See also Supplemental Figure 4.
Figure 4
Figure 4. HDAC1 knockdown reduces expression of key stemness and cell fate factors.
(A) Immunoblots showing increase in H3K4/19ac and H3K27ac after HDAC1 silencing in BT145 and BT187 (shH1_A, shHDAC1_A; shH1B, shHDAC1_B) (n = 3). (B) Representative immunoblots of p53-WT (BT145), p53-mutant (BT187) and p53-WT cells overexpressing p53-DN (BT145 + p53-DN) hGSCs after acute silencing of HDAC1 probed for various markers (n = 3). Black arrow indicates expression of WT EGFR. (CE) Quantification of expression of proteins (normalized to Vinculin) after HDAC1 knockdown from immunoblots using p53-WT (C), p53-mutant (D), and p53-WT cells overexpressing p53-DN (E). For each cell line, the data are compiled from at least 3 independent experiments for each shRNA. Error bars indicate SEM. *P < 0.05, **P < 0.01, ***P < 0.001, ****P < 0.0001. P values were determined using the 2-way ANOVA with Tukey’s multiple comparisons test.
Figure 5
Figure 5. Knockdown of HDAC1 significantly extends survival in PDX and mouse models of GBM.
(A) Average photon flux (p/s) measured 7 weeks postinjection through bioluminescence imaging of mice implanted with cells expressing control (shNT) and HDAC1-knockdown (shHDAC1_A and shHDAC1_B) cells and representative heatmap of bioluminescence intensity between the 2 groups. (B) Immunostaining for acetylated histone H3 at lysines 9 and 14 (H3K9/14ac; red) in tumor tissue. Arrowheads indicate GFP-positive cells with H3K9/14a-positive nuclei. (C) Immunostaining for Ki67 (red) and human mitochondria (hMitochondria, green) in shNT and shHDAC1 BT145 tumor tissue. Arrowheads indicate double-positive (Ki67+hMitochondria+) nuclei. (D) Quantification of human Ki67-positive cells in shNT and shHDAC1 BT145 tumors (n = 3 per cohort). (E) Kaplan-Meier survival analysis of mice implanted intracranially with p53-WT hGSCs (BT145) transduced with HDAC1 shRNA (shHDAC1_A, n = 4; shHDAC1_B, n = 3) or nontarget shRNA (shNT; n = 4 in both studies). (F) Kaplan-Meier survival analysis of mice implanted intracranially with murine GSCs (Cdkn2a–/– hEGFRvIII) transduced with HDAC1 shRNA (shHDAC1_A, n = 5) or shNT (n = 4). Inset below shows immunoblots confirming HDAC1-knockdown in the implanted GSCs. Error bars indicate SEM. *P < 0.05, **P < 0.01, ***P < 0.001. Original magnification, 20× and 63×; scale bars, 100 μm. P values were calculated using unpaired 2-tailed t test and Kaplan-Meier method with the Mantel-Cox log-rank test. See also Supplemental Figure 5.
Figure 6
Figure 6. HDAC1 knockdown upregulates cell migration programs and results in more invasive tumors.
(A) Venn diagram illustrating the overlap between the significantly up- and downregulated genes between GSC cell lines after shHDAC1 knockdown. (B) Log2 fold change of gene expression after shHDAC1 knockdown in p53-WT hGSCs BT145 (red) and GB3 (green) hGSCs (adjusted P ≤ 0.05). (C) Negative log10 P value for functional enrichment of relevant Gene Ontology Biological Process (GO BP) terms for genes with significantly increased gene expression after shHDAC1 knockdown in BT145 (red) and/or GB3 (green) tumorigenic cell lines. (D) BT145 and GB3 specific regulatory network for upregulated genes following HDAC1 knockdown. Red triangles are transcription factor regulators and parallelograms are hallmarks of cancer. Edges indicate association between the target genes of the regulator and a hallmark of cancer and are colored according to its corresponding hallmark. For each cell line, the data are compiled from 3 independent experiments. (E and F) Stitched whole-brain images of DAPI (blue) and GFP-positive engrafted tumor cells (green) in (E) shNT and (F) shHDAC1 BT145 brain tissue 7 weeks postengraftment. GFP expression reveals HDAC1-deficient tumors are more invasive than control shNT tumors. Original magnification, 10×; scale bars, 1 mm. See also Supplemental Figure 6.
Figure 7
Figure 7. HDAC1 knockdown results in increased STAT3 signaling in p53-WT hGSCs.
(A) RT-qPCR for genes involved in cellular invasion or survival in BT145 (p53-WT) and BT187 (p53-mutant) hGSCs (n = 3 per target). (B) RNA-Seq analysis for STAT3 expression in BT145 and BT187 after HDAC1 knockdown. The box plots depict the minimum and maximum values (whiskers), the upper and lower quartiles, and the median. The length of the box represents the interquartile range. (C) Lysates were collected from BT145 and BT187 after acute silencing of HDAC1 (shH1_A, shHDAC1_A; shH1_B, shHDAC1_B). Immunoblots were probed with antibodies for phosphorylated STAT3 (Tyr705), STAT3, HDAC1, and Vinculin. Bar graph below shows quantification of the normalized ratio of p-STAT3 over total STAT3 protein after HDAC1 knockdown in BT145 and BT187 hGSCs (n = 3). (D) Chromatin immunoprecipitation assay for H3K27ac deposition in the C/EBPβ binding site on the STAT3 promoter in BT145 (n = 3). (E) Immunocytochemistry staining for STAT3 in BT145 after acute HDAC1 knockdown. (F) Quantification of immunocytochemistry experiments showing significantly increased nuclear localization of STAT3 after HDAC1 knockdown in BT145. Graph shows values from individual experimental values from multiple experiments (n = 4). (G) Immunofluorescence staining for STAT3 in BT145 PDX tumor tissue 7 weeks postengraftment in HDAC1-silenced tumors relative to controls. (H) Quantification of mean pixel intensity for STAT3 staining in BT145 shNT and shHDAC1 PDX tumors. Graph shows average values from 3 independent animals per experimental condition. Error bars indicate SEM. *P < 0.05, **P < 0.01, ***P < 0.001, ****P < 0.0001. For each cell line, the data are compiled from at least 3 independent experiments. Original magnification, 20×; scale bars, 2 μm and 100 μm. P values were calculated using unpaired 2-tailed t test or 2-way ANOVA with Tukey’s multiple comparisons test. See also Supplemental Figure 7.
Figure 8
Figure 8. Proposed model: consequences of HDAC1 silencing in p53-WT hGSCs.
Summary of the cellular and molecular effects of HDAC1 loss in p53-WT hGSCs. Absence of HDAC1 results in increased histone acetylation and restoration of p53 activation and stability. These changes are accompanied by marked changes in gene expression, wherein genes involved in maintaining stemness are downregulated while genes involved in promoting differentiation and cellular migration and communication are upregulated. In vitro, these cells fail to proliferate and die; however, when transplanted in vivo these cells form slower growing but more invasive tumors. STAT3 activity, which is known to drive aggressive phenotypes in GBM, is upregulated after HDAC1 loss and may be a potential druggable compensatory pathway that may be targeted in combination with more selective HDAC1i.

Similar articles

Cited by

References

    1. Allis CD, Jenuwein T. The molecular hallmarks of epigenetic control. Nat Rev Genet. 2016;17(8):487–500. doi: 10.1038/nrg.2016.59. - DOI - PubMed
    1. Haberland M, et al. The many roles of histone deacetylases in development and physiology: implications for disease and therapy. Nat Rev Genet. 2009;10(1):32–42. doi: 10.1038/nrg2485. - DOI - PMC - PubMed
    1. Lee P, et al. Mechanisms and clinical significance of histone deacetylase inhibitors: epigenetic glioblastoma therapy. Anticancer Res. 2015;35(2):615–625. - PMC - PubMed
    1. Galanis E, et al. Phase II trial of vorinostat in recurrent glioblastoma multiforme: a north central cancer treatment group study. J Clin Oncol. 2009;27(12):2052–2058. doi: 10.1200/JCO.2008.19.0694. - DOI - PMC - PubMed
    1. Hooker JM, et al. Histone deacetylase inhibitor, MS-275, exhibits poor brain penetration: PK studies of [C]MS-275 using Positron Emission Tomography. ACS Chem Neurosci. 2010;1(1):65–73. doi: 10.1021/cn9000268. - DOI - PMC - PubMed

Publication types