. 2021 Oct 31;9(2):e0119921.
doi: 10.1128/Spectrum.01199-21. Epub 2021 Sep 8.

Analysis of the Role of N-Linked Glycosylation in Cell Surface Expression, Function, and Binding Properties of SARS-CoV-2 Receptor ACE2

Affiliations

Analysis of the Role of N-Linked Glycosylation in Cell Surface Expression, Function, and Binding Properties of SARS-CoV-2 Receptor ACE2

Raymond Rowland et al. Microbiol Spectr. .

Abstract

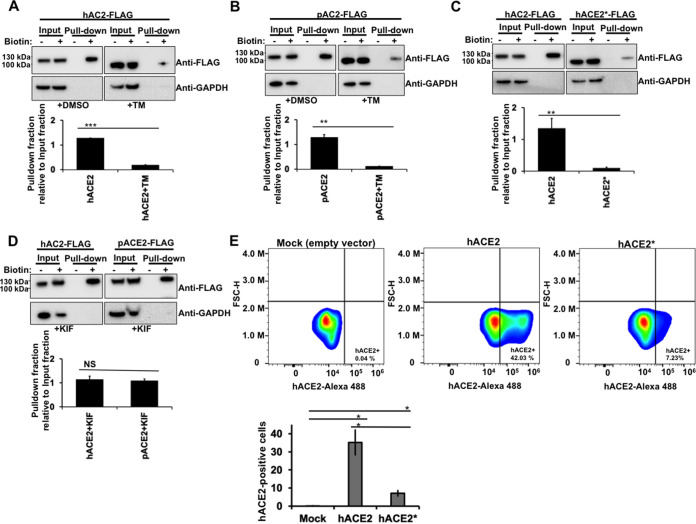
Human angiotensin I-converting enzyme 2 (hACE2) is a type I transmembrane glycoprotein that serves as the major cell entry receptor for SARS-CoV and SARS-CoV-2. The viral spike (S) protein is required for the attachment to ACE2 and subsequent virus-host cell membrane fusion. Previous work has demonstrated the presence of N-linked glycans in ACE2. N-glycosylation is implicated in many biological activities, including protein folding, protein activity, and cell surface expression of biomolecules. However, the contribution of N-glycosylation to ACE2 function is poorly understood. Here, we examined the role of N-glycosylation in the activity and localization of two species with different susceptibility to SARS-CoV-2 infection, porcine ACE2 (pACE2) and hACE2. The elimination of N-glycosylation by tunicamycin (TM) treatment, or mutagenesis, showed that N-glycosylation is critical for the proper cell surface expression of ACE2 but not for its carboxiprotease activity. Furthermore, nonglycosylable ACE2 was localized predominantly in the endoplasmic reticulum (ER) and not at the cell surface. Our data also revealed that binding of SARS-CoV or SARS-CoV-2 S protein to porcine or human ACE2 was not affected by deglycosylation of ACE2 or S proteins, suggesting that N-glycosylation does not play a role in the interaction between SARS coronaviruses and the ACE2 receptor. Impairment of hACE2 N-glycosylation decreased cell-to-cell fusion mediated by SARS-CoV S protein but not that mediated by SARS-CoV-2 S protein. Finally, we found that hACE2 N-glycosylation is required for an efficient viral entry of SARS-CoV/SARS-CoV-2 S pseudotyped viruses, which may be the result of low cell surface expression of the deglycosylated ACE2 receptor. IMPORTANCE Understanding the role of glycosylation in the virus-receptor interaction is important for developing approaches that disrupt infection. In this study, we showed that deglycosylation of both ACE2 and S had a minimal effect on the spike-ACE2 interaction. In addition, we found that the removal of N-glycans of ACE2 impaired its ability to support an efficient transduction of SARS-CoV and SARS-CoV-2 S pseudotyped viruses. Our data suggest that the role of deglycosylation of ACE2 on reducing infection is likely due to a reduced expression of the viral receptor on the cell surface. These findings offer insight into the glycan structure and function of ACE2 and potentially suggest that future antiviral therapies against coronaviruses and other coronavirus-related illnesses involving inhibition of ACE2 recruitment to the cell membrane could be developed.

Keywords: ACE2 glycoprotein; ACE2-spike binding; N-glycosylation; coronavirus; syncytium formation; virus entry.


Figures

FIG 1
FIG 1
Effect of N-glycosylation inhibition on expression and electrophoretic mobility of hACE2 and pACE2. (A) Schematic representations of the N-glycosylation sites of ACE2 receptors from human and pig. The hACE2 N-linked glycosylation sites, –Asn-Xaa-Ser/Thr-(Xaa≠P)–, are indicated in red. Eight potential N-glycosylation sites in the pACE2 are also indicated in red. The box is the transmembrane domain. A three-dimensional (3D) model showing the location of N-glycans on hACE2 dimer (PDB ID: 6M18) is shown. The potential binding location of SARS-CoV-2 receptor-binding domain (RBD) with hACE2 receptor is also shown. Recent molecular dynamics simulation studies using full glycan structures indicate that N-glycans at N90, N322, and N546 may be implicated in the interaction with coronavirus S protein RBD (35, 36). (B and C) HEK 293T cells were transfected with plasmids expressing either hACE2 (B) or pACE2 (C) and treated with TM for 16 h before harvesting or digested with PNGase F. ACE2 was detected with anti-FLAG antibody. (D) Western blotting of hACE2 and hACE2* expression levels in transfected HEK 293T cells. Cells were treated with TM, and cell lysates were digested with PNGase F. (E and F) Western blots of hACE2 and pACE2 expression levels after KIF treatment for 16 h. Cell lysates were digested with endo H and immunoblotted with anti-FLAG antibody. In all experiments, GAPDH was used as a loading control. Densitometry of ACE2 bands shown in B through F are normalized to the loading control GAPDH. Fold changes are shown relative to empty vector (pCDNA3.1), and results are means ± standard deviation (SD) values from three independent experiments (*, P < 0.05; **, P < 0.005; NS, not significant). hACE2* refers to N-glycosylation sites removed by replacing Asn with Gln. (G) Cell viability was determined by measuring the reduction of the water-soluble tetrazolium dye MTS to water-soluble colored formazan product. We treated 3 × 104 HEK 293T cells/well in a 96-well plate with the indicated concentrations of tunicamycin (TM) or kifunensine (KIF) for 16 h, 24 h, or 48 h at 37°C. After the incubation periods, 20 μl MTS solution was added to each well for an additional 2 h at 37°C. The optical density was measured at 490 nm using a microplate reader. Results are means ± SD values from three independent experiments. Mock-treated cells represent 100% viability.
FIG 2
FIG 2
Inhibition of cellular N-glycosylation induces colocalization of ACE2 with the ER. (A) Semiconfluent monolayers of HEK 293T cells grown on coverslips were transfected with either hACE2- or pACE2-expressing plasmids, and the cells were incubated with TM (1 μg/ml) (+TM) dissolved in DMSO or DMSO only (+DMSO) for 16 h, fixed, and stained with anti-FLAG antibody and then with Alexa 488-goat anti-rabbit IgG (green). ER was visualized by staining cells with PDI monoclonal antibody, followed by Alexa 594-goat anti-mouse IgG (red). Nuclei were counterstained with DAPI (blue). (B) Same as panel A, except cells were treated with KIF (5 μg/ml) (+KIF) for 16 h. (C) Quantification of colocalization of ACE2 proteins and ER. Five to six fields were randomly selected in each sample and 50 to 60 individual cells were analyzed. Pearson’s correlation coefficient (PCC) values are means ± SD from one representative experiment performed in triplicate. ***, P < 0.0005 with respect to hACE2 and pACE2. Similar results were obtained in three separate experiments and representative data are shown. (D) HEK 293T cells were transfected with either hACE2- or hACE2*-expressing plasmids, as well as pACE2-expressing vector. Transfected cells were either untreated (+DMSO) or incubated with TM (1 μg/ml) dissolved in DMSO (+TM) for 16 h. All cells were fixed and immunostained using anti-M2 FLAG antibody and then with Alexa 594-conjugated goat anti-mouse IgG (red). Golgi apparatuses were visualized by immunostaining them with a golgin-97 antibody, followed by Alexa 488-conjugated goat anti-rabbit IgG (green). Nuclei were counterstained with DAPI (blue). Similar results were obtained in three separate experiments and representative data are shown.
FIG 3
FIG 3
Colocalization of N-glycosylation-deficient hACE2 variants with ER. (A) Expression of the N-glycosylation hACE2 mutants was analyzed by Western blotting using anti-FLAG antibody and GAPDH as a loading control. Densitometry of hACE2 bands shown below the immunoblots are normalized to the loading control, GAPDH. Fold changes are shown relative to empty vector (pCDNA3.1), and results are means ± SD values from three independent experiments (*, P < 0.05; NS, not significant). (B) Semiconfluent monolayers of HEK 293T cells grown on coverslips were transfected with the indicated hACE2 mutants. All cells were fixed and immunostained as in Figure 2. (C) Quantification of colocalization of ACE2 variants and ER was performed as described in Figure 2. Pearson’s correlation coefficient (PCC) values between the ACE2 staining and intracellular endoplasmic reticulum marker are shown on the plot. Values are means ± SD from one representative experiment performed in triplicate. ***, P < 0.0005 (as determined by two-tailed Student’s t test) compared with the wild-type hACE2. Similar results were obtained in three separate experiments and representative data are shown. (D) Semiconfluent monolayers of HEK 293T cells grown on coverslips were transfected with hACE2-, hACE2*-, or pACE2-expressing plasmids, and the cells were incubated with TM (1 μg/ml) (+TM) dissolved in DMSO or DMSO only (+DMSO) for 16 h, fixed, and stained using anti-FLAG antibody and then with Alexa 594-conjugated goat anti-mouse IgG (red). ER was visualized by staining cells with calnexin antibody, followed by Alexa 488-conjugated goat anti-rabbit IgG (green). Nuclei were counterstained with DAPI (blue). Similar results were obtained in three separate experiments and representative data are shown.
FIG 4
FIG 4
N-glycosylation inhibition and cell surface expression of ACE2. (A through D) HEK 293T cells were transiently transfected for 24 h with the indicated FLAG-tagged ACE2 constructs. Where stated, transfected cells were incubated with either TM (1 μg/ml) or KIF (5 μg/ml) for 16 h before biotin labeling. Cells were treated with (+) or without (−) biotin to label surface protein for 1 h at 4°C. After neutravidin agarose pulldown, proteins were immunoblotted with anti-FLAG antibody. GAPDH was used as the control to assess the purity of biotinylated plasma membrane fractions. The amount of pulldown fraction (Biotin+) relative to input fraction (Biotin+) for three independent experiments with standard deviations is shown. **, P < 0.005; ***P < 0.0005; NS, not significant. (E) HEK 293T cells were transfected with either hACE2*- or hACE2-expressing plasmid. The percentage of hACE2-positive cells was measured at 24 h posttransfection by FACS. Results are means ± SD values from three independent experiments (*, P < 0.05). Representative data sets are shown for hACE2 and hACE2* surface staining (upper panels). FSC-H, forward scatter height.
FIG 5
FIG 5
ACE2 carboxypeptidase activity in the absence of glycosylation. (A) Plot showing the results of carboxypeptidase assays using the indicated immunoprecipitated FLAG-tagged ACE2 variants. A representative Western blot with an anti-FLAG antibody that detects immunoprecipitated ACE2 variants is shown on the right. (B) The same as panel A, but showing the results of carboxypeptidase assays using the immunoprecipitated FLAG-tagged hACE2* mutant. A representative Western blot with an anti-FLAG antibody that detects immunoprecipitated hACE2 variants is shown on the right. Results are means ± SD values from three independent experiments.
FIG 6
FIG 6
Coimmunoprecipitation assays and colocalization experiments to analyze ACE2-spike interactions. (A) HEK 293T cells were independently transfected with vectors expressing the indicated FLAG-tagged hACE2 or pACE2 proteins. Other cells were transfected with an S-expressing vector. Cells expressing ACE2 variants or S protein were lysed at 24 h posttransfection. The cell lysates were mixed in a 1:1 ratio and incubated with anti-FLAG beads. To control for background binding of S protein to anti-FLAG beads, we performed similar experiments with HEK 293T cells that were independently transfected with an S-expressing plasmid or an empty pCDNA3.1 vector. The amount of untagged and FLAG-tagged proteins in the lysates (Input) and immunoprecipitates (IP) was analyzed by Western blotting with anti-S and anti-FLAG antibodies. WB, Western blot; IP, immunoprecipitation. Similar results were obtained in three independent experiments and representative data are shown. (B) Cellular colocalization of ACE2 variants and S protein. Cells were cotransfected with ACE2-expressing plasmids and an S-expressing vector. After 24 h, cells were fixed and immunostained using anti-FLAG antibody followed by Alexa 488-conjugated goat anti-rabbit IgG (green). The S protein was visualized using anti-S monoclonal antibody, followed by Alexa 594-goat anti-mouse IgG (red). Nuclei were counterstained with DAPI (blue). Similar results were obtained in three separate experiments and representative data are shown.
FIG 7
FIG 7
Role of N-glycosylation in ACE2/S colocalization and binding. (A through C) The same Western blotting and immunoprecipitation experiments as those in Figure 6A were repeated but in the presence of TM (1 μg/ml). Cells were lysed 24 h after transfection. (D) 293T cells were transfected with a plasmid expressing SARS-CoV-2 S protein and treated with TM (1 μg/ml). Sixteen hours posttreatment, the S protein was precipitated by using ACE2 as bait (lane 3), as indicated in Figure 6. Cell lysates were also digested with PNGase F (lane 2). All the samples were analyzed by Western blotting using anti-S monoclonal antibody. (E) The same as panel C, but both S and ACE2 protein were deglycosylated. (F and G) Cells were cotransfected with ACE2-expressing plasmids and an S-expressing vector. Cells were either untreated (+DMSO) or incubated with TM (1 μg/ml) (+TM) dissolved in DMSO for 16 h. All cells were fixed and immunostained using anti-FLAG antibody and then with Alexa 488-goat anti-rabbit IgG (green). S protein was visualized by immunostaining with anti-S monoclonal antibody, followed by Alexa 594-goat anti-mouse IgG (red). Nuclei were counterstained with DAPI (blue). Similar results were obtained in three separate experiments and representative data are shown.
FIG 8
FIG 8
Blocking of N-glycosylation of SARS-CoV S protein and/or ACE2 does not disrupt their binding and cellular colocalization. (A) HEK 293T cells were independently transfected with the following vectors: an empty pCDNA3.1 vector, a vector expressing either hACE2 or hACE2* protein with a FLAG epitope tag, or an untagged S-expressing vector, followed by TM (1 μg/ml) treatment for 16 h. Cytosolic extracts were prepared separately at 24 h posttransfection, mixed in a 1:1 ratio, and used for immunoprecipitation with an anti-FLAG antibody. The amount of untagged and FLAG-tagged proteins in the lysates (Input) and immunoprecipitates (IP) was analyzed by Western blotting with anti-S and anti-FLAG antibodies. WB, Western blot; IP, immunoprecipitation. (B) HEK 293T cells were cotransfected with either hACE2- or hACE2*-expressing plasmids and an empty pCDNA3.1 plasmid or an S-expressing vector for 24 h. Cells were either untreated (+DMSO) or incubated with TM (1 μg/ml) (+TM) dissolved in DMSO for 16 h. Cells were fixed and immunostained as described in Figure 7. (C) HEK 293T cells were transfected with a plasmid expressing S protein and treated with TM (1 μg/ml). Sixteen h posttreatment, the S protein was precipitated by using hACE2 as bait (lane 3), as described above. Cell lysates were also digested with PNGase F (lane 2). All the samples were analyzed by Western blotting using anti-S monoclonal antibody. (D) same as panel A, but the HEK 293T cells were transfected with a pACE2-expressing plasmid. The procedure for the coprecipitation is also the same as that described in panel A. (E) Same as panel A, but both S and hACE2 protein are deglycosylated. (F) Same as panel B, but the HEK 293T cells were transfected with a pACE2-expressing plasmid. The immunofluorescence analysis was also performed as indicated in panel B. Similar results were obtained in three independent experiments and representative data are shown.
FIG 9
FIG 9
Effect of hACE2 N-glycosylation on SARS-CoV S and SARS-CoV-2 S protein fusion activity. (A) HEK 293T effector cells were cotransfected with a GFP-expressing plasmid along with one of the following plasmids: a plasmid expressing SARS-CoV-2 S protein, a plasmid expressing SARS-CoV S protein, or an empty pCDNA3.1 plasmid. At 24 h posttransfection, cells were detached and cocultured with HEK 293T target cells coexpressing either hACE2 or hACE2* and TMPRSS2 for 24 h. Target cells transfected with an empty plasmid were included as the negative control. Representative results are shown. A Western blot showing expression of hACE2 and hACE2* proteins is shown on the right. GAPDH was used as a loading control. Densitometry of hACE2 bands shown below the immunoblots is normalized to the loading control, GAPDH. Fold changes are shown relative to empty vector (pCDNA3.1) and results are means ± SD values from three independent experiments (*, P < 0.05; NS, not significant). (B) Biotinylation of effectors cells coexpressing GFP and SARS-CoV-2 S protein or SARS-CoV S protein. Cells were treated with (+) or without (−) biotin to label surface protein for 1 h at 4°C. After neutravidin agarose pulldown, proteins were immunoblotted with anti-S antibody. GAPDH and GFP were used as controls to assess the purity of biotinylated plasma membrane fractions. Densitometry analysis of the pulldown S bands is shown; bands were normalized to the SARS-CoV S protein. Fold changes are shown relative to pulldown SARS-CoV S protein and data are mean values of three independent experiments (NS, not significant). (C) Quantitative representation of syncytia shown in panel A. Results are means ± SD values from three independent experiments. ***, P < 0.0005; NS, not significant with respect to the negative controls, hACE2*, and hACE2-Low. (D) HEK 293T cells were transfected with either hACE2*- or hACE2-expressing plasmids. To normalize cell surface expression of both hACE2 proteins, the DNA amount of hACE2-expressing plasmid used for transfection was reduced 4.5 times. The percentage of hACE2-positive cells was measured at 24 h posttransfection by FACS. Results are means ± SD values from three independent experiments (*, P < 0.05). Representative data sets are shown for hACE2 and hACE2* surface staining (upper panels). FSC-H, forward scatter height.
FIG 10
FIG 10
Contribution of ACE2 N-glycosylation to viral entry of SARS-CoV/SARS-CoV-2 S pseudotyped viruses. (A) HEK 293T cells were transiently transfected with plasmids expressing hACE2 or hACE2* proteins, and their expression levels were analyzed by Western blotting using anti-FLAG and anti-GAPDH antibodies. Densitometry of hACE2 bands shown below the immunoblots are normalized to the loading control GAPDH. Fold changes are shown relative to empty vector (pCDNA3.1) and results are means ± SD values from three independent experiments (**, P < 0.005; NS, not significant). (B) Representative fluorescence images of HEK 293T cells expressing wild-type hACE2 or hACE2* after infection with equalized amounts of GFP-expressing SARS-CoV, SARS-CoV-2, or VSV-G pseudotyped viruses. (C) The percentage of GFP-positive cells was measured at 72 h postinfection by FACS. Wild-type VSV-G was used as a positive control. Results are means ± SD values from three independent experiments. *, P < 0.05; **, P < 0.005; NS, not significant.
FIG 11
FIG 11
Glycosylation is not important for hACE2 protein stability. HEK 293T cells were transiently transfected with hACE2- or hACE2*-expressing plasmids for 24 to 48 h. Cells were then treated with 100 μg/ml of cycloheximide (CHX) for a period of 10 h. At the indicated times after the beginning of the CHX treatment, cells were lysed. Cell lysates were analyzed with Western blotting and probed with antibodies directed against either the FLAG epitope tag or GAPDH. Densitometry of ACE2 bands shown below the immunoblots are normalized to the loading control GAPDH. Fold changes are shown relative to 0 h and data are mean values of three independent experiments (NS, not significant).

Similar articles

Cited by

References

    1. World Health Organization. 2020. World Health Organization coronavirus disease 2019 (COVID-19) situation report. https://www.who.int/emergencies/diseases/novel-coronavirus-2019/situatio....
    1. Zhu N, Zhang D, Wang W, Li X, Yang B, Song J, Zhao X, Huang B, Shi W, Lu R, Niu P, Zhan F, Ma X, Wang D, Xu W, Wu G, Gao GF, Tan W, China Novel Coronavirus Investigating and Research Team. 2020. A novel coronavirus from patients with pneumonia in China, 2019. N Engl J Med 382:727–733. doi:10.1056/NEJMoa2001017. - DOI - PMC - PubMed
    1. Wu F, Zhao S, Yu B, Chen Y-M, Wang W, Song Z-G, Hu Y, Tao Z-W, Tian J-H, Pei Y-Y, Yuan M-L, Zhang Y-L, Dai F-H, Liu Y, Wang Q-M, Zheng J-J, Xu L, Holmes EC, Zhang Y-Z. 2020. A new coronavirus associated with human respiratory disease in China. Nature 579:265–269. doi:10.1038/s41586-020-2008-3. - DOI - PMC - PubMed
    1. Zhou P, Yang X-L, Wang X-G, Hu B, Zhang L, Zhang W, Si H-R, Zhu Y, Li B, Huang C-L, Chen H-D, Chen J, Luo Y, Guo H, Jiang R-D, Liu M-Q, Chen Y, Shen X-R, Wang X, Zheng X-S, Zhao K, Chen Q-J, Deng F, Liu L-L, Yan B, Zhan F-X, Wang Y-Y, Xiao G-F, Shi Z-L. 2020. A pneumonia outbreak associated with a new coronavirus of probable bat origin. Nature 579:270–273. doi:10.1038/s41586-020-2012-7. - DOI - PMC - PubMed
    1. Chen G, Wu D, Guo W, Cao Y, Huang D, Wang H, Wang T, Zhang X, Chen H, Yu H, Zhang X, Zhang M, Wu S, Song J, Chen T, Han M, Li S, Luo X, Zhao J, Ning Q. 2020. Clinical and immunological features of severe and moderate coronavirus disease 2019. J Clin Invest 130:2620–2629. doi:10.1172/JCI137244. - DOI - PMC - PubMed

Publication types

LinkOut - more resources