. 2021 Oct 4;218(10):e20200853.
doi: 10.1084/jem.20200853. Epub 2021 Sep 8.

Autoimmunity affecting the biliary tract fuels the immunosurveillance of cholangiocarcinoma

Affiliations

Autoimmunity affecting the biliary tract fuels the immunosurveillance of cholangiocarcinoma

Juliette Paillet et al. J Exp Med. .

Abstract

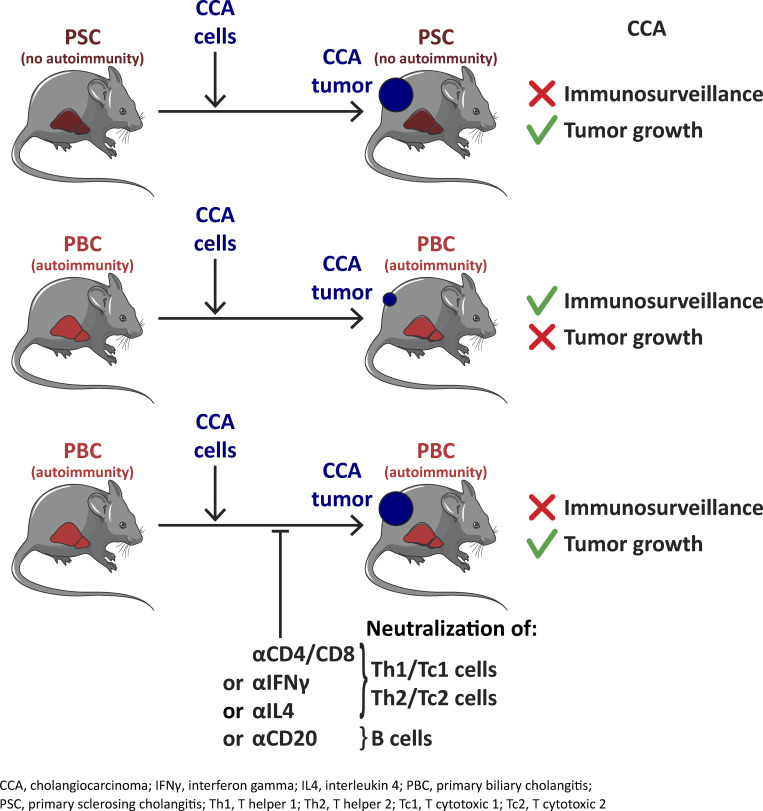
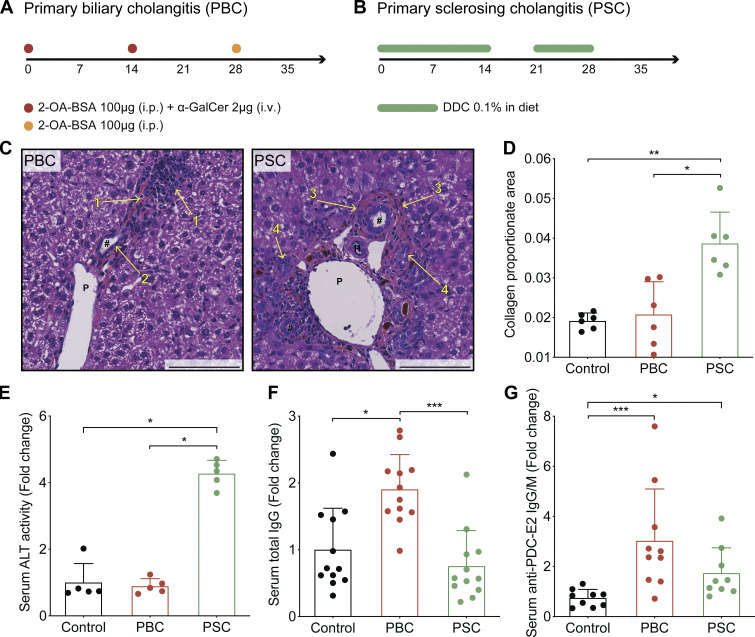
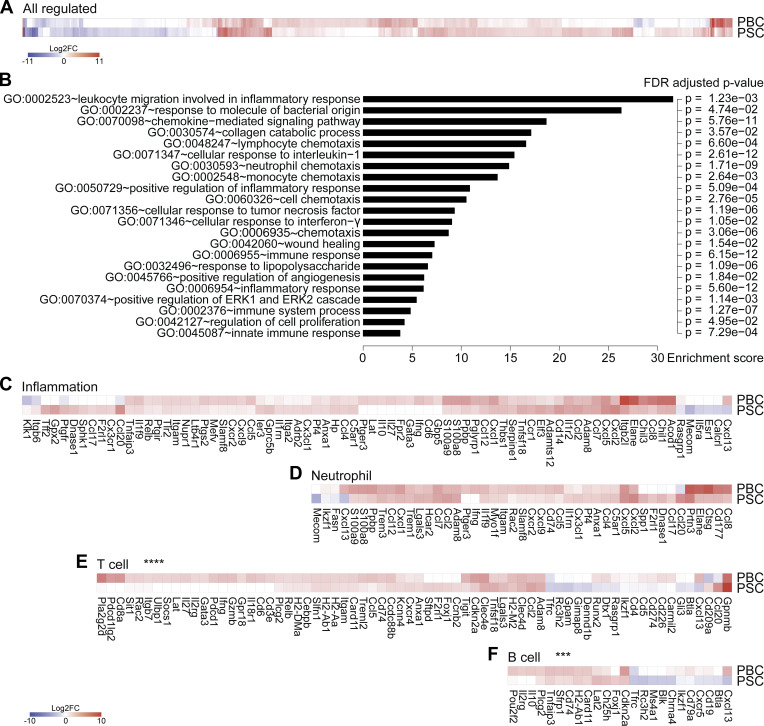
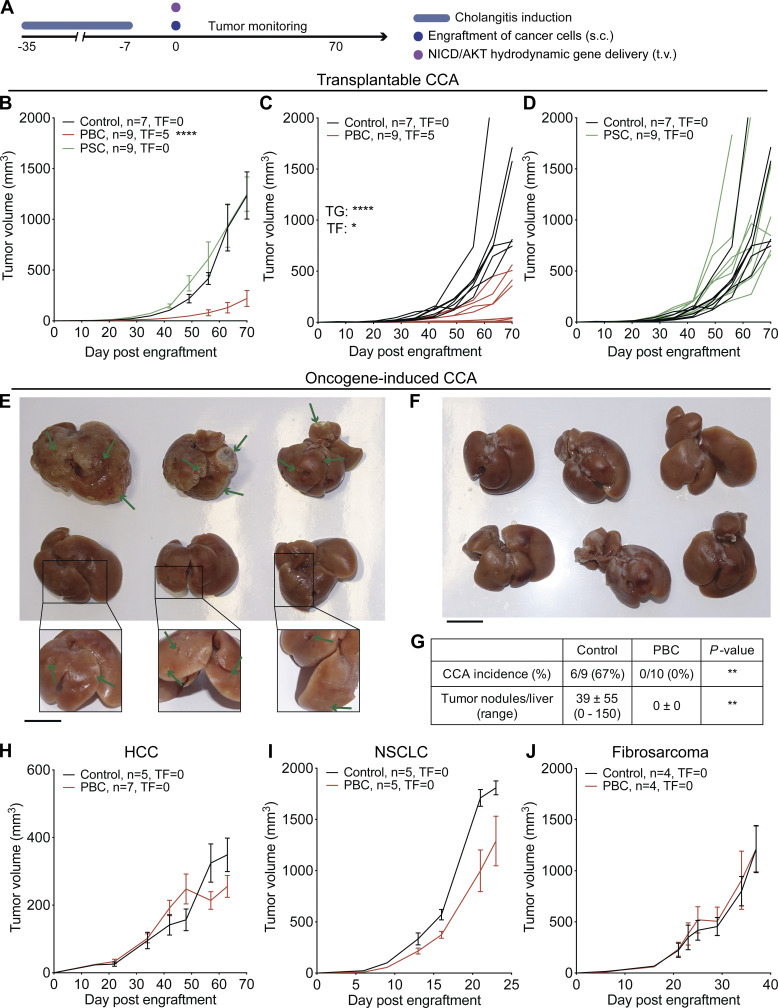
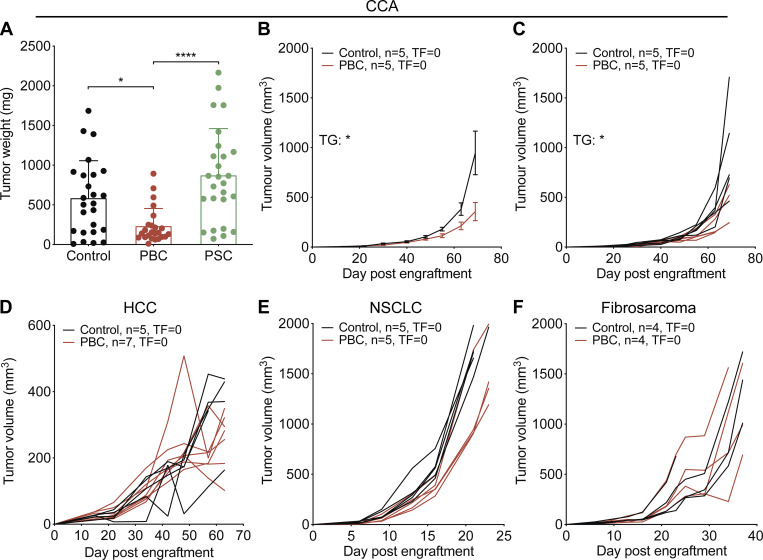
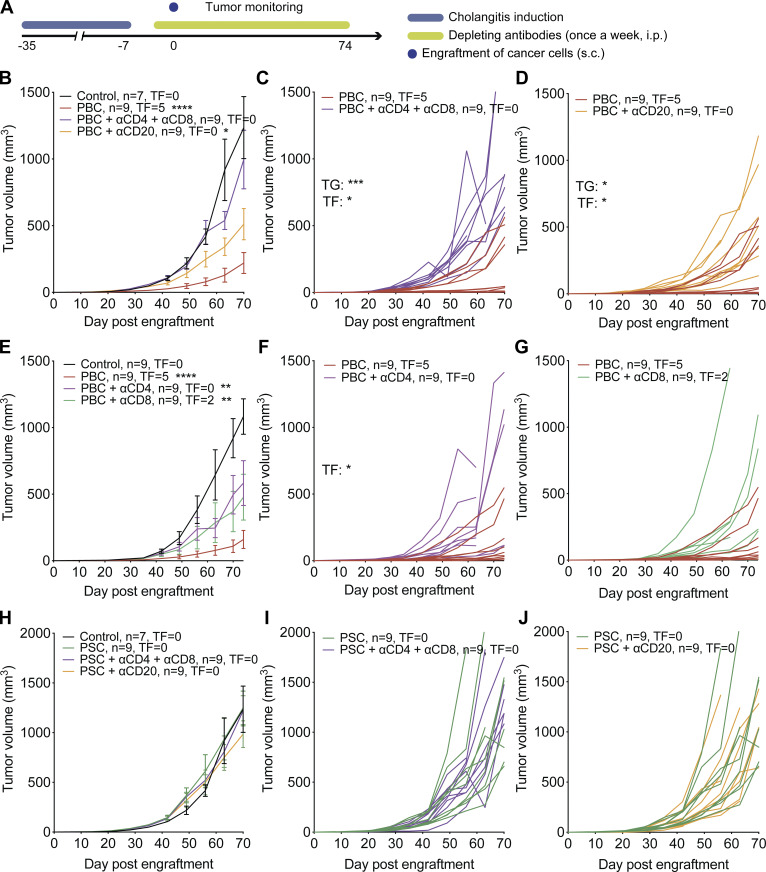
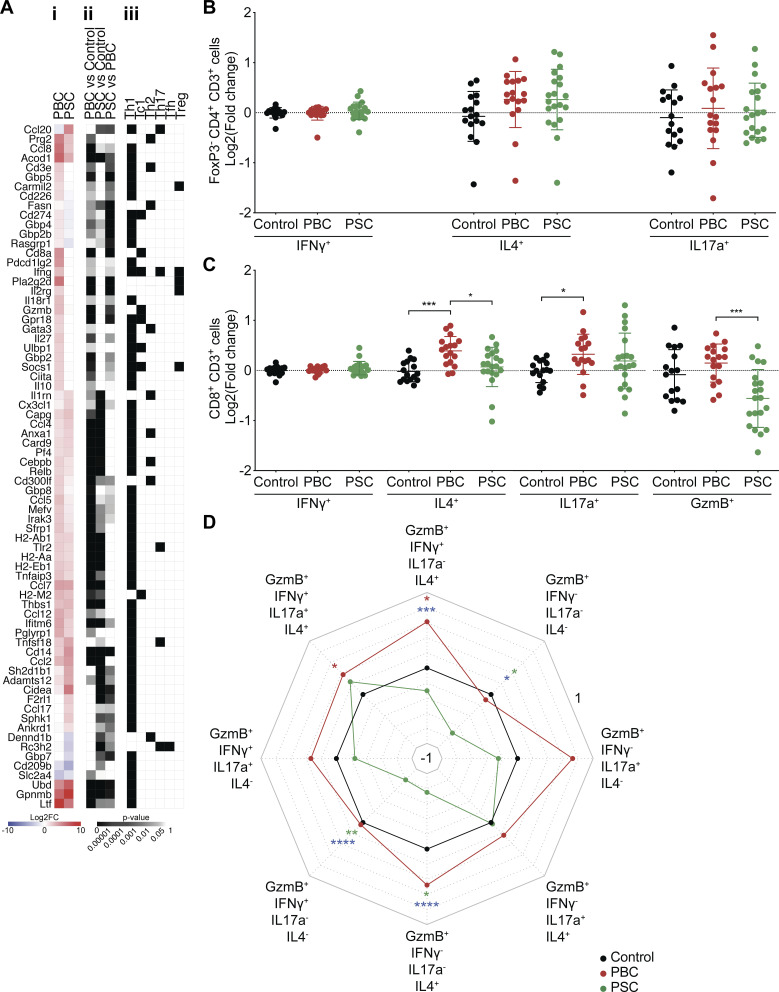
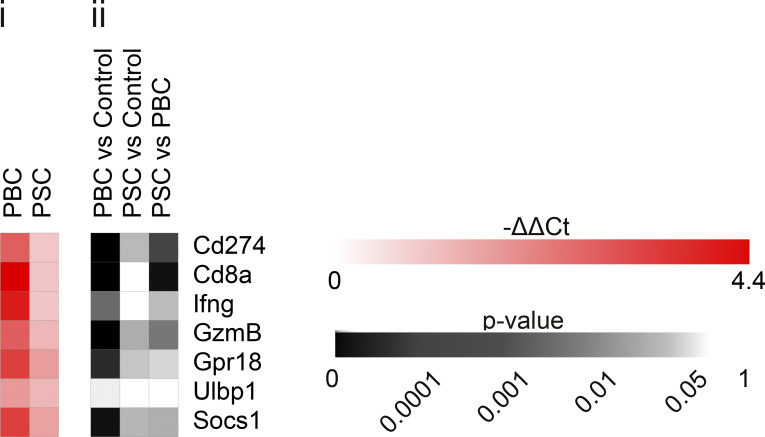
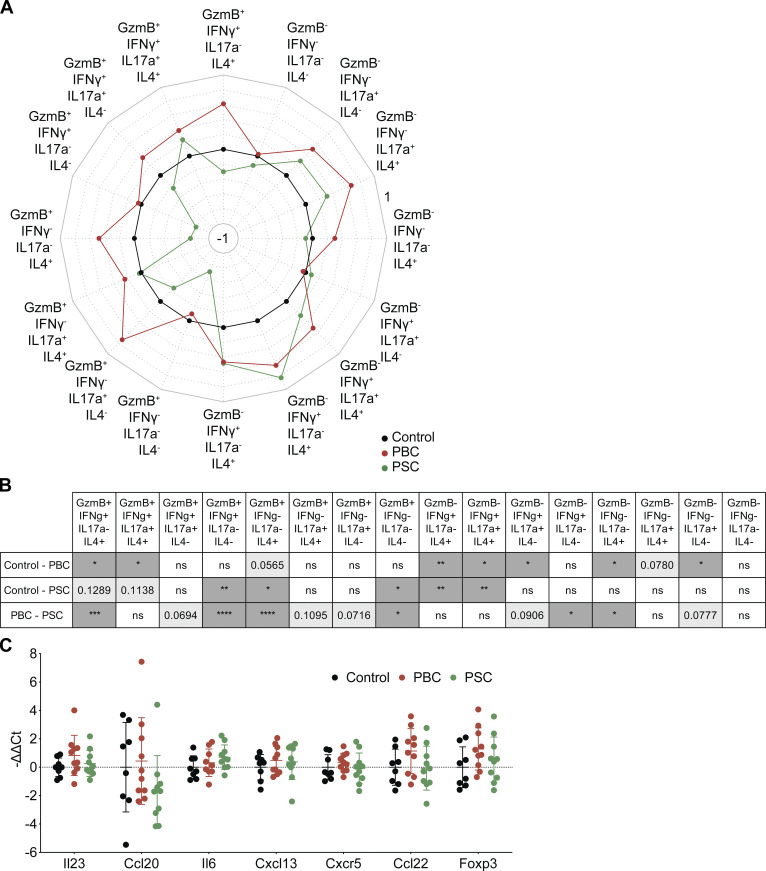
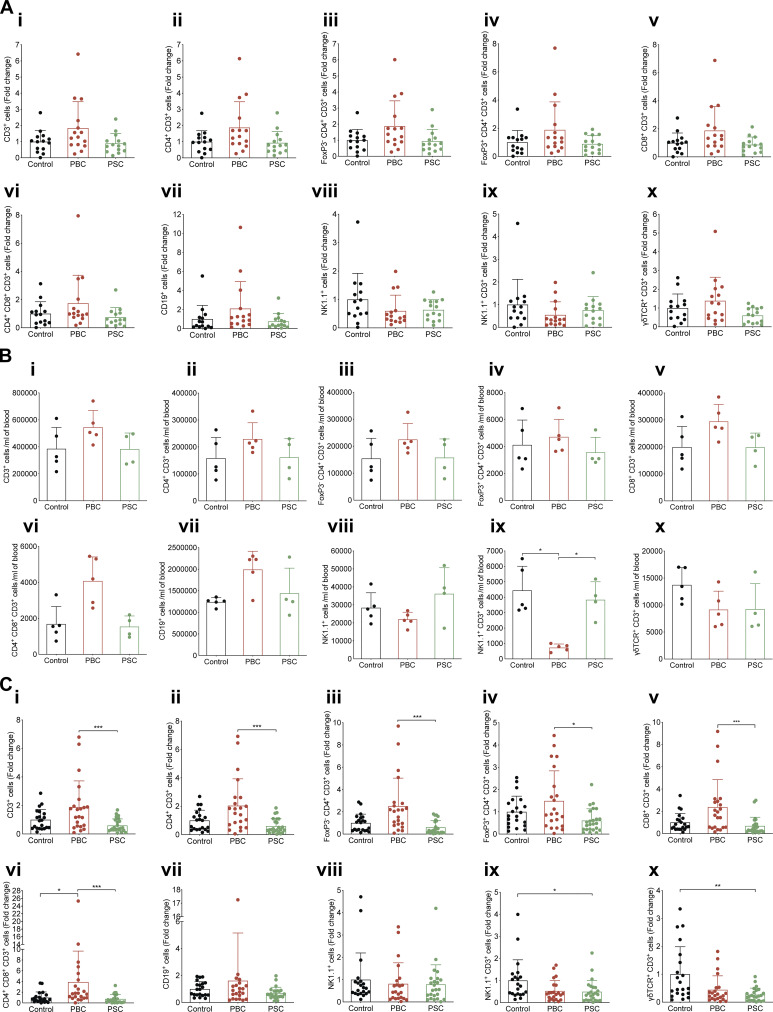
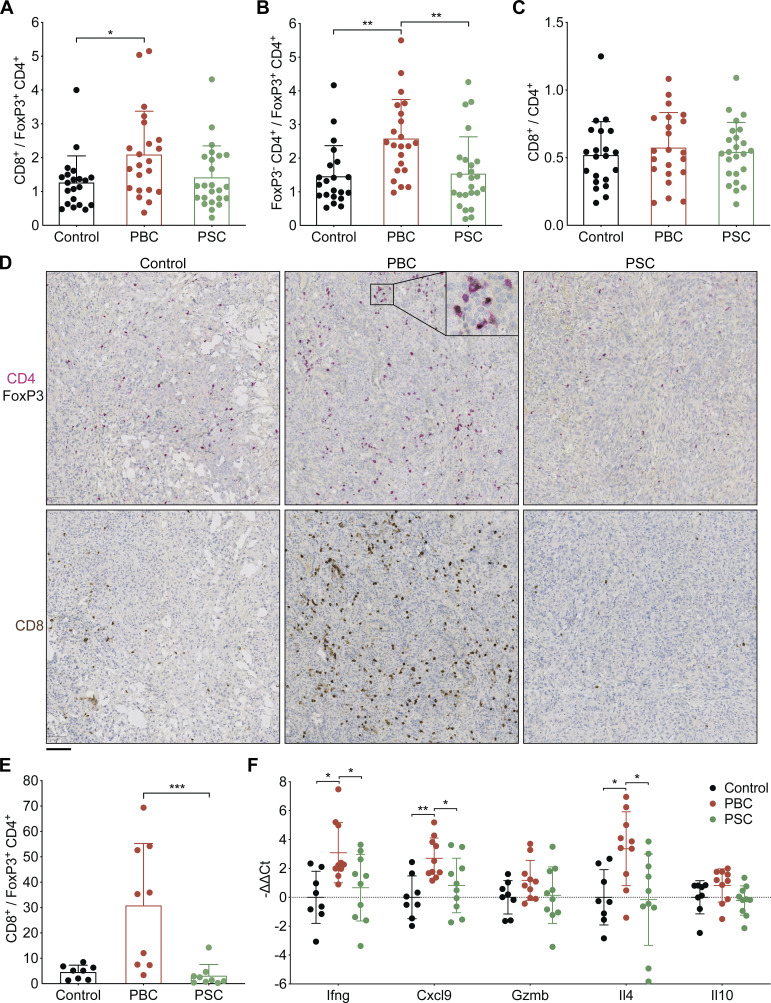
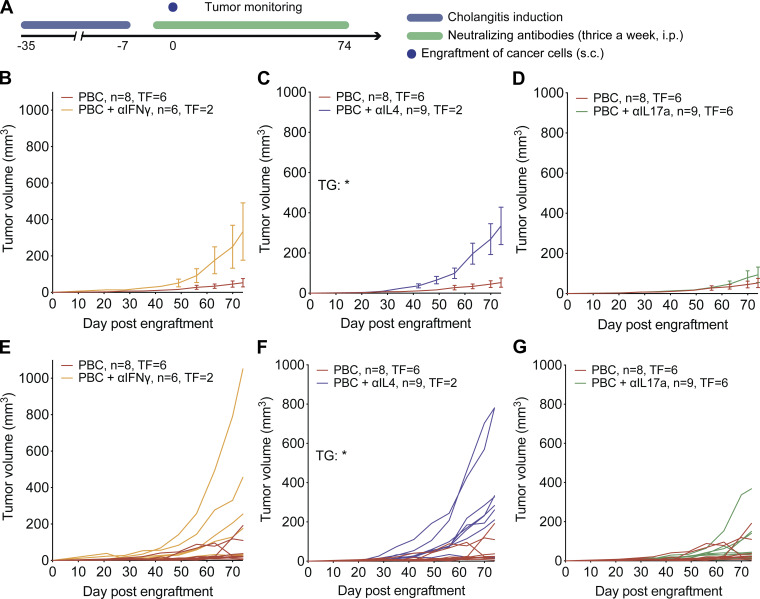
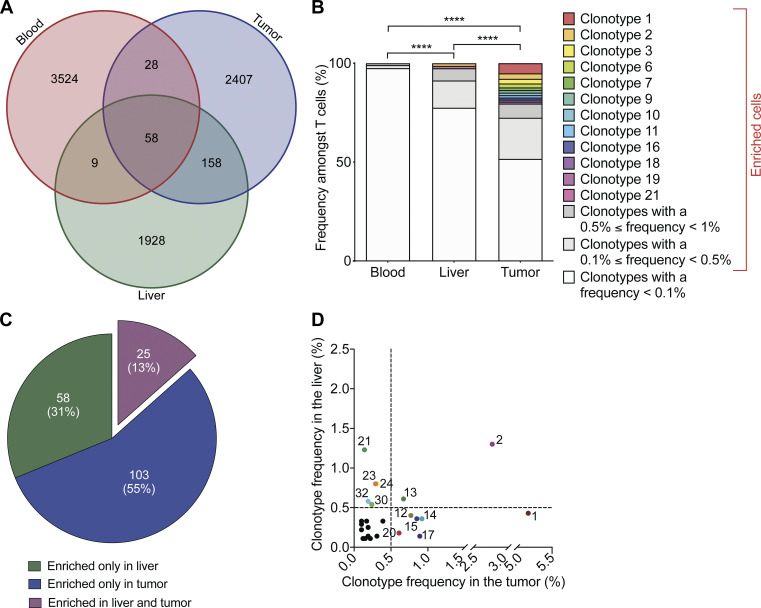
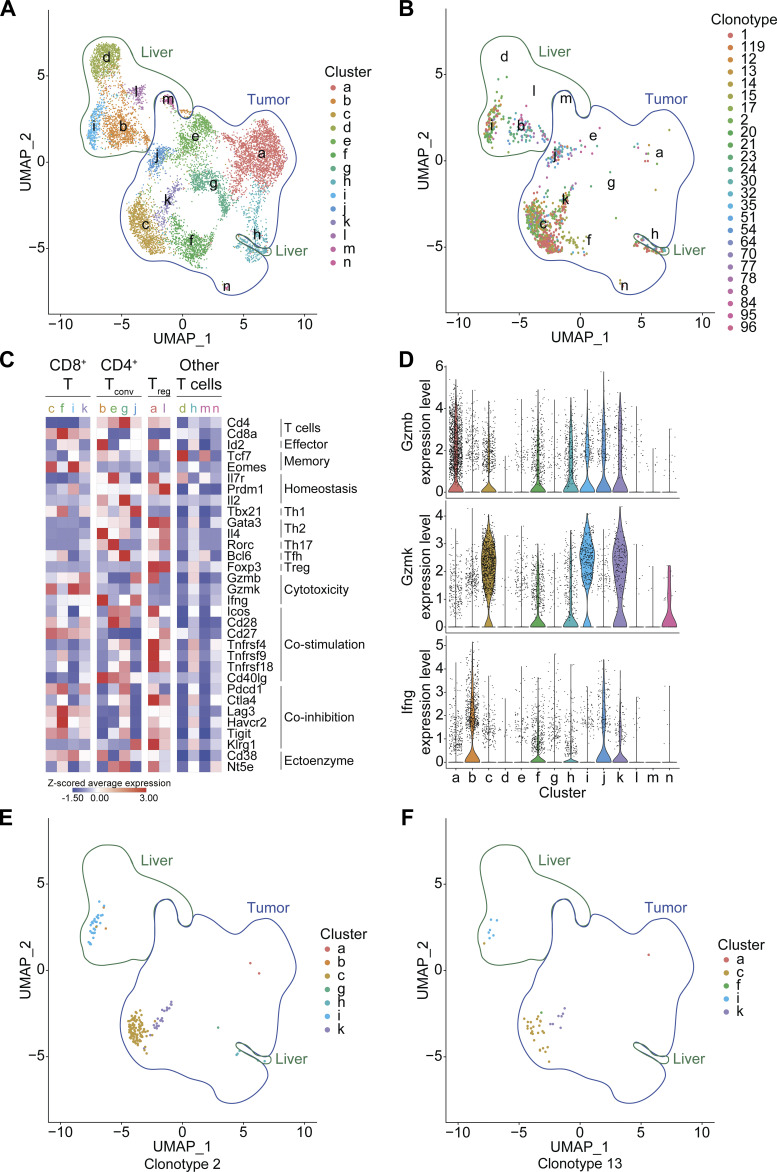
Cholangiocarcinoma (CCA) results from the malignant transformation of cholangiocytes. Primary sclerosing cholangitis (PSC) and primary biliary cholangitis (PBC) are chronic diseases in which cholangiocytes are primarily damaged. Although PSC is an inflammatory condition predisposing to CCA, CCA is almost never found in the autoimmune context of PBC. Here, we hypothesized that PBC might favor CCA immunosurveillance. In preclinical murine models of cholangitis challenged with syngeneic CCA, PBC (but not PSC) reduced the frequency of CCA development and delayed tumor growth kinetics. This PBC-related effect appeared specific to CCA as it was not observed against other cancers, including hepatocellular carcinoma. The protective effect of PBC was relying on type 1 and type 2 T cell responses and, to a lesser extent, on B cells. Single-cell TCR/RNA sequencing revealed the existence of TCR clonotypes shared between the liver and CCA tumor of a PBC host. Altogether, these results evidence a mechanistic overlapping between autoimmunity and cancer immunosurveillance in the biliary tract.


Conflict of interest statement

Disclosures: J. Tosello Boari reported personal fees from Egle Therapeutics and personal fees from Institut Curie outside the submitted work. L. Zitvogel reported "other" from everImmune, grants from Transgene, grants from Daichi Sankyo, and grants from Kaleido outside the submitted work. E. Piaggio reported personal fees from Egle Therapeutics outside the submitted work. G. Kroemer reported grants from Daiichi Sankyo, Eleor, Kaleido, Lytix Pharma, PharmaMar, Sotio, Vasculox/Tioma, Samsara Therapeutics, and Sanofi outside the submitted work; in addition, G. Kroemer is on the board of directors of the Bristol Myers Squibb Foundation France and is a scientific co-founder of everImmune, Samsara Therapeutics, and Therafast Bio. No other disclosures were reported.

Figures

None
Graphical abstract
Figure 1.
Figure 1.
Previously characterized mouse models of PBC and PSC cholangitis do recapitulate the main features of the corresponding human pathologies. (A) Experimental schedule of the induction of PBC in C57Bl/6 mice. Mice were injected at days 0 and 14 with 2OA-BSA (i.p.) plus α-GalCer (i.v.). At day 28, mice received one more dose of 2OA-BSA (i.p.). (B) Experimental schedule of the induction of PSC in C57Bl/6 mice. Mice were fed a diet containing 0.1% DCC for 2 wk. Then, after 1 wk of recovery on regular food, animals were fed again the DDC-supplemented diet during the fourth week. (C) Paraffin-embedded sections of PBC and PSC mouse livers at day 35 of cholangitis induction, stained with hematoxylin, eosin, and safran. #, bile duct; H, hepatic arteria; P, portal vein; 1, infiltrated leukocytes; 2, hyperplastic bile duct; 3, onion skin–like fibrosis; 4, ductular reaction. Porphyrin plugs (dark red) are observable in PSC liver section. Scale bars correspond to 100 µm. (D) Collagen proportionate area measured on Sirius red-stained sections of control, PBC, and PSC mouse livers harvested at day 35 of cholangitis induction. For each group, n = 6. (E) Relative ALT activity measured in the serum of control, PBC, and PSC mice at day 35 of cholangitis induction. For each group, n = 5. One representative experiment out of two is shown. (F) Relative level of total circulating IgG measured in control, PBC, and PSC mice at day 36. For each group, n = 12. One representative experiment out of two is shown. (G) Relative level of IgG and IgM specific to PDC-E2 measured in the serum of control, PBC, and PSC mice at day 35 of cholangitis induction. For control, PSC, and PBC groups, n = 9, 9, and 10 samples, respectively, pooled from two distinct experiments. (D–G) Graphs show individual and mean (±SD) values. P values were calculated by means of the Kruskal–Wallis H test with Dunn’s pairwise multiple comparisons. *, P < 0.05; **, P < 0.01; ***, P < 0.001.
Figure 2.
Figure 2.
Livers from mice with PBC and PSC feature distinct adaptive immune cell signatures. (A–F) Following the experimental schedules illustrated in Fig. 1, A and B, hepatic gene expression was studied by transcriptomic analysis (RNA-seq) in healthy control (n = 4), PBC (n = 3), and PSC (n = 3) mice at day 35. (A) Fold change (≥log2|2|) of the 866 significantly modulated genes in PBC and PSC livers relative to healthy controls. Refer to Data S1 for a detailed heatmap and to Table S1 for individual and mean expression values of each gene. (B) GO term enrichment analysis of the genes up-regulated in both PBC and PSC livers (of note, genes down-regulated were not associated with a specific GO term enrichment). The bar chart displays the enrichment score of significantly enriched GO terms with their FDR-adjusted P value. (C–F) Focus on genes whose expression is modulated in PBC and PSC livers compared with healthy controls and listed under the GO terms “inflammation” (C), “neutrophil” (D), “T cell” (E), and “B cell” (F). P values of the paired Student t test of the comparisons between PBC and PSC profiles are indicated. ***, P < 0.001; ****, P < 0.0001. FC, fold-change; FDR, false discovery rate.
Figure 3.
Figure 3.
PBC but not PSC mediates specific control of CCA outgrowth. (A) Experimental schedule in C57Bl/6 mice. 1 wk after the end of cholangitis induction (see Fig. 1, A and B), syngeneic cancer cells were engrafted through s.c. injection and tumor growth (TG) was followed up (B–D and H–J). Alternatively, mice received plasmids encoding the oncogenes NICD and constitutively active AKT by hydrodynamic injection in the tail vein, and their liver was collected 5 wk later (E–G). (B–D) Tumor growth of transplantable SB1-JP4 CCA tumors in control, PBC, and PSC mice. For control group, n = 7, and for PBC and PSC groups, n = 9. One representative experiment out of two is shown. (E and F) Photographic images of control (E) and PBC (F) mouse livers after NICD/AKT plasmid injection. Green arrows indicate some tumor nodules. Scale bars correspond to 1 cm. For control group, n = 9, and for PBC group, n = 10. (G) Rate of CCA incidence and number of tumor nodules per liver in control and PBC mice that received the oncogenes NICD and AKT. P values were calculated using a Fisher’s exact test or a Mann–Whitney U test for comparing the rate of CCA incidence and the number of tumor nodules, respectively. (H–J) Growth of transplantable HCC (H), NSCLC (I), and fibrosarcoma (J) tumors in control and PBC mice. (H) For control group, n = 5, and for PBC group, n = 7. (I) For each group, n = 5. (J) For each group, n = 4. Graphs show mean (±SEM; B and H–J) or individual (C and D) tumor growth curves. Individual curves of HCC, NSCLC, and fibrosarcoma growth are displayed in Fig. S1, D–F. Regarding the comparison of the tumor growth curves, tumor growth P values were calculated by means of a linear mixed-effects model in comparison to control group. Regarding the comparison of the rate of tumor-free (TF) mice, pairwise tumor-free P values were calculated with Fisher’s exact test in comparison to control group. *, P < 0.05; **, P < 0.01; ****, P < 0.0001. AKT, Protein kinase B; t.v., tail vein.
Figure S1.
Figure S1.
PBC but not PSC prevents specifically the outgrowth of ectopic CCA. (A–F) Following the experimental schedules illustrated in Fig. 1, A and B, syngeneic cancer cells were engrafted through s.c. injection 1 wk after the end of cholangitis induction, and tumor growth followed. (A) Weight of CCA tumors implanted in control, PBC, and PSC mice at day 56/60 after SB1-JP4 cell line engraftment. Graph shows mean (±SD) values. P values were calculated by means of the Kruskal–Wallis H test with Dunn’s pairwise multiple comparisons. For control, PBC, and PSC groups, n = 25, 24, and 26 tumors, respectively, pooled from three distinct experiments. (B–F) Growth of transplanted CCA SB1 (B and C), HCC (D), NSCLC (E), and fibrosarcoma (F) tumors in control and PBC mice. (B and C) For each group, n = 5. (D) For control and PBC groups, n = 5 and 7, respectively. (E) For each group, n = 5. (F) For each group, n = 4. Graphs show mean (±SEM) (B) or individual (C and D–F) tumor growth curves. For comparing the tumor growth (TG) curves or the rates of tumor-free (TF) mice, tumor growth and tumor-free P values were calculated by means of a linear mixed-effects model or Fisher’s exact test, respectively. *, P < 0.05; ****, P < 0.0001.
Figure 4.
Figure 4.
PBC-mediated protection against CCA relies on T lymphocytes. (A) Experimental schedule in C57Bl/6 mice. 1 wk after the end of cholangitis induction (see Fig. 1, A and B), mice were engrafted s.c. with syngeneic SB1-JP4 CCA cells (day 0). At days −2/−3 and +1, mice were injected i.p. with depleting antibodies targeting CD20, CD4, and/or CD8. These injections were repeated once a week. (B–J) Mean (±SEM; B, E, and H) or individual (C and D, F and G, I and J) growth curves of implanted SB1-JP4 CCA tumors in control, PBC, or PSC mice or PBC and PSC mice selectively depleted of CD4+ and/or CD8+ T lymphocytes or CD20+ B cells. (B–D) For control group, n = 7, and for PBC, or PBC + αCD4 + αCD8, or PBC + αCD20 groups, n = 9. One representative experiment out of two is shown. (E–G) For each group, n = 9. One representative experiment out of two is shown. (H–J) For control group, n = 7, and for PSC, or PSC + αCD4 + αCD8, or PSC + αCD20, n = 9. One representative experiment out of two is shown. Regarding the comparison of the tumor growth (TG) curves, tumor growth P values were calculated by means of a linear mixed-effects model in comparison to control group (B, E, and H), PBC group (C and D, F and G), or PSC group (I and J). Regarding the comparison of the rate of tumor-free (TF) mice, pairwise tumor-free P values were calculated with Fisher’s exact test on the incidence rate to control group (B, E, and H), PBC group (C and D, F and G), or PSC group (I and J). *, P < 0.05; **, P < 0.01; ***, P < 0.001; ****, P < 0.0001. Trend toward statistical significance was observed for the following comparison: tumor growth of PBC versus PBC+αCD4: P = 0.0544 (F).
Figure 5.
Figure 5.
T cell polarization in hepatic and tumor-draining lymphatic tissues during cholangitis. (A) Following the experimental schedules illustrated in Fig. 1, A and B, gene expression was studied by transcriptomic analysis (RNA-seq) in liver samples of healthy control (n = 4), PBC (n = 3), and PSC (n = 3) mice at day 35. List of genes significantly modulated between the liver of PBC, PSC, and control mice and tagged with GO terms affiliated to T cell polarization. (A, i) The heatmap shows the fold-change (≥log2|2|) of gene expression in PBC and PSC livers relative to healthy controls. Genes involved in Tc1 response and up-regulated in PBC mice versus healthy and PSC animals are written in bold. (A, ii) The P value of each pairwise comparison is illustrated. (A, iii) Affiliation of each gene to a T cell lineage based on its related GO terms referring to Th1, Tc1, Th2, Th17, Tfh, and/or T reg cell polarization. (B–D) Following the experimental schedule illustrated in Fig. 3 A, the tumor-draining lymph node of control, PBC, and PSC mice was collected at day 56 after CCA engraftment. Cytokine production by T lymphocytes was analyzed by flow cytometry after a 24-h restimulation with anti-CD3 and anti–CD28-coated beads. (B and C) Graphs show individual (dots) and mean (±SD) log2(FC) values of single cytokine production in control, PBC, and PSC mice relative to control mice, in conventional CD4+ (B) or CD8+ (C) T cells. P values were calculated following a Kruskal–Wallis H test with Dunn’s pairwise multiple comparisons. (D) Spider chart shows mean log2(FC) of the production of IFNγ, IL4, and/or IL17a by cytotoxic (GzmB+) lymphoid CD8+ T cells in control, PBC, and PSC mice relative to control mice. (B–D) For control, PBC, and PSC groups, n = 16, 17, and 20 samples, respectively, pooled from three distinct experiments. P values were calculated following a Kruskal–Wallis H test with Dunn’s pairwise multiple comparisons. Red, green, and blue P values relate to PBC versus control, PSC versus control, and PBC versus PSC comparisons, respectively. *, P < 0.05; **, P < 0.01; ***, P < 0.001; ****, P < 0.0001. Trend toward statistical significance was observed for the following comparisons: IL4+ cells in control versus PBC: P = 0.0510; control versus PSC: P = 0.1036 (B); GzmB+ cells in control versus PSC: P = 0.0782 (C); GzmB+ IFNγ+ IL17a+ IL4 cells in PBC versus PSC: P = 0.0694; GzmB+ IFNγ IL17a IL4+ cells in control versus PBC: P = 0.0565; and for GzmB+ IFNγ IL17a+ IL4 cells PBC versus PSC: P = 0.0716 (D). Polyfunctionality of noncytotoxic (GzmB) effector CD8+ T cells in the CCA-draining lymph node is included in Fig. S3 A and the corresponding P values in Fig. S3 B. FC, fold change.
Figure S2.
Figure S2.
Relative expression of some genes related to Tc1 immune response in the liver of mice affected with PBC and PSC. Following the experimental schedules illustrated in Fig. 1, A and B, livers from healthy control (n = 4), PBC (n = 3), and PSC (n = 3) mice were collected at day 35, and hepatic gene expression was studied by RT-qPCR. (i) The heatmap shows the expression of genes involved in cytotoxic T cell response in PBC and PSC livers relative to healthy controls. (ii) The corresponding P value of each pairwise comparison is illustrated and was calculated by means of one-way ANOVA with Tukey’s pairwise multiple comparisons. Cd274, programmed cell death 1 ligand 1; Gpr18, G protein-coupled receptor 18; Socs1, suppressor of cytokine signaling 1; Ulbp1, UL16 binding protein 1.
Figure S3.
Figure S3.
CD8+ T cell polyfunctionality within CCA tumor-draining lymph node during cholangitis. (A–C) Following the experimental schedule illustrated in Fig. 3 A, SB1-JP4 CCA tumors and their draining lymph nodes were collected from control, PBC, and PSC mice at day 56/60 after CCA engraftment. (A) Cytokine production by lymph node T lymphocytes was analyzed by flow cytometry after a 24-h restimulation with anti-CD3 and anti–CD28-coated beads. Spider chart shows mean log2(FC) of the CD8+ T cell production of IFNγ, IL4, IL17a, and/or GzmB in control, PBC, and PSC mice relative to control mice. For control, PBC, and PSC groups, n = 16, 17, and 20 samples, respectively, pooled from three distinct experiments. (B) Corresponding P values calculated by means of the Kruskal–Wallis H test with Dunn’s pairwise multiple comparisons. *, P < 0.05; **, P < 0.01; ***, P < 0.001; ****, P < 0.0001. (C) Expression of genes related to Th17/Tc17 (Il23, Ccl20, Il6), Tfh (Cxcl13, Cxcr5), and T reg cell (Ccl22, Foxp3) immune responses was measured by RT-qPCR within CCA tumors. For control, PBC, and PSC groups, n = 8, 10, and 10 samples, respectively, pooled from two distinct experiments. Graphs show individual and mean (±SD) relative expression values. P values were calculated by means of one-way ANOVA with Tukey’s pairwise multiple comparisons. Ccl20, C-C motif chemokine ligand 20; Ccl22, C-C motif chemokine ligand 22; Cxcl13, C-X-C motif chemokine ligand 13; Cxcr5, C-X-C motif chemokine receptor 5; FC, fold change; Foxp3, forkhead box P3.
Figure S4.
Figure S4.
Lymphocytic cell subsets across several tissues during cholangitis. (A–C) Following the experimental schedule illustrated in Fig. 3 A, tumor-draining lymph nodes (A), blood (B), and tumors (C) from control, PBC, and PSC mice were collected at day 56 after SB1-JP4 CCA engraftment for flow cytometric analysis of the lymphocytic cell subset content. Relative counts (A and C) and absolute counts (per milliliter of blood; B) of total T lymphocytes (i); total (ii), conventional (iii), or regulatory (iv) CD4+ T cell, CD8+ T cell (v), and CD4+ CD8+ double-positive T cell (vi) subsets; total B cells (vii), NK (viii), NKT (ix), and γδ T (x) lymphocytes. Graphs show individual and mean (±SD) values. (A) For control, PBC, and PSC groups, n = 14, 15, and 14 samples, respectively, pooled from two distinct experiments. (B) For control, PBC, and PSC groups, n = 5, 5, and 4 samples, respectively. (C) For control, PBC, and PSC groups, n = 21, 22, and 24 samples, respectively, pooled from three distinct experiments. P values were determined by the Kruskal–Wallis H test with Dunn’s pairwise multiple comparisons. *, P < 0.05; **, P < 0.01; ***, P < 0.001. Trend toward statistical significance was observed for the following comparisons: PBC versus PSC: P = 0.1187 (A, ii); PBC versus PSC: P = 0.1026 (A, iii); PBC versus PSC: P = 0.1271 (A, v); PBC versus PSC: P = 0.0968 (A, x); control versus PBC: P = 0.0573; PBC versus PSC: P = 0.0560 (B, vi); control versus PBC: P = 0.0852 (B, vii); control versus PSC: P = 0.0932 (C, i); control versus PBC: P = 0.0942 (C, iii); control versus PBC: P = 0.1031 (C, ix); control versus PBC: P = 0.0655 (C, x).
Figure 6.
Figure 6.
PBC affects T lymphocyte subsets infiltrating CCA tumors. (A–F) Following the experimental schedule illustrated in Fig. 3 A, SB1-JP4 CCA tumors were collected from control, PBC, and PSC mice at day 56/60 after CCA engraftment. T cell subsets were analyzed by flow cytometry (A–C) and immunohistochemistry (D and E), and the expression of T cell–associated effector and regulatory cytokines was measured by RT-qPCR (F). Ratios of either total CD8+ CD3+ T cells (A) or FoxP3 CD4+ CD3+ T cells (B) over FoxP3+ CD4+ CD3+ T reg cells, and of total CD8+ CD3+ T cells over total CD4+ CD3+ T cells (C) within CCA tumors. (A–C) For control, PBC, and PSC groups, n = 21, 22, and 24 samples, respectively, pooled from three distinct experiments. (D and E) PFA-fixed paraffin-embedded sections of implanted CCA tumors from control, PBC, and PSC mice were stained for CD4 (magenta), FoxP3 (black), or CD8 (brown) by immunohistochemistry (D), and the ratio of CCA-infiltrating CD8+ over FoxP3+ CD4+ cells was measured (E). (D) Scale bar corresponds to 100 µm. (E) For control, PBC, and PSC groups, n = 8, 9, and 9 samples, respectively, pooled from two experiments. (F) Relative expression of several genes encoding Th1/Tc1 (Ifng, Cxcl9, Gzmb) or Th2/Tc2 (Il4)-related effector or regulatory (Il10) molecules within CCA tumors. For control group, n = 8, and for PBC and PSC groups, n = 10 samples pooled from two experiments. Graphs show individual and mean (±SD) values. P values were calculated by means of the Kruskal–Wallis H test with Dunn’s pairwise multiple comparisons (A–C and E) or one-way ANOVA with Tukey’s pairwise multiple comparisons (F). *, P < 0.05; **, P < 0.01; ***, P < 0.001. Trend toward statistical significance was observed for the following comparisons: PBC versus PSC: P = 0.1218 (A); control versus PBC: P = 0.0646 (E); for Il10: PBC versus PSC: P = 0.1073 (F). PFA, paraformaldehyde.
Figure 7.
Figure 7.
PBC-mediated protection against CCA requires IFNγ and IL4 but not IL17a. (A) Experimental schedule in C57Bl/6 mice. 1 wk after the end of cholangitis induction (see experimental schedule in Fig. 1 A), syngeneic SB1-JP4 CCA cells were engrafted into PBC mice (day 0). At day −1, +1, and +3 and then thrice a week until the end of the experiment, mice were injected with antibodies targeting effector cytokines. (B–G) Growth of SB1-JP4 CCA tumors in control or PBC mice or PBC mice injected with antibodies neutralizing either IFNγ (B and E), IL4 (C and F), or IL17a (D and G). For PBC, PBC + αIFNγ, PBC + αIL4, and PBC + αIL17 groups, n = 8, 6, 9, and 9 tumors, respectively, from one representative experiment out of two. Graphs show mean ± SEM (B–D) and individual (E–G) tumor growth (TG) curves. For comparing tumor growth curves, tumor growth P values were calculated by means of a linear mixed-effects model. For comparing the rates of tumor-free (TF) animals, pairwise tumor-free P values were calculated with Fisher’s exact test. *, P < 0.05. Trend toward statistical significance was observed for the following comparisons: TG of PBC versus PBC+αIFNγ: P = 0.0513 (B and E); TF of PBC versus PBC+αIL4: P = 0.0567 (C and F).
Figure 8.
Figure 8.
Some T cell clonotypes enriched in PBC liver also infiltrate CCA lesion. (A–D) Following the experimental schedule illustrated in Fig. 3 A, SB1-JP4 CCA tumor, liver, and blood of a PBC mouse were collected at day 70 after CCA engraftment. T cells of the malignant, hepatic, and blood tissues were sorted out and underwent single-cell transcriptomic analysis (scRNA-seq). Output data were used not only for T cell gene expression profiling but also for TCR sequencing, thus allowing characterization of clonotype. (A) Venn diagram of the T cell clonotype overlap between tumor, liver, and blood. (B) Proportion of T cell clonotypes among total T cells analyzed in each tissue. Clonotypes with a frequency >0.1% were considered enriched. Pairwise P values were calculated using Fisher’s exact test on the percentage of enriched T cell clonotypes. ****, P < 0.0001. (C) Number of enriched T cell clonotypes expanded only in tumor (n = 103), or liver (n = 58), or in both tissues (n = 25). (D) Proportion in the liver versus CCA tumor of each of the 25 T cell clonotypes enriched and shared between both tissues.
Figure 9.
Figure 9.
Phenotype of the T cell clonotypes involved in PBC-elicited CCA immunosurveillance. (A–F) In silico analyses of scRNA-seq/scTCR-seq data revealed the phenotype of the 25 T cell clonotypes enriched in both liver and CCA tumor of a PBC mouse (Fig. 8 D). (A) Uniform manifold approximation and projection (UMAP) clustering projection of the total T lymphocytes sorted out from the tumoral and hepatic tissues of a PBC mouse. 14 phenotypic T cell clusters were detected (a–n). (B) UMAP clustering projection of the 25 T cell clonotypes enriched in both tumor and liver upon PBC. (C) Z-scored average expression of several genes associated with T cell function across the 14 clusters, consisting of four CD8+, four conventional (conv) CD4+, two regulatory (reg) CD4+, and four unassigned T cell clusters. (D) Violin plots displaying the expression level of Gzmb, Gzmk, and Ifng across the 14 clusters. (E and F) UMAP clustering projection of the T cell clonotypes #2 (E) and #13 (F) that were the most enriched in both CCA tumor and liver of the PBC mouse (Fig. 8 D).
Figure S5.
Figure S5.
Flow cytometry analyses. (A) Flow cytometry plots of peripheral blood cells from control mice or PBC mice injected with anti–CD4/CD8 or anti-CD20 to deplete either CD4+ and CD8+ T cells or B cells, respectively. Following the experimental schedule illustrated in Fig. 4 A, PBC mice were repeatedly injected with the depleting antibodies. After the fourth injection of antibodies, blood was drawn for quantification of CD4+ and CD8+ T (CD3+ CD4+ or CD3+ CD8+) and B (CD19+ B220+) lymphocytes. (B–E) Gating strategies following the use of the four panels of fluorescent antibodies: “Cytokine production by lymphocytes” (B); “T lymphocytes” (C); “NK and B lymphocytes” (D); and “Lymphocytic subsets” (E). FSC-A, forward scatter-A; SSC-A, side scatter-A.

References

    1. Akisawa, N., Maeda T., Tsuda K., Nishimori I., Morita M., Iwasaki S., Tomita A., Saibara T., Onishi S., Kiyoku Y., and Enzan H.. 1998. Primary biliary cirrhosis associated with cholangiocarcinoma. Dig. Dis. Sci. 43:2138–2142. 10.1023/A:1018831903371 - DOI - PubMed
    1. Bae, H.R., Leung P.S., Tsuneyama K., Valencia J.C., Hodge D.L., Kim S., Back T., Karwan M., Merchant A.S., Baba N., et al. . 2016. Chronic expression of interferon-gamma leads to murine autoimmune cholangitis with a female predominance. Hepatology. 64:1189–1201. 10.1002/hep.28641 - DOI - PMC - PubMed
    1. Banales, J.M., Huebert R.C., Karlsen T., Strazzabosco M., LaRusso N.F., and Gores G.J.. 2019. Cholangiocyte pathobiology. Nat. Rev. Gastroenterol. Hepatol. 16:269–281. 10.1038/s41575-019-0125-y - DOI - PMC - PubMed
    1. Banales, J.M., Marin J.J.G., Lamarca A., Rodrigues P.M., Khan S.A., Roberts L.R., Cardinale V., Carpino G., Andersen J.B., Braconi C., et al. . 2020. Cholangiocarcinoma 2020: the next horizon in mechanisms and management. Nat. Rev. Gastroenterol. Hepatol. 17:557–588. 10.1038/s41575-020-0310-z - DOI - PMC - PubMed
    1. Blechacz, B., and Gores G.J.. 2008. Cholangiocarcinoma: advances in pathogenesis, diagnosis, and treatment. Hepatology. 48:308–321. 10.1002/hep.22310 - DOI - PMC - PubMed

Publication types

MeSH terms

Grants and funding