

Pathogenic T Cells in Celiac Disease Change Phenotype on Gluten Challenge: Implications for T-Cell-Directed Therapies
- PMID: 34495570
- PMCID: PMC8564461
- DOI: 10.1002/advs.202102778
Pathogenic T Cells in Celiac Disease Change Phenotype on Gluten Challenge: Implications for T-Cell-Directed Therapies
Erratum in
-
Pathogenic T Cells in Celiac Disease Change Phenotype on Gluten Challenge: Implications for T-Cell-Directed Therapies.Adv Sci (Weinh). 2022 Dec;9(34):e2205912. doi: 10.1002/advs.202205912. Adv Sci (Weinh). 2022. PMID: 36482157 Free PMC article. No abstract available.
Abstract
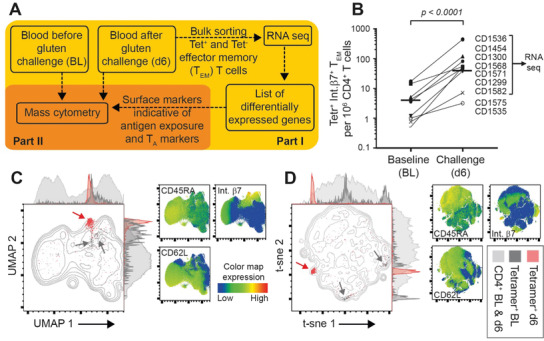
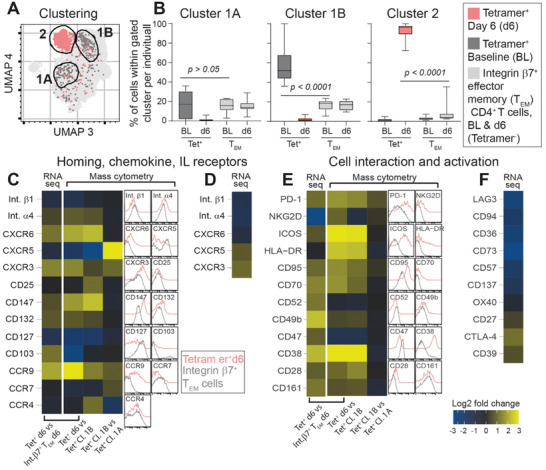
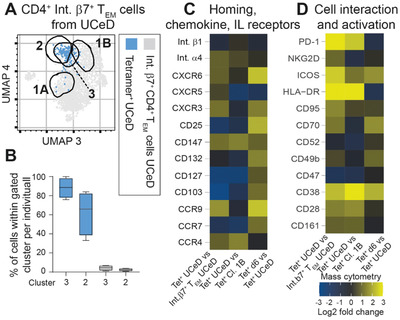
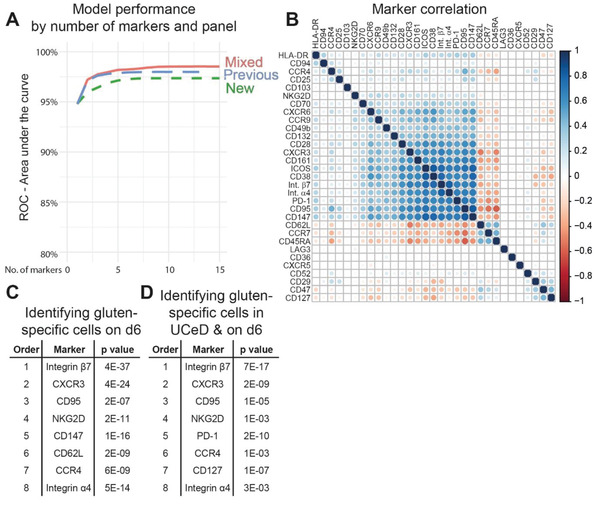
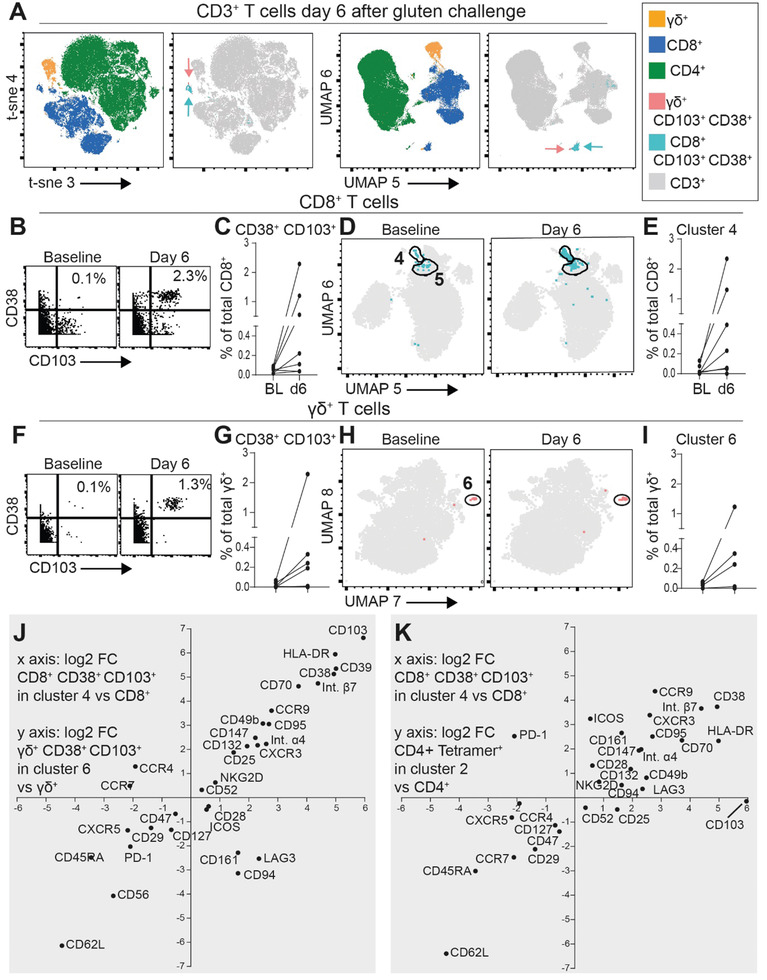
Gluten-specific CD4+ T cells being drivers of celiac disease (CeD) are obvious targets for immunotherapy. Little is known about how cell markers harnessed for T-cell-directed therapy can change with time and upon activation in CeD and other autoimmune conditions. In-depth characterization of gluten-specific CD4+ T cells and CeD-associated (CD38+ and CD103+ ) CD8+ and γδ+ T cells in blood of treated CeD patients undergoing a 3 day gluten challenge is reported. The phenotypic profile of gluten-specific cells changes profoundly with gluten exposure and the cells adopt the profile of gluten-specific cells in untreated disease (CD147+ , CD70+ , programmed cell death protein 1 (PD-1)+ , inducible T-cell costimulator (ICOS)+ , CD28+ , CD95+ , CD38+ , and CD161+ ), yet with some markers being unique for day 6 cells (C-X-C chemokine receptor type 6 (CXCR6), CD132, and CD147) and with integrin α4β7, C-C motif chemokine receptor 9 (CCR9), and CXCR3 being expressed stably at baseline and day 6. Among gluten-specific CD4+ T cells, 52% are CXCR5+ at baseline, perhaps indicative of germinal-center reactions, while on day 6 all are CXCR5- . Strikingly, the phenotypic profile of gluten-specific CD4+ T cells on day 6 largely overlaps with that of CeD-associated (CD38+ and CD103+ ) CD8+ and γδ+ T cells. The antigen-induced shift in phenotype of CD4+ T cells being shared with other disease-associated T cells is relevant for development of T-cell-directed therapies.
Keywords: RNA-Seq; T cells; celiac disease; gluten challenge; mass cytometry.
© 2021 The Authors. Advanced Science published by Wiley-VCH GmbH.
Conflict of interest statement
The authors declare no conflict of interest.
Figures
Similar articles
-
Circulating CD103+ γδ and CD8+ T cells are clonally shared with tissue-resident intraepithelial lymphocytes in celiac disease.Mucosal Immunol. 2021 Jul;14(4):842-851. doi: 10.1038/s41385-021-00385-8. Epub 2021 Mar 2. Mucosal Immunol. 2021. PMID: 33654213
-
Gluten-Free Diet Induces Rapid Changes in Phenotype and Survival Properties of Gluten-Specific T Cells in Celiac Disease.Gastroenterology. 2024 Jul;167(2):250-263. doi: 10.1053/j.gastro.2024.03.027. Epub 2024 Mar 28. Gastroenterology. 2024. PMID: 38552723
-
CD38 expression on gluten-specific T cells is a robust marker of gluten re-exposure in coeliac disease.United European Gastroenterol J. 2019 Dec;7(10):1337-1344. doi: 10.1177/2050640619874183. Epub 2019 Sep 7. United European Gastroenterol J. 2019. PMID: 31839959 Free PMC article.
-
Therapeutic and Diagnostic Implications of T Cell Scarring in Celiac Disease and Beyond.Trends Mol Med. 2019 Oct;25(10):836-852. doi: 10.1016/j.molmed.2019.05.009. Epub 2019 Jul 19. Trends Mol Med. 2019. PMID: 31331739 Review.
-
Tolerance-inducing therapies in coeliac disease - mechanisms, progress and future directions.Nat Rev Gastroenterol Hepatol. 2024 May;21(5):335-347. doi: 10.1038/s41575-024-00895-3. Epub 2024 Feb 9. Nat Rev Gastroenterol Hepatol. 2024. PMID: 38336920 Review.
Cited by
-
Role of Regulatory T Cells and Transglutaminase 2 Inhibitors in Celiac Disease: A Systematic Review.Cureus. 2025 May 27;17(5):e84901. doi: 10.7759/cureus.84901. eCollection 2025 May. Cureus. 2025. PMID: 40575215 Free PMC article. Review.
-
Gluten induces rapid reprogramming of natural memory αβ and γδ intraepithelial T cells to induce cytotoxicity in celiac disease.Sci Immunol. 2023 Jul 21;8(85):eadf4312. doi: 10.1126/sciimmunol.adf4312. Epub 2023 Jul 14. Sci Immunol. 2023. PMID: 37450575 Free PMC article.
-
Emerging Pharmaceutical Therapies to Address the Inadequacy of a Gluten-Free Diet for Celiac Disease.Pharmaceuticals (Basel). 2023 Dec 20;17(1):4. doi: 10.3390/ph17010004. Pharmaceuticals (Basel). 2023. PMID: 38275990 Free PMC article. Review.
-
Phenotype-Based Isolation of Antigen-Specific CD4+ T Cells in Autoimmunity: A Study of Celiac Disease.Adv Sci (Weinh). 2022 Apr;9(10):e2104766. doi: 10.1002/advs.202104766. Epub 2022 Feb 4. Adv Sci (Weinh). 2022. PMID: 35119226 Free PMC article.
-
Inflammatory Myopathies and Autoimmune Gluten-related Disorders: A Scoping Review of Pathophysiological Interconnections and Hypothesis.Recent Adv Inflamm Allergy Drug Discov. 2025;19(2):221-235. doi: 10.2174/0127722708317244240919113305. Recent Adv Inflamm Allergy Drug Discov. 2025. PMID: 39665304 Free PMC article.
References
-
- Lindfors K., Ciacci C., Kurppa K., Lundin K. E. A., Makharia G. K., Mearin M. L., Murray J. A., Verdu E. F., Kaukinen K., Nat. Rev. Dis. Primers 2019, 5, 3. - PubMed
-
- Sollid L. M., Immunogenetics 2017, 69, 605. - PubMed
-
- Anderson R. P., Degano P., Godkin A. J., Jewell D. P., Hill A. V., Nat. Med. 2000, 6, 337. - PubMed
Publication types
MeSH terms
Substances
Grants and funding
LinkOut - more resources
Full Text Sources
Medical
Research Materials