. 2021 Sep 8;19(9):e3001385.
doi: 10.1371/journal.pbio.3001385. eCollection 2021 Sep.

The induction of preterm labor in rhesus macaques is determined by the strength of immune response to intrauterine infection

Affiliations

The induction of preterm labor in rhesus macaques is determined by the strength of immune response to intrauterine infection

Monica Cappelletti et al. PLoS Biol. .

Abstract

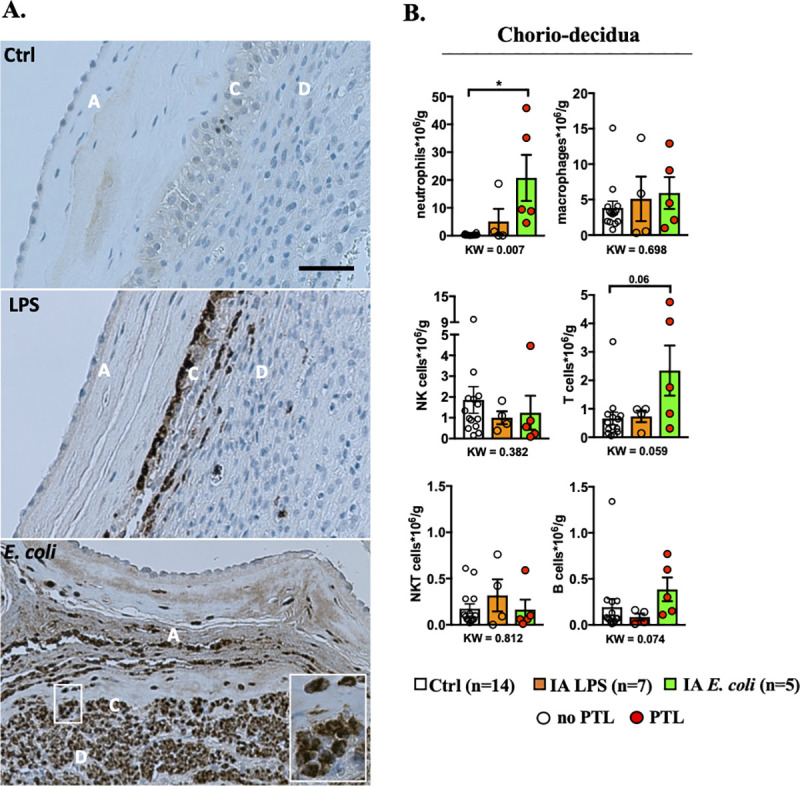
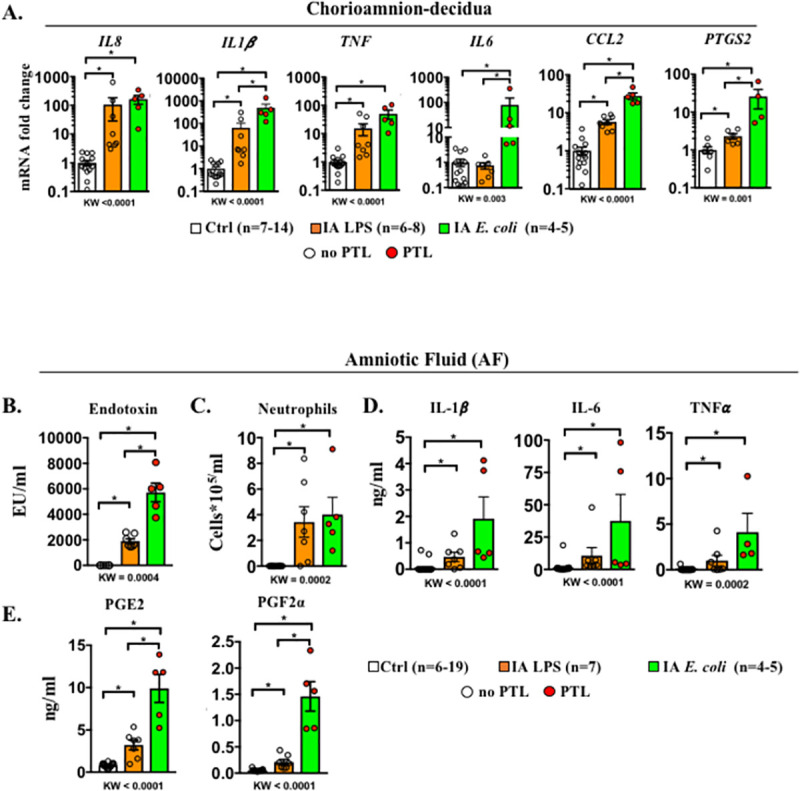
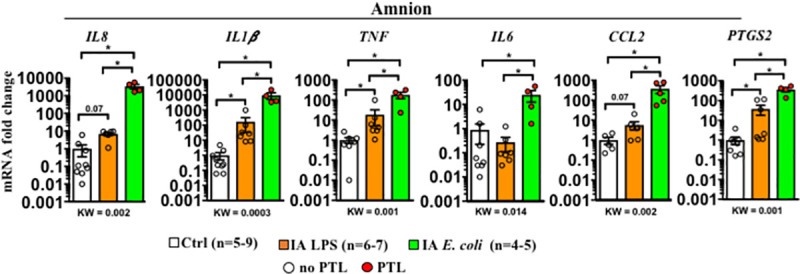
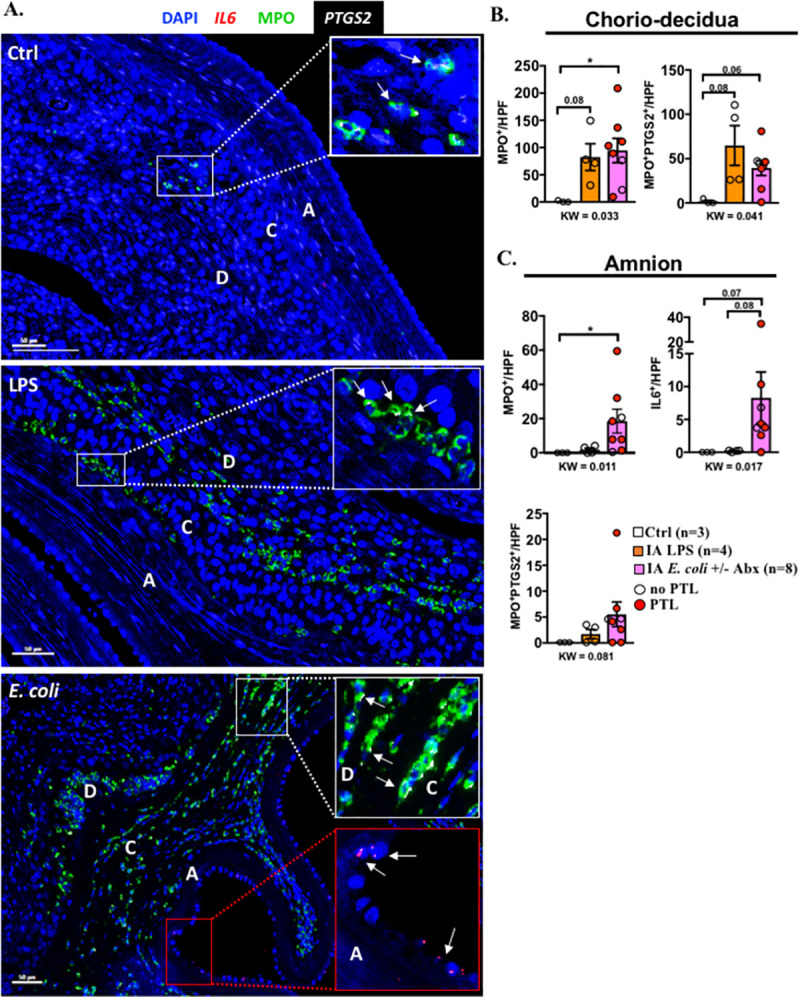
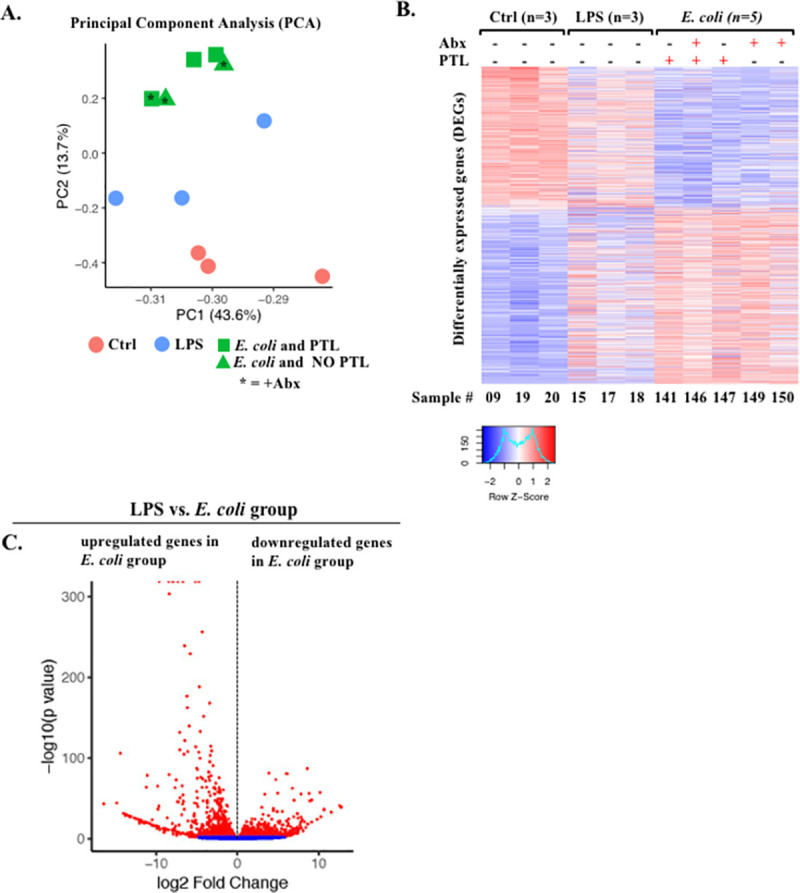
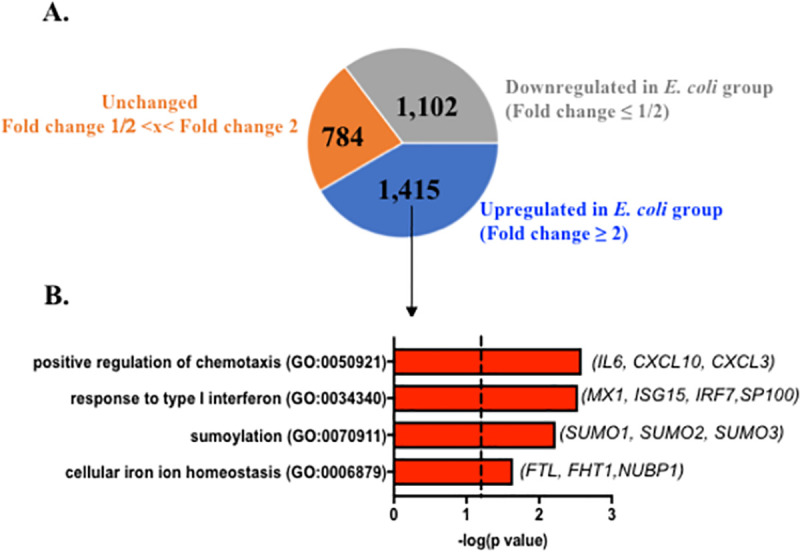
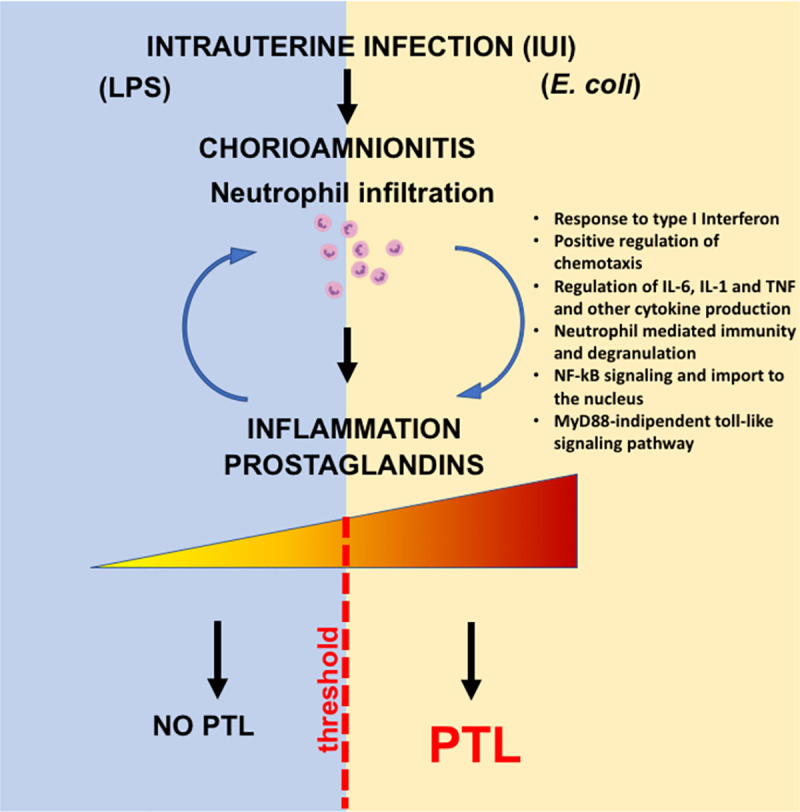
Intrauterine infection/inflammation (IUI) is a major contributor to preterm labor (PTL). However, IUI does not invariably cause PTL. We hypothesized that quantitative and qualitative differences in immune response exist in subjects with or without PTL. To define the triggers for PTL, we developed rhesus macaque models of IUI driven by lipopolysaccharide (LPS) or live Escherichia coli. PTL did not occur in LPS challenged rhesus macaques, while E. coli-infected animals frequently delivered preterm. Although LPS and live E. coli both caused immune cell infiltration, E. coli-infected animals showed higher levels of inflammatory mediators, particularly interleukin 6 (IL-6) and prostaglandins, in the chorioamnion-decidua and amniotic fluid (AF). Neutrophil infiltration in the chorio-decidua was a common feature to both LPS and E. coli. However, neutrophilic infiltration and IL6 and PTGS2 expression in the amnion was specifically induced by live E. coli. RNA sequencing (RNA-seq) analysis of fetal membranes revealed that specific pathways involved in augmentation of inflammation including type I interferon (IFN) response, chemotaxis, sumoylation, and iron homeostasis were up-regulated in the E. coli group compared to the LPS group. Our data suggest that the intensity of the host immune response to IUI may determine susceptibility to PTL.


Conflict of interest statement

The authors have declared that no competing interests exist.

Figures

Fig 1
Fig 1. Increased neutrophil infiltration in chorio-decidua upon IA LPS or E. coli exposure.
(A) One representative MPO staining of 4/group showing neutrophil infiltration in fetal membranes after LPS or live E. coli exposure but not in controls (amnion A, chorion C, and decidua D). Note that the LPS induced accumulation of neutrophils at the chorio-decidua junction but not in the amnion. IA E. coli injection induced neutrophil infiltration in the amnion in addition to the chorio-decidua (scale bar: 50 μm). (B) Chorio-decidua cell suspensions were analyzed by multiparameter flow cytometry and the different leukocyte populations were defined as indicated in S3 Fig. IA E. coli exposure increased significantly the count of chorio-decidua neutrophils that represent the major immune cell population. A slight but not significant increase in count of T cells with no changes for macrophages, NK cells and B cells compared to the control animals is observed. Cell count is expressed per gram of tissue. Red circles denote animals with PTL, while clear circles denote animals without PTL. Data are mean, SEM. A p-value for 3 group comparison by KW nonparametric test is shown in each panel, with post hoc analysis by DSCF method showing *p < 0.05 between comparators. See S1 Data for numerical values. DSCF, Dwass–Steel–Critchlow–Fligner; IA, intra-amniotic; KW, Kruskal–Wallis; LPS, lipopolysaccharide; MPO, myeloperoxidase; NK, natural killer; PTL, preterm labor.
Fig 2
Fig 2. Higher inflammation in the chorioamnion-decidua and in the AF by live E. coli compared to LPS.
(A) Chorioamnion-decidua inflammatory cytokine mRNAs in different rhesus IUI models were measured by qPCR. Average mRNA values are fold increases over the average value for the control group after internally normalizing to the housekeeping 18S RNA. AF levels of (B) endotoxin levels measured by limulus lysate assay, (C) neutrophil differential counts on cytospins, (D) inflammatory cytokines, and (E) prostaglandins. Compared to IA LPS exposure, IA E. coli exposure induced a higher expression of IL1β, IL6, CCL2, and PTGS2 mRNAs in the chorioamnion-decidua, higher AF endotoxin levels, and higher prostaglandin levels in the AF. Data are mean, SEM. A p-value for 3 group comparison by KW nonparametric test is shown in each panel, with post hoc analysis by DSCF method showing *p < 0.05 between comparators. In the E. coli group (green bar), red circles denote animals with PTL, while clear circles denote animals without PTL. See S1 Data for numerical values. AF, amniotic fluid; DSCF, Dwass–Steel–Critchlow–Fligner; IA, intra-amniotic; IL-1β, interleukin 1 beta; IL-6, interleukin 6; IUI, intrauterine infection/inflammation; KW, Kruskal–Wallis; LPS, lipopolysaccharide; PTL, preterm labor; qPCR, quantitative polymerase chain reaction; TNFα, tumor necrosis factor alpha.
Fig 3
Fig 3. Higher inflammation in the amnion by live E. coli compared to LPS.
Inflammatory cytokine mRNAs in different rhesus IUI models were measured in surgically isolated amnion tissue by qPCR. Average mRNA values are fold increases over the average value for the control group after internally normalizing to the housekeeping 18S RNA. Data are mean, SEM. A p-value for 3 group comparison by KW nonparametric test is shown in each panel, with post hoc analysis by DSCF method showing *p < 0.05 between comparators. Red circles denote animals with PTL, while clear circles denote animals without PTL. See S1 Data for numerical values. DSCF, Dwass–Steel–Critchlow–Fligner; IA, intra-amniotic; IUI, intrauterine infection/inflammation; KW, Kruskal–Wallis; LPS, lipopolysaccharide; PTL, preterm labor; qPCR, quantitative polymerase chain reaction.
Fig 4
Fig 4. Abx treatment did not decrease E. coli–induced inflammation.
The comparison groups are IA E. coli without Abx (green bar) and IA E. coli with Abx (blue bar). Red circles denote animals with PTL, while clear circles denote animals without PTL. Values were expressed as fold change value for the IA saline control group. Comparison of (A) chorio-amnion decidua neutrophil frequency and IL6 mRNA, (B) amnion IL6 mRNA, and (C) AF IL6 and PGE2. Dashed line represents the mean value of ctrl animals. Data are mean, SEM. Wilcoxon test (W) comparing the 2 groups was applied, and p-values are shown under each panel. See S1 Data for numerical values. Abx, antibiotics; AF, amniotic fluid; IA, intra-amniotic; IL-6, interleukin 6; PGE2, prostaglandin E2; PTL, preterm labor.
Fig 5
Fig 5. Cellular localization of IL6 and PTGS2 in the fetal membranes.
(A) Representative multiplex fluorescence detection of IL6 and PTGS2 mRNA identified by RNAscope in situ hybridization and MPO colocalization by immunofluorescence. IL6 is shown in red, PTGS2 in white, and MPO in green. DAPI indicates nuclear staining (blue) in all images. A = amnion, C = chorion, and D = decidua. White arrows in the white insets indicate colocalization of MPO (green) and PTGS2 (white) in the chorio-decidua. White arrows in the red inset indicate IL6+ epithelial and mesenchymal cells (red) in the amnion. Quantification of the cells expressing different markers in the (B) chorio-decidua and (C) amnion. Average of 5 randomly selected HPF fields were plotted as the representative value for the animal. Counts were performed in a blinded manner. Red circles denote animals with PTL, while clear circles denote animals without PTL. Data are mean, SEM. A p-value for 3 group comparison by KW nonparametric test is shown in each panel, with post hoc analysis by DSCF method showing *p < 0.05 or a borderline p-value between comparators. See S1 Data for numerical values. Abx, antibiotics; DSCF, Dwass–Steel–Critchlow–Fligner; HPF, high-power field; IA, intra-amniotic; LPS, lipopolysaccharide; KW, Kruskal–Wallis; MPO, myeloperoxidase; PTL, preterm labor.
Fig 6
Fig 6. Comparative transcriptomics in chorioamnion-decidua between IA LPS and E. coli exposure.
(A) PCA of RNA-seq data from chorioamnion-decidua tissue showing different segregation of transcriptomic profile based on exposures. (B) Heatmap of genes that are differentially expressed in chorioamnion-decidua cells upon different treatments showing the minimal interanimal variability within each group. (C) Volcano plot displaying DEGs from E. coli animals compared with LPS animals. Red dots indicate genes with FDR adjusted p-value <0.05. Abx, antibiotics; DEG, differentially expressed gene; FDR, false discovery rate; IA, intra-amniotic; LPS, lipopolysaccharide; PCA, principal component analysis; PTL, preterm labor; RNA-seq, RNA sequencing.
Fig 7
Fig 7. Up-regulated biological processes (GO terms) in chorioamnion-decidua by live E. coli.
(A) Pie chart displaying DEGs up-regulated (fold change ≥2), unchanged (fold change 1/2< x < fold change 2), and down-regulated in E. coli (fold change ≤1/2) with FDR adjusted p-value <0.05 compared to LPS. (B) Biological processes significantly up-regulated in chorioamnion-decidua of E. coli treated animals compared to LPS exposure. Representative genes of the biological processes are shown in parenthesis. DEG, differentially expressed gene; GO, gene ontology; FDR, false discovery rate; LPS, lipopolysaccharide.
Fig 8
Fig 8. Working model: IUI is a major risk factor for PTL.
Chorioamnionitis is the hallmark feature of IUI and is typically characterized by the infiltration of neutrophils into the fetal membranes. Evidence suggests that the extent of bacterial colonization, route of infection, and the stimulatory capacity of the bacteria all play key roles in the activation of pro-inflammatory signaling cascades that induce production of pro-inflammatory cytokines (e.g., IL-6) and chemokines (e.g., CCL2). The intensity of immune response is a key player for the outcome of the pregnancy, which, in turn, promote prostaglandin production leading to PTL. IL-1, interleukin 1; IL-6, interleukin 6; IUI, intrauterine infection/inflammation; NF-kB, nuclear factor kappa B; PTL, preterm labor; TNF, tumor necrosis factor.

Similar articles

Cited by

References

    1. Goldenberg RL, Culhane JF, Iams JD, Romero R. Epidemiology and causes of preterm birth. Lancet. 2008;371(9606):75–84. doi: 10.1016/S0140-6736(08)60074-4 - DOI - PMC - PubMed
    1. Romero R, Dey SK, Fisher SJ. Preterm labor: one syndrome, many causes. Science. 2014;345(6198):760–5. doi: 10.1126/science.1251816 - DOI - PMC - PubMed
    1. Combs CA, Gravett M, Garite TJ, Hickok DE, Lapidus J, Porreco R, et al.. Amniotic fluid infection, inflammation, and colonization in preterm labor with intact membranes. Am J Obstet Gynecol. 2014;210(2):125 e1–e15. - PubMed
    1. Martin JA, Hamilton BE, Osterman MJ, Driscoll AK, Drake P. Births: Final Data for 2016. Natl Vital Stat Rep. 2018;67(1):1–54. - PubMed
    1. Kallapur SG, Presicce P, Rueda CM, Jobe AH, Chougnet CA. Fetal immune response to chorioamnionitis. Semin Reprod Med. 2014;32(1):56–67. doi: 10.1055/s-0033-1361823 - DOI - PMC - PubMed

Publication types

Substances