. 2021 Sep 8;15(9):e0009094.
doi: 10.1371/journal.pntd.0009094. eCollection 2021 Sep.

PIWI silencing mechanism involving the retrotransposon nimbus orchestrates resistance to infection with Schistosoma mansoni in the snail vector, Biomphalaria glabrata

Affiliations

PIWI silencing mechanism involving the retrotransposon nimbus orchestrates resistance to infection with Schistosoma mansoni in the snail vector, Biomphalaria glabrata

Michael Smith et al. PLoS Negl Trop Dis. .

Abstract

Background: Schistosomiasis remains widespread in many regions despite efforts at its elimination. By examining changes in the transcriptome at the host-pathogen interface in the snail Biomphalaria glabrata and the blood fluke Schistosoma mansoni, we previously demonstrated that an early stress response in juvenile snails, manifested by induction of heat shock protein 70 (Hsp 70) and Hsp 90 and of the reverse transcriptase (RT) domain of the B. glabrata non-LTR- retrotransposon, nimbus, were critical for B. glabrata susceptibility to S. mansoni. Subsequently, juvenile B. glabrata BS-90 snails, resistant to S. mansoni at 25°C become susceptible by the F2 generation when maintained at 32°C, indicating an epigenetic response.

Methodology/principal findings: To better understand this plasticity in susceptibility of the BS-90 snail, mRNA sequences were examined from S. mansoni exposed juvenile BS-90 snails cultured either at 25°C (non-permissive temperature) or 32°C (permissive). Comparative analysis of transcriptomes from snails cultured at the non-permissive and permissive temperatures revealed that whereas stress related transcripts dominated the transcriptome of susceptible BS-90 juvenile snails at 32°C, transcripts encoding proteins with a role in epigenetics, such as PIWI (BgPiwi), chromobox protein homolog 1 (BgCBx1), histone acetyltransferase (BgHAT), histone deacetylase (BgHDAC) and metallotransferase (BgMT) were highly expressed in those cultured at 25°C. To identify robust candidate transcripts that will underscore the anti-schistosome phenotype in B. glabrata, further validation of the differential expression of the above transcripts was performed by using the resistant BS-90 (25°C) and the BBO2 susceptible snail stock whose genome has now been sequenced and represents an invaluable resource for molecular studies in B. glabrata. A role for BgPiwi in B. glabrata susceptibility to S. mansoni, was further examined by using siRNA corresponding to the BgPiwi encoding transcript to suppress expression of BgPiwi, rendering the resistant BS-90 juvenile snail susceptible to infection at 25°C. Given transposon silencing activity of PIWI as a facet of its role as guardian of the integrity of the genome, we examined the expression of the nimbus RT encoding transcript at 120 min after infection of resistant BS90 piwi-siRNA treated snails. We observed that nimbus RT was upregulated, indicating that modulation of the transcription of the nimbus RT was associated with susceptibility to S. mansoni in BgPiwi-siRNA treated BS-90 snails. Furthermore, treatment of susceptible BBO2 snails with the RT inhibitor lamivudine, before exposure to S. mansoni, blocked S. mansoni infection concurrent with downregulation of the nimbus RT transcript and upregulation of the BgPiwi encoding transcript in the lamivudine-treated, schistosome-exposed susceptible snails.

Conclusions and significance: These findings support a role for the interplay of BgPiwi and nimbus in the epigenetic modulation of plasticity of resistance/susceptibility in the snail-schistosome relationship.


Conflict of interest statement

The authors have declared that no competing interests exist.

Figures

Fig 1
Fig 1. qPCR analysis of RNA from resistant BS-90 (blue histogram) or susceptible BBO2 (gray histograms) juvenile snails unexposed (0) or exposed for increasing intervals (30 seconds to 16 hours) to S. mansoni miracidia.
Histograms show expression of the BgPiwi encoding transcript in snails at each time point from five biological replicates. Note the increase in fold change in the resistant BS-90 compared to the susceptible BBO2 snails after parasite infection. Significant expression normalized against expression of the myoglobin encoding transcript was measured by 2-way ANOVA and is indicated by number of asterisks on each histogram where ****, indicates the most significant value p ≤ 0.0001, *** p ≤ 0.001, ** p ≤ 0.01, * p ≤ 0.05, ns p > 0.05.
Fig 2
Fig 2. qPCR analysis of RNA from either resistant BS-90 (blue histogram) or susceptible BBO2 (gray histograms) juvenile snails unexposed (0) or exposed for increasing intervals (30 seconds to 16 hours) to S. mansoni miracidia.
Histograms show expression of the BgHDAC encoding transcript in snails at each time point from five biological replicates. Note the increase in fold change in the resistant BS-90 compared to the susceptible BBO2 snails after parasite infection. Significant expression normalized against expression of the myoglobin encoding transcript was measured by 2-way ANOVA and is indicated by number of asterisks on each histogram where ****, indicates the most significant value p ≤ 0.0001, *** p ≤ 0.001, ** p ≤ 0.01, * p ≤ 0.05, ns p > 0.05.
Fig 3
Fig 3. qPCR analysis of RNA from either resistant BS-90 (blue histogram) or susceptible BBO2 (gray histograms) juvenile snails unexposed (0) or exposed for increasing intervals (30 seconds to 16 hours) S. mansoni miracidia.
Histograms show expression of the BgCBx encoding transcript in snails at each time point from five biological replicates. Note the increase in fold change in the resistant BS-90 compared to the susceptible BBO2 snails after parasite infection. Significant expression normalized against expression of the myoglobin encoding transcript was measured by 2-way ANOVA and is indicated by number of asterisks on each histogram where ****, indicates the most significant value p ≤ 0.0001, *** p ≤ 0.001, ** p ≤ 0.01, * p ≤ 0.05, ns p > 0.05.
Fig 4
Fig 4. qPCR analysis of RNA from either resistant BS-90 (blue histogram) or susceptible BBO2 (gray histograms) juvenile snails unexposed (0) or exposed for increasing intervals (30 seconds to 16 hours) to S. mansoni miracidia.
Histograms show expression of the BgHAT encoding transcript in snails at each time point from five biological replicates. Note the increase in fold change in the resistant BS-90 compared to the susceptible BBO2 snails after parasite infection. Significant expression normalized against expression of the myoglobin encoding transcript was measured by 2-way ANOVA and is indicated by number of asterisks on each histogram where ****, indicates the most significant value p ≤ 0.0001, *** p ≤ 0.001, ** p ≤ 0.01, * p ≤ 0.05, ns p > 0.05.
Fig 5
Fig 5. qPCR analysis of RNA from either resistant BS-90 (blue histogram) or susceptible BBO2 (gray histograms) juvenile snails unexposed (0) or exposed for increasing intervals (30 seconds to 16 hours) to S. mansoni miracidia.
Histograms show expression of the BgMT encoding transcript in snails at each time point from five biological replicates. Note the increase in fold change in the resistant BS-90 compared to the susceptible BBO2 snails after parasite infection. Significant expression normalized against expression of the myoglobin encoding transcript was measured by 2-way ANOVA and is indicated by number of asterisks on each histogram where ****, indicates the most significant value p ≤ 0.0001, *** p ≤ 0.001, ** p ≤ 0.01, * p ≤ 0.05, ns p > 0.05.
Fig 6
Fig 6. Graphical flow chart illustration of the results and experimental design.
Juvenile snails were used in the study and were exposed to S. mansoni miracidia as described on MATERIALS and METHODS.
Fig 7
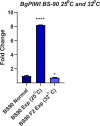
Fig 7. qPCR analysis of RNA from either non permissive (25°C) resistant BS-90 (blue histogram) or permissive (32°C) susceptible BS-90 (gray histograms) juvenile snails unexposed (normal) or exposed for 2hr to S. mansoni miracidia.
Histograms show expression of the BgPiwi encoding transcript in these snails residing at different temperatures. Note the significant induction (8-fold change) in 25°C non-permissive BS-90 snails compared the down regulation of the transcript in permissive BS-90 snails residing at 32°C after parasite infection. Fold change was determined as described in MATERIALS and METHODS. Significant expression normalized against expression of the myoglobin encoding transcript was measured by 2-way ANOVA and is indicated by number of asterixis on each histogram where ****, indicates the most significant value p ≤ 0.0001, *** p ≤ 0.001, ** p ≤ 0.01, * p ≤ 0.05, ns p > 0.05.
Fig 8
Fig 8. qPCR analysis of RNA from resistant BS-90 juvenile snails unexposed (gray) or exposed (blue) for 2hr to S. mansoni miracidia.
Histograms show expression of the BgPiwi encoding transcript in normal BS-90 snails (control) or those transfected with BgPiwi siRNA. Note induction of the BgPiwi encoding transcript occurs in S. mansoni exposed control BS-90 snails and the knock down of the transcript in BS-90 (exposed and unexposed) snails transfected with BgPiwi siRNA. In BS-90 snails transfected with mock UNIsiRNA, note the upregulation of the BgPiwi encoding transcript in exposed snails similar to induction observed in control exposed snails. Fold change was determined as described in MATERIALS and METHODS. Significant expression normalized against expression of the myoglobin encoding transcript was measured by 2-way ANOVA and is indicated by number of asterixis on each histogram where ****, indicates the most significant value p ≤ 0.0001, *** p ≤ 0.001, ** p ≤ 0.01, * p ≤ 0.05, ns p > 0.05.
Fig 9
Fig 9. qPCR analysis of RNA from resistant BS-90 juvenile snails unexposed (gray) or exposed (blue) for 2hr to S. mansoni miracidia.
Histograms show expression of the nimbusRT encoding transcript in normal BS-90 snails (control) or those transfected with BgPiwi siRNA. Note the down regulation of the nimbusRT encoding transcript in S. mansoni exposed control BS-90 snails and the upregulation of nimbusRT transcript in BS-90 (exposed and unexposed) snails transfected with BgPiwi siRNA where transcript encoding BgPiwi has been knocked-down (shown in Fig 2B). In BS-90 snails transfected with mock UNIsiRNA, note the down regulation of the nimbusRT encoding transcript in exposed snails similar to that observed in control exposed snails. Fold change was determined as described in MATERIALS and METHODS. Significant expression normalized against expression of the myoglobin encoding transcript was measured by 2-way ANOVA and is indicated by number of asterixis on each histogram where ****, indicates the most significant value p ≤ 0.0001, *** p ≤ 0.001, ** p ≤ 0.01, * p ≤ 0.05, ns p > 0.05.
Fig 10
Fig 10. qPCR analysis of RNA from susceptible BBO2 juvenile snails unexposed (gray) or exposed (blue) for 2hr to S. mansoni miracidia.
Histograms show expression of the BgPiwi encoding transcript in normal BBO2 snails (0) or those treated with RT inhibitor Lamivudine (100 ng/ml or 200ng/m1). Note the down regulation of the BgPiwi encoding transcript in exposed control (0) snails and lamivudine treated snails (exposed and unexposed) snails. Fold change was determined as described in MATERIALS and METHODS. Significant expression normalized against expression of the myoglobin encoding transcript was measured by 2-way ANOVA and is indicated by number of asterixis on each histogram where ****, indicates the most significant value p ≤ 0.0001, *** p ≤ 0.001, ** p ≤ 0.01, * p ≤ 0.05, ns p > 0.05.
Fig 11
Fig 11. qPCR analysis of RNA from susceptible BBO2 juvenile snails unexposed (gray) or exposed (blue) for 2hr to S. mansoni miracidia.
Histograms show expression of the nimbusRT encoding transcript in normal BBO2 snails (0) or those treated with RT inhibitor, lamivudine (100 ng/ml or 200 ng/m1). Note the upregulation of the nimbusRT encoding transcript in exposed control (0) snails and down regulation of this transcript in lamivudine-treated snails (exposed and unexposed) snails. Fold change was determined as described in MATERIALS and METHODS. Significant expression normalized against expression of the myoglobin encoding transcript was measured by 2-way ANOVA and is indicated by number of asterisks on each histogram where ****, indicates the most significant value p ≤ 0.0001, *** p ≤ 0.001, ** p ≤ 0.01, * p ≤ 0.05, ns p > 0.05.
Fig 12
Fig 12. To determine the effect of lamivudine in relation to S. mansoni infection of susceptible BBO2 snails, snails were treated before exposure with 100 ng/ml of the RT inhibitor, maintained at room temperature, and evaluated for up to 6 weeks post-exposure.
Note that the BBO2 snails treated before infection with lamivudine failed to shed cercariae at 6 weeks post-exposure to S. mansoni unlike in untreated (control) snails. Also note that BBO2 snails treated with the hTERT RT inhibitor BBPA before exposure, unlike Lamivudine shed cercariae at 6 weeks post-exposure.
Fig 13
Fig 13. The effect of treating BBO2 susceptible snails with 100 ng/ml of lamivudine at 14 days post -exposure to S. mansoni was compared to the effect of treating susceptible BBO2 snails before exposure with 100 ng/ml of BPPA as described in MATERIALS and METHODS and left at room temperature and evaluated for up to 6 weeks post- exposure.
Note that the BBO2 snails treated before S. mansoni exposure with 100 ng BPPA failed to shed cercariae at 6- weeks post- exposure unlike in untreated (control) snails. Also note that BBO2 snails treated with lamivudine at 14 days after infection shed cercariae at 6 weeks post-exposure.
Fig 14
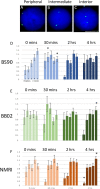
Fig 14. Nuclei, in blue, as they are stained with DAPI, were isolated from snail strains BS90, BB02 and NIMR ovo-testis and subjected to 2D-fluorescence in situ hybridisation (FISH) with fluorescein labelled probes for the transposable element, piwi (green).
Panel A displays a peripheral nuclear location, panel B an intermediate nuclear location and panel C a location at the nuclear interior for the two gene loci. Scale bar = 5 μm. Using a bespoke nuclear positioning script that creates five concentric shells of equal area, shells 1–5, with shell 1 being the nuclear periphery and shell 5 the nuclear center, the percentage of fluorescent green gene signal is measured in each shell for over 50 nuclei and divided by the percentage of blue fluorescence signals for the DNA content (DAPI) in each shell for normalization. The data are averaged and plotted as bar charts with standard error of the mean (SEM) as error bars. These graphs are displayed in panels D-F, showing the distribution of the normalized piwi gene signals from the nuclear periphery (shell 1) to the nuclear interior (shell 5), 30 mins, 2 hours and 4 hours after an infection with Schistosoma mansoni at 0 hours. Panel D displays data from BS90 snails, panel E data from BB02 snails and panel F from NMRI snails.

Similar articles

Cited by

References

    1. Colley DG, Bustinduy AL, Secor WE, King CH. Human schistosomiasis. Lancet. 2014;383(9936):2253–64. Epub 2014/04/05. doi: 10.1016/S0140-6736(13)61949-2 ; PubMed Central PMCID: PMC4672382. - DOI - PMC - PubMed
    1. Hotez PJ, Engels D, Gyapong M, Ducker C, Malecela MN. Female Genital Schistosomiasis. N Engl J Med. 2019;381(26):2493–5. Epub 2019/12/28. doi: 10.1056/NEJMp1914709 . - DOI - PubMed
    1. Colley DG. Morbidity control of schistosomiasis by mass drug administration: how can we do it best and what will it take to move on to elimination? Trop Med Health. 2014;42(2 Suppl):25–32. Epub 2014/11/27. doi: 10.2149/tmh.2014-S04 ; PubMed Central PMCID: PMC4204048. - DOI - PMC - PubMed
    1. Knopp S, Ame SM, Hattendorf J, Ali SM, Khamis IS, Bakar F, et al.. Urogenital schistosomiasis elimination in Zanzibar: accuracy of urine filtration and haematuria reagent strips for diagnosing light intensity Schistosoma haematobium infections. Parasit Vectors. 2018;11(1):552. Epub 2018/10/26. doi: 10.1186/s13071-018-3136-6; PubMed Central PMCID: PMC6199745. - DOI - PMC - PubMed
    1. Shen Y, Wiegand RE, Olsen A, King CH, Kittur N, Binder S, et al.. Five-Year Impact of Different Multi-Year Mass Drug Administration Strategies on Childhood Schistosoma mansoni-Associated Morbidity: A Combined Analysis from the Schistosomiasis Consortium for Operational Research and Evaluation Cohort Studies in the Lake Victoria Regions of Kenya and Tanzania. Am J Trop Med Hyg. 2019;101(6):1336–44. Epub 2019/08/14. doi: 10.4269/ajtmh.19-0273 ; PubMed Central PMCID: PMC6896894. - DOI - PMC - PubMed

Publication types

MeSH terms