

The prevalence of paramagnetic rim lesions in multiple sclerosis: A systematic review and meta-analysis
- PMID: 34495999
- PMCID: PMC8425533
- DOI: 10.1371/journal.pone.0256845
The prevalence of paramagnetic rim lesions in multiple sclerosis: A systematic review and meta-analysis
Abstract
Background: Recent findings from several studies have shown that paramagnetic rim lesions identified using susceptibility-based MRI could represent potential diagnostic and prognostic biomarkers in multiple sclerosis (MS). Here, we perform a systematic review and meta-analysis of the existing literature to assess their pooled prevalence at lesion-level and patient-level.
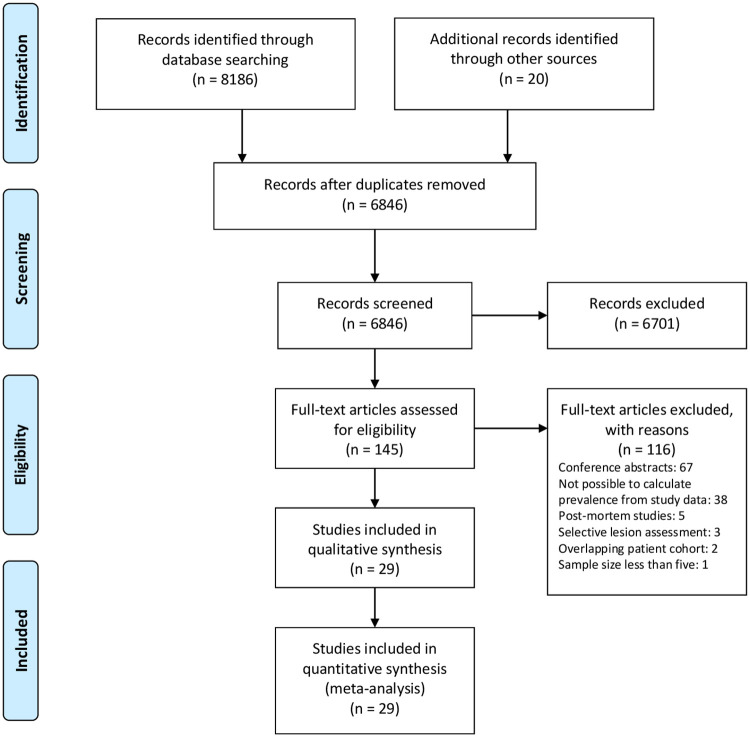
Methods: Both database searching (PubMed and Embase) and handsearching were conducted to identify studies allowing the lesion-level and/or patient-level prevalence of rim lesions or chronic active lesions to be calculated. Pooled prevalence was estimated using the DerSimonian-Laird random-effects model. Subgroup analysis and meta-regression were performed to explore possible sources of heterogeneity. PROSPERO registration: CRD42020192282.
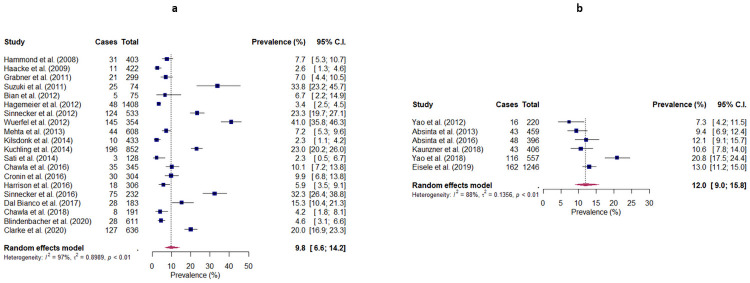
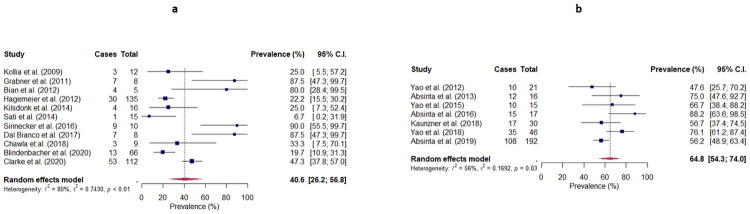
Results: 29 studies comprising 1230 patients were eligible for analysis. Meta-analysis estimated pooled prevalences of 9.8% (95% CI: 6.6-14.2) and 40.6% (95% CI: 26.2-56.8) for rim lesions at lesion-level and patient-level, respectively. Pooled lesion-level and patient-level prevalences for chronic active lesions were 12.0% (95% CI: 9.0-15.8) and 64.8% (95% CI: 54.3-74.0), respectively. Considerable heterogeneity was observed across studies (I2>75%). Subgroup analysis revealed a significant difference in patient-level prevalence between studies conducted at 3T and 7T (p = 0.0312). Meta-regression analyses also showed significant differences in lesion-level prevalence with respect to age (p = 0.0018, R2 = 0.20) and disease duration (p = 0.0018, R2 = 0.48). Other moderator analyses demonstrated no significant differences according to MRI sequence, gender and expanded disability status scale (EDSS).
Conclusion: In this study, we show that paramagnetic rim lesions may be present in an important proportion of MS patients, notwithstanding significant variation in their assessment across studies. In view of their possible clinical relevance, we believe that clear guidelines should be introduced to standardise their assessment across research centres to in turn facilitate future analyses.
Conflict of interest statement
The authors have declared that no competing interests exist.
Figures
References
Publication types
MeSH terms
Substances
Grants and funding
LinkOut - more resources
Full Text Sources
Medical
