Review
. 2022 Apr;22(3):847-861.
doi: 10.1111/1755-0998.13502. Epub 2021 Sep 30.

Coming of age for COI metabarcoding of whole organism community DNA: Towards bioinformatic harmonisation

Affiliations
Review

Coming of age for COI metabarcoding of whole organism community DNA: Towards bioinformatic harmonisation

Thomas J Creedy et al. Mol Ecol Resour. 2022 Apr.

Abstract

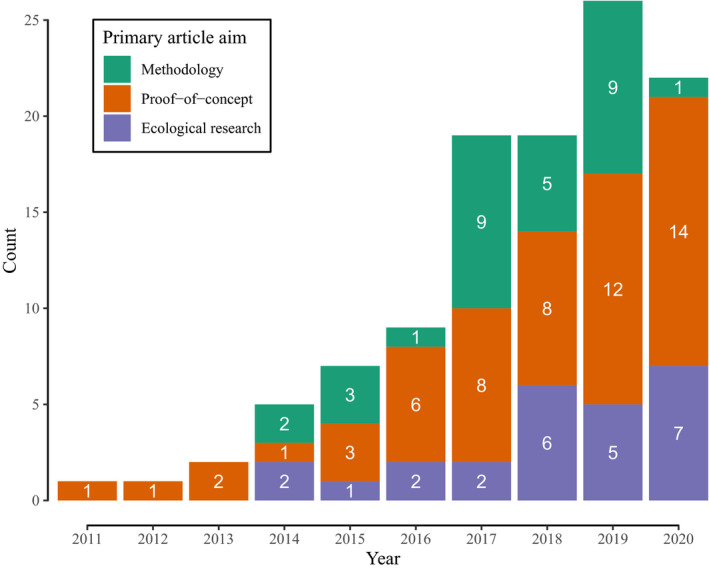
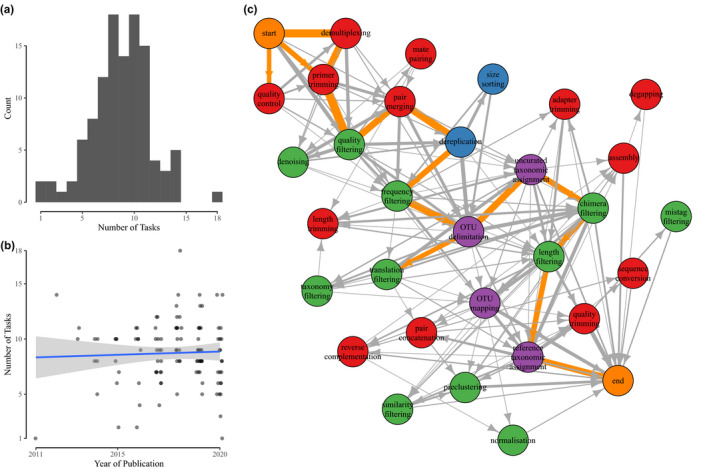
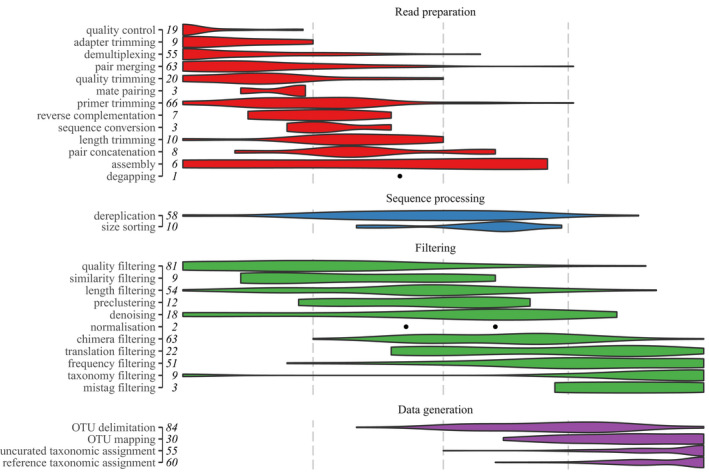
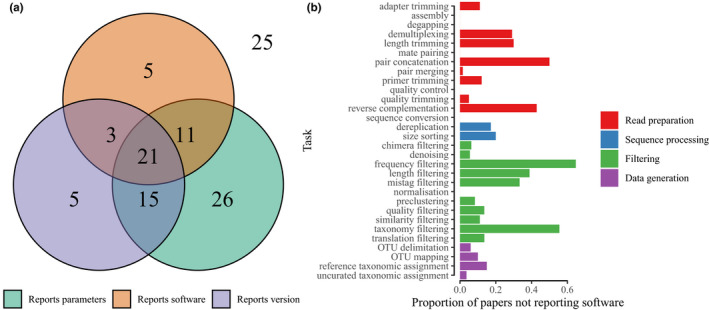
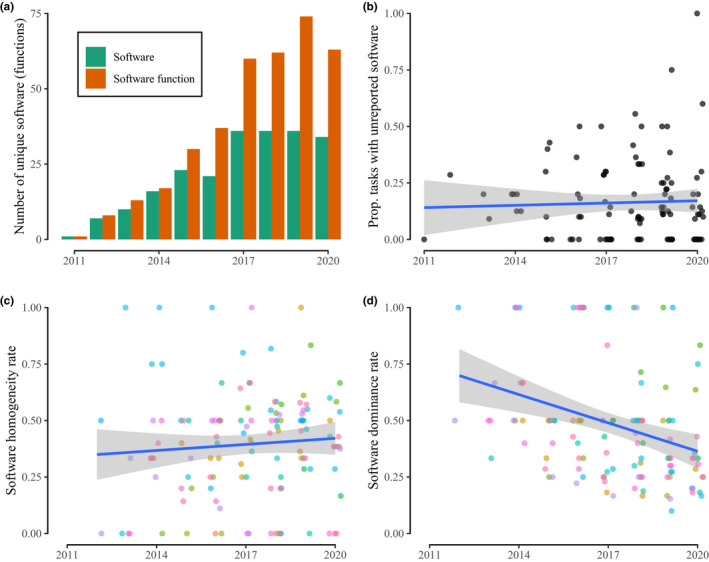
Metabarcoding of DNA extracted from community samples of whole organisms (whole organism community DNA, wocDNA) is increasingly being applied to terrestrial, marine and freshwater metazoan communities to provide rapid, accurate and high resolution data for novel molecular ecology research. The growth of this field has been accompanied by considerable development that builds on microbial metabarcoding methods to develop appropriate and efficient sampling and laboratory protocols for whole organism metazoan communities. However, considerably less attention has focused on ensuring bioinformatic methods are adapted and applied comprehensively in wocDNA metabarcoding. In this study we examined over 600 papers and identified 111 studies that performed COI metabarcoding of wocDNA. We then systematically reviewed the bioinformatic methods employed by these papers to identify the state-of-the-art. Our results show that the increasing use of wocDNA COI metabarcoding for metazoan diversity is characterised by a clear absence of bioinformatic harmonisation, and the temporal trends show little change in this situation. The reviewed literature showed (i) high heterogeneity across pipelines, tasks and tools used, (ii) limited or no adaptation of bioinformatic procedures to the nature of the COI fragment, and (iii) a worrying underreporting of tasks, software and parameters. Based upon these findings we propose a set of recommendations that we think the metabarcoding community should consider to ensure that bioinformatic methods are appropriate, comprehensive and comparable. We believe that adhering to these recommendations will improve the long-term integrative potential of wocDNA COI metabarcoding for biodiversity science.

Keywords: COI barcode; animal communities; bioinformatics; community ecology; high-throughput sequencing; metabarcoding.


Conflict of interest statement

Alfried P. Vogler is a cofounder and scientific advisor of NatureMetrics, a private company providing commercial services in DNA‐based monitoring. The authors declare that they have no other conflicts of interest.

Figures

FIGURE 1
FIGURE 1
Year of publication of the articles in the core papers set. Bar fills and numbers refer to the number of articles within each research aim category. Note that only articles indexed by Web of Science by 3rd November 2020 were included
FIGURE 2
FIGURE 2
Bioinformatic pipelines implemented by the core papers set. (a) Frequency distribution of the number of tasks by study, (b) Number of tasks by study against the year of publication, with best fit regression line in blue with shaded 95% confidence intervals around the line. Slight horizontal jitter added to points to better show density. (c) Network diagram of tasks and different pipeline routes through these tasks. All pipelines start and end on the respective orange nodes. All other nodes are coloured according to the four main categories of bioinformatic tasks; red for read preparation tasks, blue for sequence processing, green for filtering and purple for data generation tasks. Arrows link tasks performed consecutively, with direction of arrow showing order of tasks. Thickness of arrows shows relative frequency of pairs of consecutive tasks. Arrows coloured orange are the top 10% of consecutive task pairs by relative frequency; note that while this illustrates a possible complete pipeline from Start to End, this “average” pipeline is not in fact performed by any of the papers assessed by this review
FIGURE 3
FIGURE 3
Violin plot of standardised task position within pipelines. Increasing x‐axis position denotes later placement of task within pipelines, vertical dashed lines denote 25%, 50% and 75% of the way through the pipeline, respectively. Tasks are separated into task groups and ordered within task group by mean standardised pipeline position. Points denote task positions where tasks occurred too infrequently to compute density profile for violin plots. Values report the total number of papers implementing each task
FIGURE 4
FIGURE 4
Plots summarising the reporting of three key aspects of bioinformatic tools (software name, version and parameters) by the core papers. (a). Venn diagram shows the number of papers fully reporting each detail, that is, giving the software used for every task reported, and giving the parameters and version for each task where software is given; 86 papers reported at least one of the three details for all steps, 25 further papers failed to fully report all three details in all steps. (b) Bar chart details the proportion of papers employing a specific task that failed to report the software used for that task, with longer bars denoting a greater proportion of papers not reporting software for that specific task
FIGURE 5
FIGURE 5
Consistency in software reporting and use over time. (a) The total number of unique software functions reported across all papers for each year of publication. (b) For each paper, the proportion of the total number of bioinformatic tasks for which the software used for a task was not reported. (c) The software homogeneity rate, calculated only when more than one paper reported a task in a given year. A value of 1 means all papers used the same tool for a given task in a given year. (d) The software dominance rate, calculated only when more than one paper reported a task in a given year. A value of 1 means all papers used the same tool for a given task in a given year. (b–d) Best fit regression lines are shown in blue with shaded 95% confidence intervals around the line. Horizontal jitter added to points to illustrate density within years; (c and d) colours denote different tasks, see Figure S1

References

    1. Andújar, C. , Arribas, P. , Gray, C. , Bruce, C. , Woodward, G. , Yu, D. W. , & Vogler, A. P. (2018). Metabarcoding of freshwater invertebrates to detect the effects of a pesticide spill. Molecular Ecology, 27(1), 146–166. 10.1111/mec.14410 - DOI - PubMed
    1. Andújar, C. , Arribas, P. , Yu, D. W. , Vogler, A. P. , & Emerson, B. C. (2018). Why the COI barcode should be the community DNA metabarcode for the metazoa. Molecular Ecology, 27(20), 3968–3975. 10.1111/mec.14844 - DOI - PubMed
    1. Andújar, C. , Creedy, T. J. , Arribas, P. , López, H. , Salces‐Castellano, A. , Pérez‐Delgado, A. J. , Vogler, A. P. , & Emerson, B. C. (2021). Validated removal of nuclear pseudogenes and sequencing artefacts from mitochondrial metabarcode data. Molecular Ecology Resources, 21(6), 1772–1787. 10.1111/1755-0998.13337 - DOI - PubMed
    1. Antich, A. , Palacin, C. , Wangensteen, O. S. , & Turon, X. (2021). To denoise or to cluster, that is not the question: Optimizing pipelines for COI metabarcoding and metaphylogeography. BMC Bioinformatics, 22(1), 177. 10.1186/s12859-021-04115-6 - DOI - PMC - PubMed
    1. Arribas, P. , Andújar, C. , Bidartondo, M. I. , Bohmann, K. , Coissac, É. , Creer, S. , deWaard, J. R. , Elbrecht, V. , Ficetola, G. F. , Goberna, M. , Kennedy, S. , Krehenwinkel, H. , Leese, F. , Novotny, V. , Ronquist, F. , Yu, D. W. , Zinger, L. , Creedy, T. J. , Meramveliotakis, E. , … Emerson, B. C. (2021). Connecting high‐throughput biodiversity inventories: Opportunities for a site‐based genomic framework for global integration and synthesis. Molecular Ecology, 30(5), 1120–1135. 10.1111/mec.15797 - DOI - PMC - PubMed

LinkOut - more resources