. 2021 Oct 12;54(10):2372-2384.e7.
doi: 10.1016/j.immuni.2021.08.007. Epub 2021 Sep 7.

Functional impairment of HIV-specific CD8+ T cells precedes aborted spontaneous control of viremia

Affiliations

Functional impairment of HIV-specific CD8+ T cells precedes aborted spontaneous control of viremia

David R Collins et al. Immunity. .

Abstract

Spontaneous control of HIV infection has been repeatedly linked to antiviral CD8+ T cells but is not always permanent. To address mechanisms of durable and aborted control of viremia, we evaluated immunologic and virologic parameters longitudinally among 34 HIV-infected subjects with differential outcomes. Despite sustained recognition of autologous virus, HIV-specific proliferative and cytolytic T cell effector functions became selectively and intrinsically impaired prior to aborted control. Longitudinal transcriptomic profiling of functionally impaired HIV-specific CD8+ T cells revealed altered expression of genes related to activation, cytokine-mediated signaling, and cell cycle regulation, including increased expression of the antiproliferative transcription factor KLF2 but not of genes associated with canonical exhaustion. Lymphoid HIV-specific CD8+ T cells also exhibited poor functionality during aborted control relative to durable control. Our results identify selective functional impairment of HIV-specific CD8+ T cells as prognostic of impending aborted HIV control, with implications for clinical monitoring and immunotherapeutic strategies.

Keywords: CD8(+) T cell dysfunction; HIV control; human immunology.


Conflict of interest statement

Declaration of interests The authors declare no competing interests.

Figures
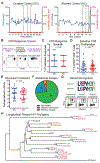
Figure 1:
Figure 1:. HIV-specific CD8+ T cells maintain recognition of autologous HIV during aborted viral control.
(A) Viral loads (right axes) and CD4 counts (left axes) for representative subjects with durable control (DC) or aborted control (AC) of HIV viremia. Longitudinal samples T1-T3 (dashed lines) precede loss or maintenance of viral control. (B) Schematic of and representative results from proliferation screen for HIV epitope-specific CD8+ T cell responses comparing carboxyfluorescein succinimidyl ester (CFSE) dilution in response to unstimulated negative control, individual HLA-optimal HIV peptide stimulated, and anti-CD3/CD28 stimulated positive control. (C) Number (breadth) of HIV peptide-specific proliferative CD8+ T cell responses detected above background at baseline (T1) in subjects with AC or DC (n = 17 each; Mann-Whitney U-test). (D) Frequency of CFSE-low CD8+ T cells after stimulation with individual HLA-optimal HIV peptides at baseline (T1) in subjects with AC or DC (n = 36 and 35 responses, respectively, among 17 subjects each; unpaired t test). (E) HIV epitope network z-scores, where available, for proliferative HIV-specific responses detected in subjects with DC or AC (n = 35 and 33 responses, respectively, among 17 subjects each; unpaired t test). (F) Summary of mutations and escape from CD8+ T cell recognition in 19 responses from 10 subjects with AC. (G) Weblogos depicting longitudinal variation observed in a CD8+ T cell epitope sequence targeted by subject AC07 before and after aborted control of viremia (top). Recognition of clade B consensus, pre-AC and post-AC sequence variant peptides after 4-hour stimulation of PBMCs collected prior to AC, as measured by flow cytometry of surface CD107A and intracellular IFN-γ (bottom). (H) Maximum likelihood phylogenetic tree showing genetic distances between plasma HIV sequences from the indicated subjects before (pre) and after (post) AC, and reference HIV sequences. Values in gray represent percentage of 1000 bootstraps for each branch. See also Figures S1-S2 and Tables S1-S3.
Figure 2:
Figure 2:. HIV-specific CD8+ T cell proliferation is progressively and selectively impaired preceding aborted viral control.
(A) Summary of peptide-HLA (pHLA) tetramer staining frequencies at baseline (T1) in DC (n = 8) and AC (n = 8) measured by flow cytometry; Mann-Whitney U-test. (B) Representative longitudinal HIV-specific pH LA tetramer staining preceding AC (left). Summary of longitudinal changes in HIV-specific CD8+ T cell frequencies preceding AC or DC (right); unpaired t tests. (C) Representative longitudinal bulk CD8+ T cell memory subset composition measured by flow cytometric evaluation of CD45RA and CD62L surface expression (left). Summary of longitudinal bulk CD8+ T cell memory subset frequencies (right), represented as mean +/− SEM. TCM = central memory, TEM = effector memory, TEMRA = effector memory CD45RA+, TSCM = stem cell-like memory. (D) Representative CD8+ T cell proliferation assay results preceding AC following 6-day stimulation with HLA-optimal HIV peptide (above). Summary of longitudinal changes in HIV antigen-specific proliferation in response to stimulation with individual HLA-optimal HIV peptides preceding AC or DC for the indicated number of responses in 17 subjects from each group (below). **** p < 0.0001, Mann-Whitney U-tests. (E) Representative CD8+ T cell proliferation assay results (above) and summary of longitudinal changes in proliferation (below) following stimulation with pooled CMV, EBV and IAV peptides at longitudinal time points preceding AC or DC; unpaired t tests. (F) Representative CD8+ T cell proliferation assay results (above) and summary of longitudinal changes in proliferation (below) following stimulation with anti-CD3 and anti-CD28 antibodies at longitudinal time points preceding AC or DC; unpaired t tests. Values shown as fold over baseline (T1) where indicated to highlight longitudinal changes. See also Figures S3-S4.
Figure 3:
Figure 3:. Proliferative and cytolytic defects preceding aborted HIV control are CD8+ T cell intrinsic.
(A) Schematic of coculture proliferation assay in which HIV peptide-expanded CD8+ T cells from time points T1 or T3 preceding AC were cocultured with CD8-depleted PBMCs from time points T1 or T3 and stimulated with HIV peptide for 6 days. (B) Flow cytometry results (left) and baseline-normalized summary (right) of HIV-specific proliferation following cocultures from 3 subjects preceding AC. * p < 0.05, ** p < 0.01, ratio-paired t tests. (C) Schematic (left) of elimination assay in which CD8+ T cells from time points T1-T3 were individually cocultured with 50% HIV peptide-pulsed autologous CD4+ T cells for 6 hours at effector:target (E:T) ratios of 0, 1, 2, 4 and 8. Cells were gated as shown (right) to calculate percent of residual peptide-pulsed and percent elimination (relative to E:T 0). (D) Representative killing curves measuring elimination of autologous HIV peptide-pulsed CD4+ T cells by HIV peptide-expanded CD8+ T cells from longitudinal time points preceding AC or DC at E:T 1-8 (left). Summary of longitudinal changes in HIV-specific elimination, measured as area under killing curve (AUC) and normalized for baseline (T1) preceding AC or DC (right). * p < 0.05, **** p < 0.0001, unpaired t tests.
Figure 4:
Figure 4:. Transcriptional profiles of HIV-specific CD8+ T cells are altered preceding aborted viral control.
(A) Schematic overview of RNA-seq from longitudinal HIV-specific CD8+ T cells preceding AC (n = 5) or DC (n = 5) isolated by FACS (top). Histogram showing number of unique genes detected per sample (bottom). (B) Volcano plot summarizing differential gene expression at time point T3 preceding AC (n = 5) versus DC (n = 5). The top five most significant up- and down-regulated genes are labeled. (C) Plot comparing differential expression at baseline (T1, y-axis) and time point T3 (x-axis) preceding AC (n = 5) versus DC (n = 5). Genes are colored by significance (q < 0.05) for each comparison. The top five most significant up- and down-regulated genes unique to T3 are labeled. (D) Summary of gene set subnet enrichment analyses of differentially expressed genes from B ranked by FDR-adjusted q, signed by direction of fold change in AC vs DC (top 10 shown for each direction). (E) Violin plot summarizing longitudinal KLF2 mRNA expression as normalized, variance stabilizing transformed (VST) counts preceding AC (n = 5) or DC (n = 5). *** p < 0.001, unpaired t test. (F) Summary of longitudinal TCR clonotypic diversification as Morisita-Horn dissimilarity between T3 and T1 preceding AC (n = 5) or DC (n = 5); unpaired t test. See also Figures S5-S6 and Tables S4-S5.
Figure 5:
Figure 5:. Functional impairment preceding aborted HIV control is distinct from T cell exhaustion and senescence.
(A) Violin plot summarizing longitudinal single-sample gene set enrichment analyses (ssGSEA) for the listed set of exhaustion-associated genes preceding AC (n = 5) or DC (n = 5); unpaired t tests. (B-I) Summary of longitudinal changes in surface flow cytometric median fluorescence intensities (MFI) on HIV-specific CD8+ T cells normalized for baseline (T1) preceding AC (n = 8) or DC (n = 7) for PD1 (B), TIM3 (C), TIGIT (D), CD160 (E), 2B4 (F), CD39 (G), CD57 (H) and CD28 (I); unpaired t tests. See also Figure S7.
Figure 6:
Figure 6:. Lymphoid HIV-specific CD8+ T cells are functionally impaired during aborted viral control.
(A-B) Composite immunofluorescence micrographs depicting inguinal lymph node follicular margins (IgD, green), CD8+ cells (red) and HIV RNA via fluorescent probes (white) in sections from specimens obtained from one subject each during DC (A) or AC (B) for qualitative comparison. Orange box represents inset, scale bars represent 100 μm. (C) CD8+ T cell proliferation without (−) and with (+) 6-day HIV peptide stimulation in peripheral blood (PB) and lymph node (LN) as measured by CFSE dilution via flow cytometry during AC or DC (n = 1 each). (D) Killing curves showing elimination of autologous PB HIV peptide pulsed CD4+ T cells by HIV peptide-expanded PB or LN CD8+ T cells at the indicated effector:target (E:T) ratios during AC or DC (n = 1 each). AUC = area under curve.

References

    1. Ahn E, Araki K, Hashimoto M, Li W, Riley JL, Cheung J, Sharpe AH, Freeman GJ, Irving BA, and Ahmed R (2018). Role of PD-1 during effector CD8 T cell differentiation. Proc Natl Acad Sci U S A 115, 4749–4754. 10.1073/pnas.1718217115. - DOI - PMC - PubMed
    1. Allen TM, Altfeld M, Geer SC, Kalife ET, Moore C, O’Sullivan K M, Desouza I, Feeney ME, Eldridge RL, Maier EL, et al. (2005). Selective escape from CD8+ T-cell responses represents a major driving force of human immunodeficiency virus type 1 (HIV-1) sequence diversity and reveals constraints on HIV-1 evolution. J Virol 79, 13239–13249. 10.1128/JVI.79.21.13239-13249.2005. - DOI - PMC - PubMed
    1. Altfeld M, Allen TM, Yu XG, Johnston MN, Agrawal D, Korber BT, Montefiori DC, O’Connor DH, Davis BT, Lee PK, et al. (2002). HIV-1 superinfection despite broad CD8+ T-cell responses containing replication of the primary virus. Nature 420, 434–439. 10.1038/nature01200. - DOI - PubMed
    1. Bai A, Hu H, Yeung M, and Chen J (2007). Kruppel-like factor 2 controls T cell trafficking by activating L-selectin (CD62L) and sphingosine-1-phosphate receptor 1 transcription. J Immunol 178, 7632–7639. 10.4049/jimmunol.178.12.7632. - DOI - PubMed
    1. Bailey JR, Williams TM, Siliciano RF, and Blankson JN (2006). Maintenance of viral suppression in HIV-1-infected HLA-B*57+ elite suppressors despite CTL escape mutations. J Exp Med 203, 1357–1369. 10.1084/jem.20052319. - DOI - PMC - PubMed

Publication types