. 2021 Sep 7;36(10):109674.
doi: 10.1016/j.celrep.2021.109674.

Tumor-initiating stem cell shapes its microenvironment into an immunosuppressive barrier and pro-tumorigenic niche

Affiliations

Tumor-initiating stem cell shapes its microenvironment into an immunosuppressive barrier and pro-tumorigenic niche

Xi He et al. Cell Rep. .

Abstract

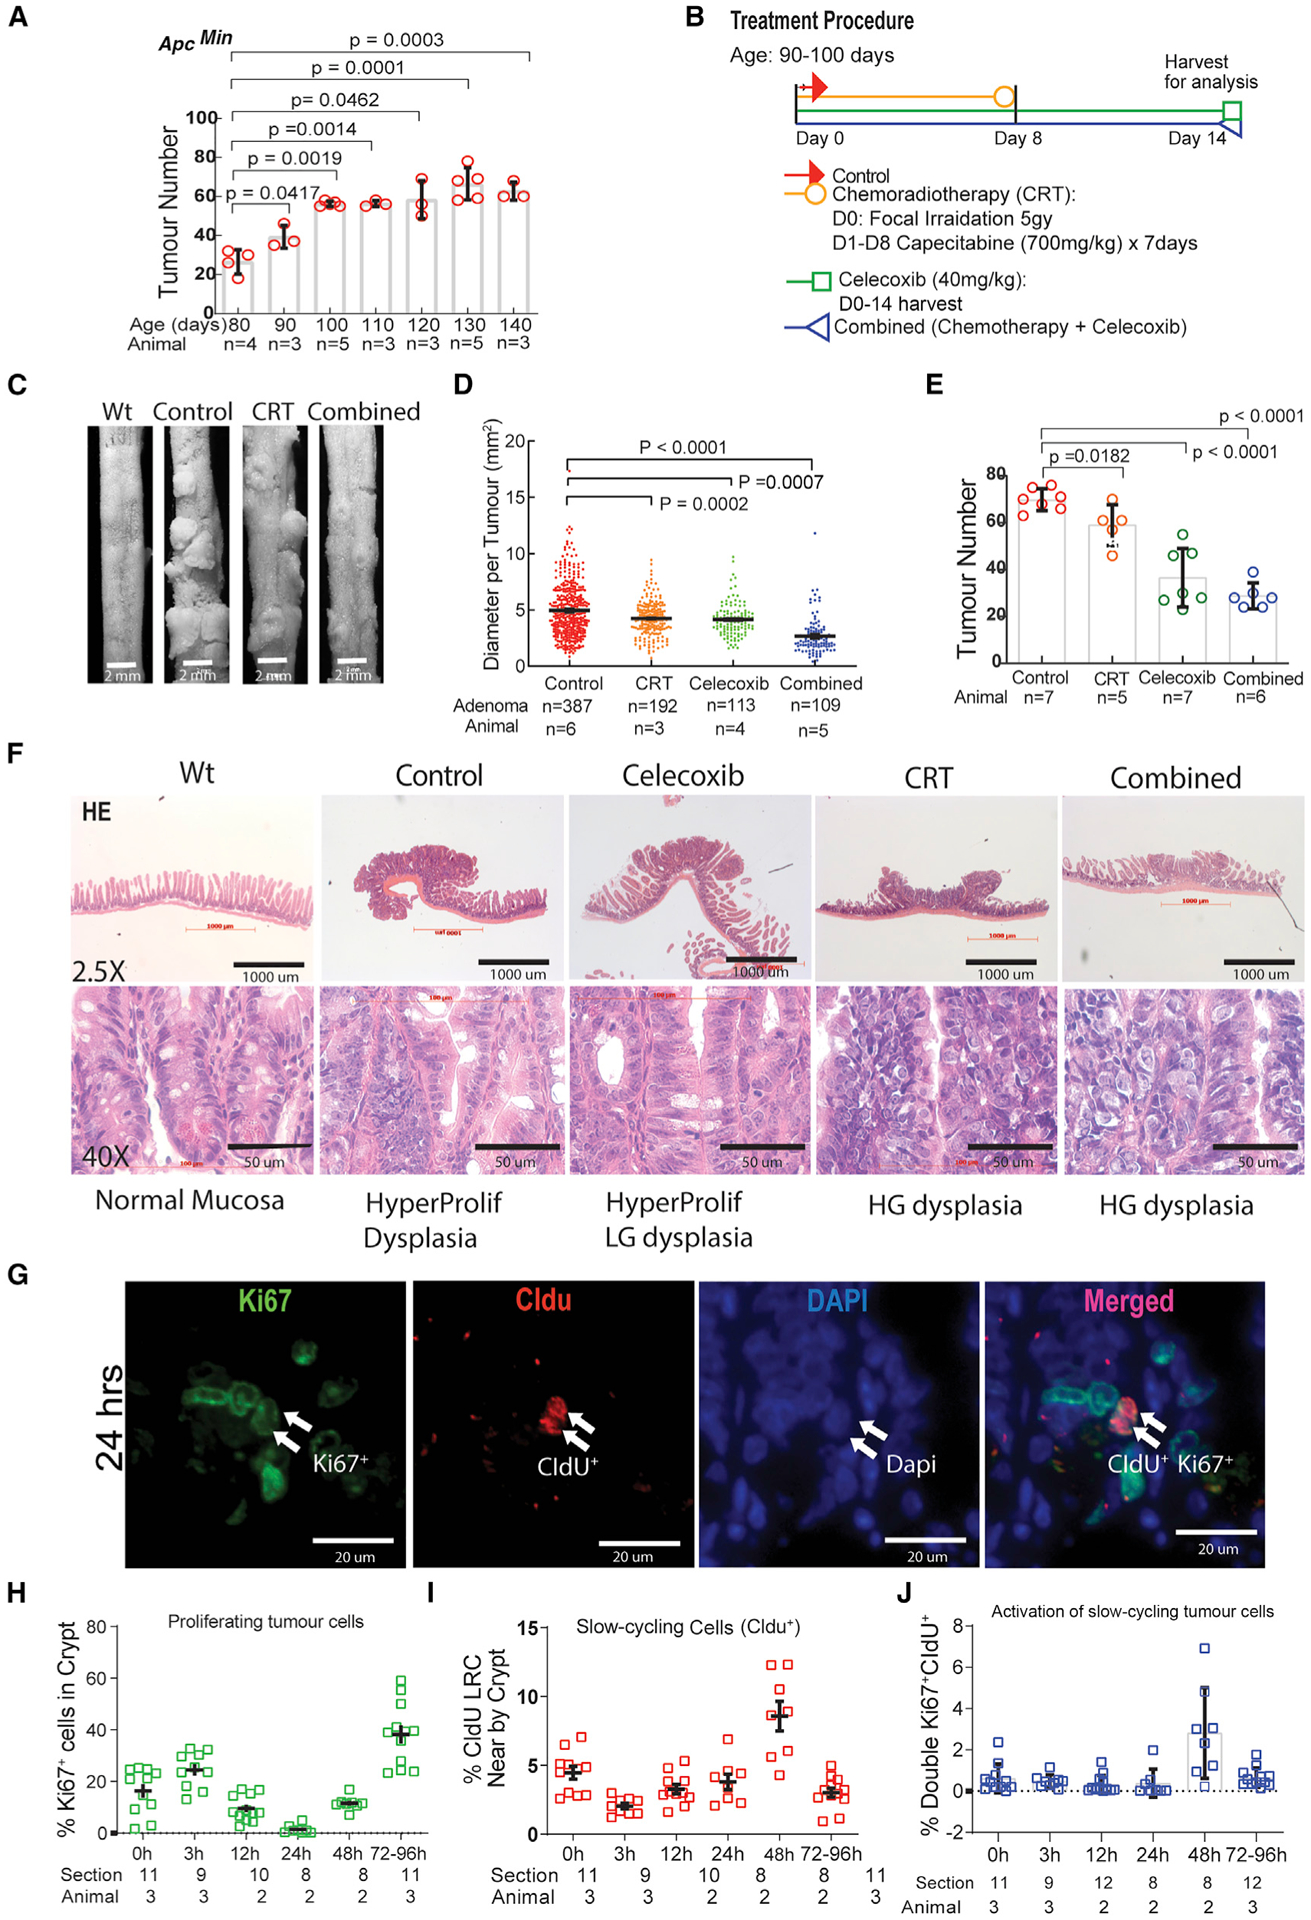
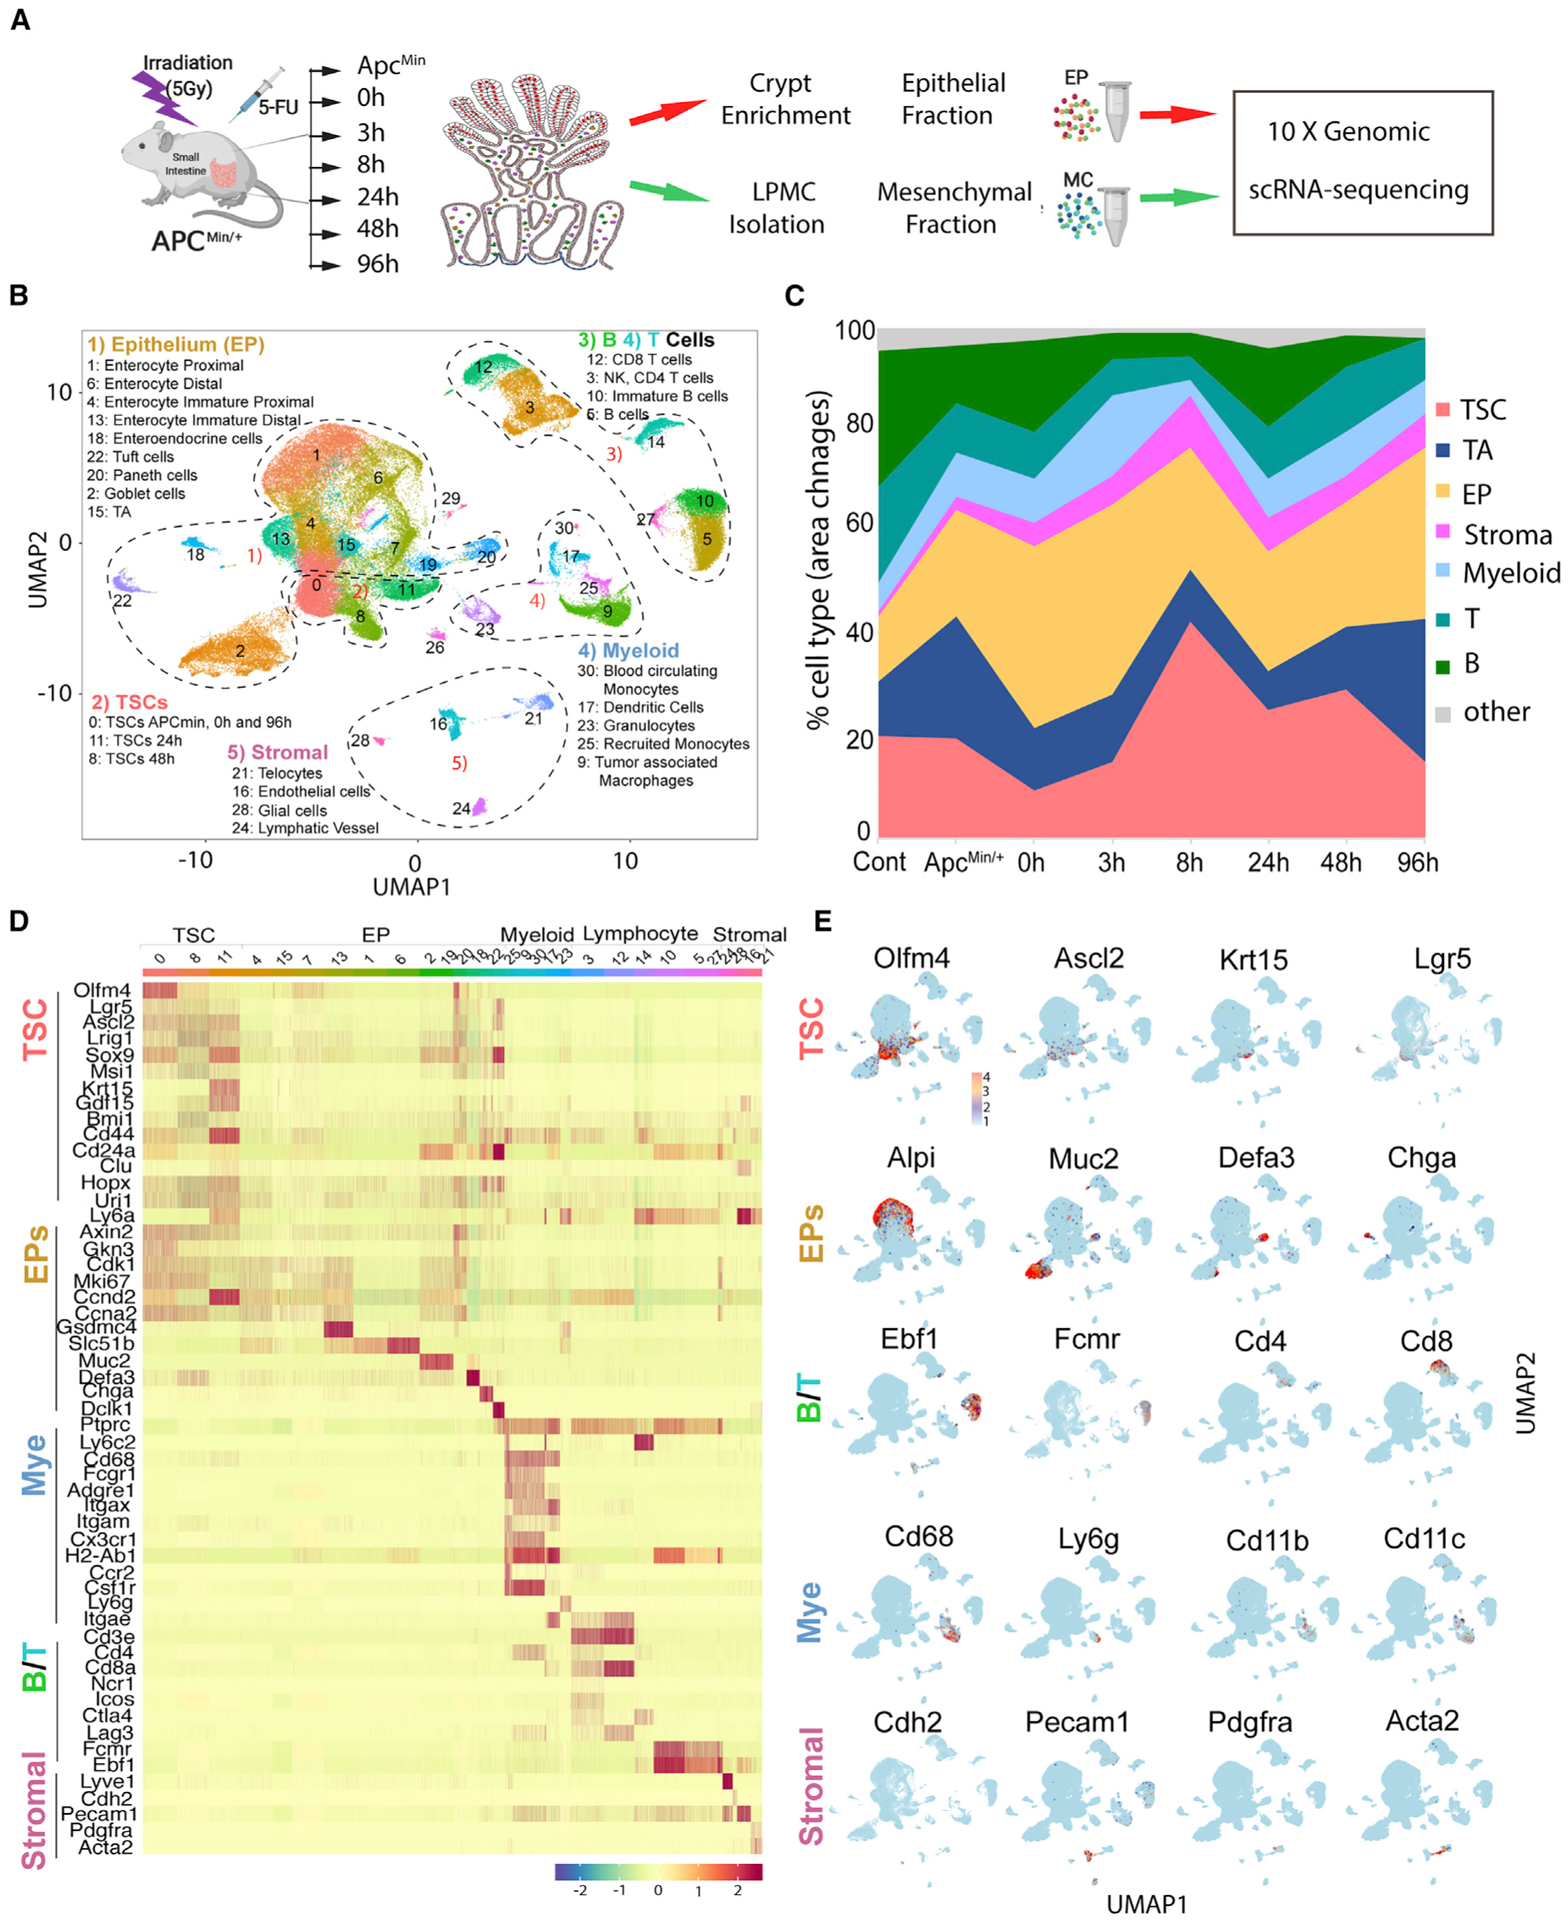
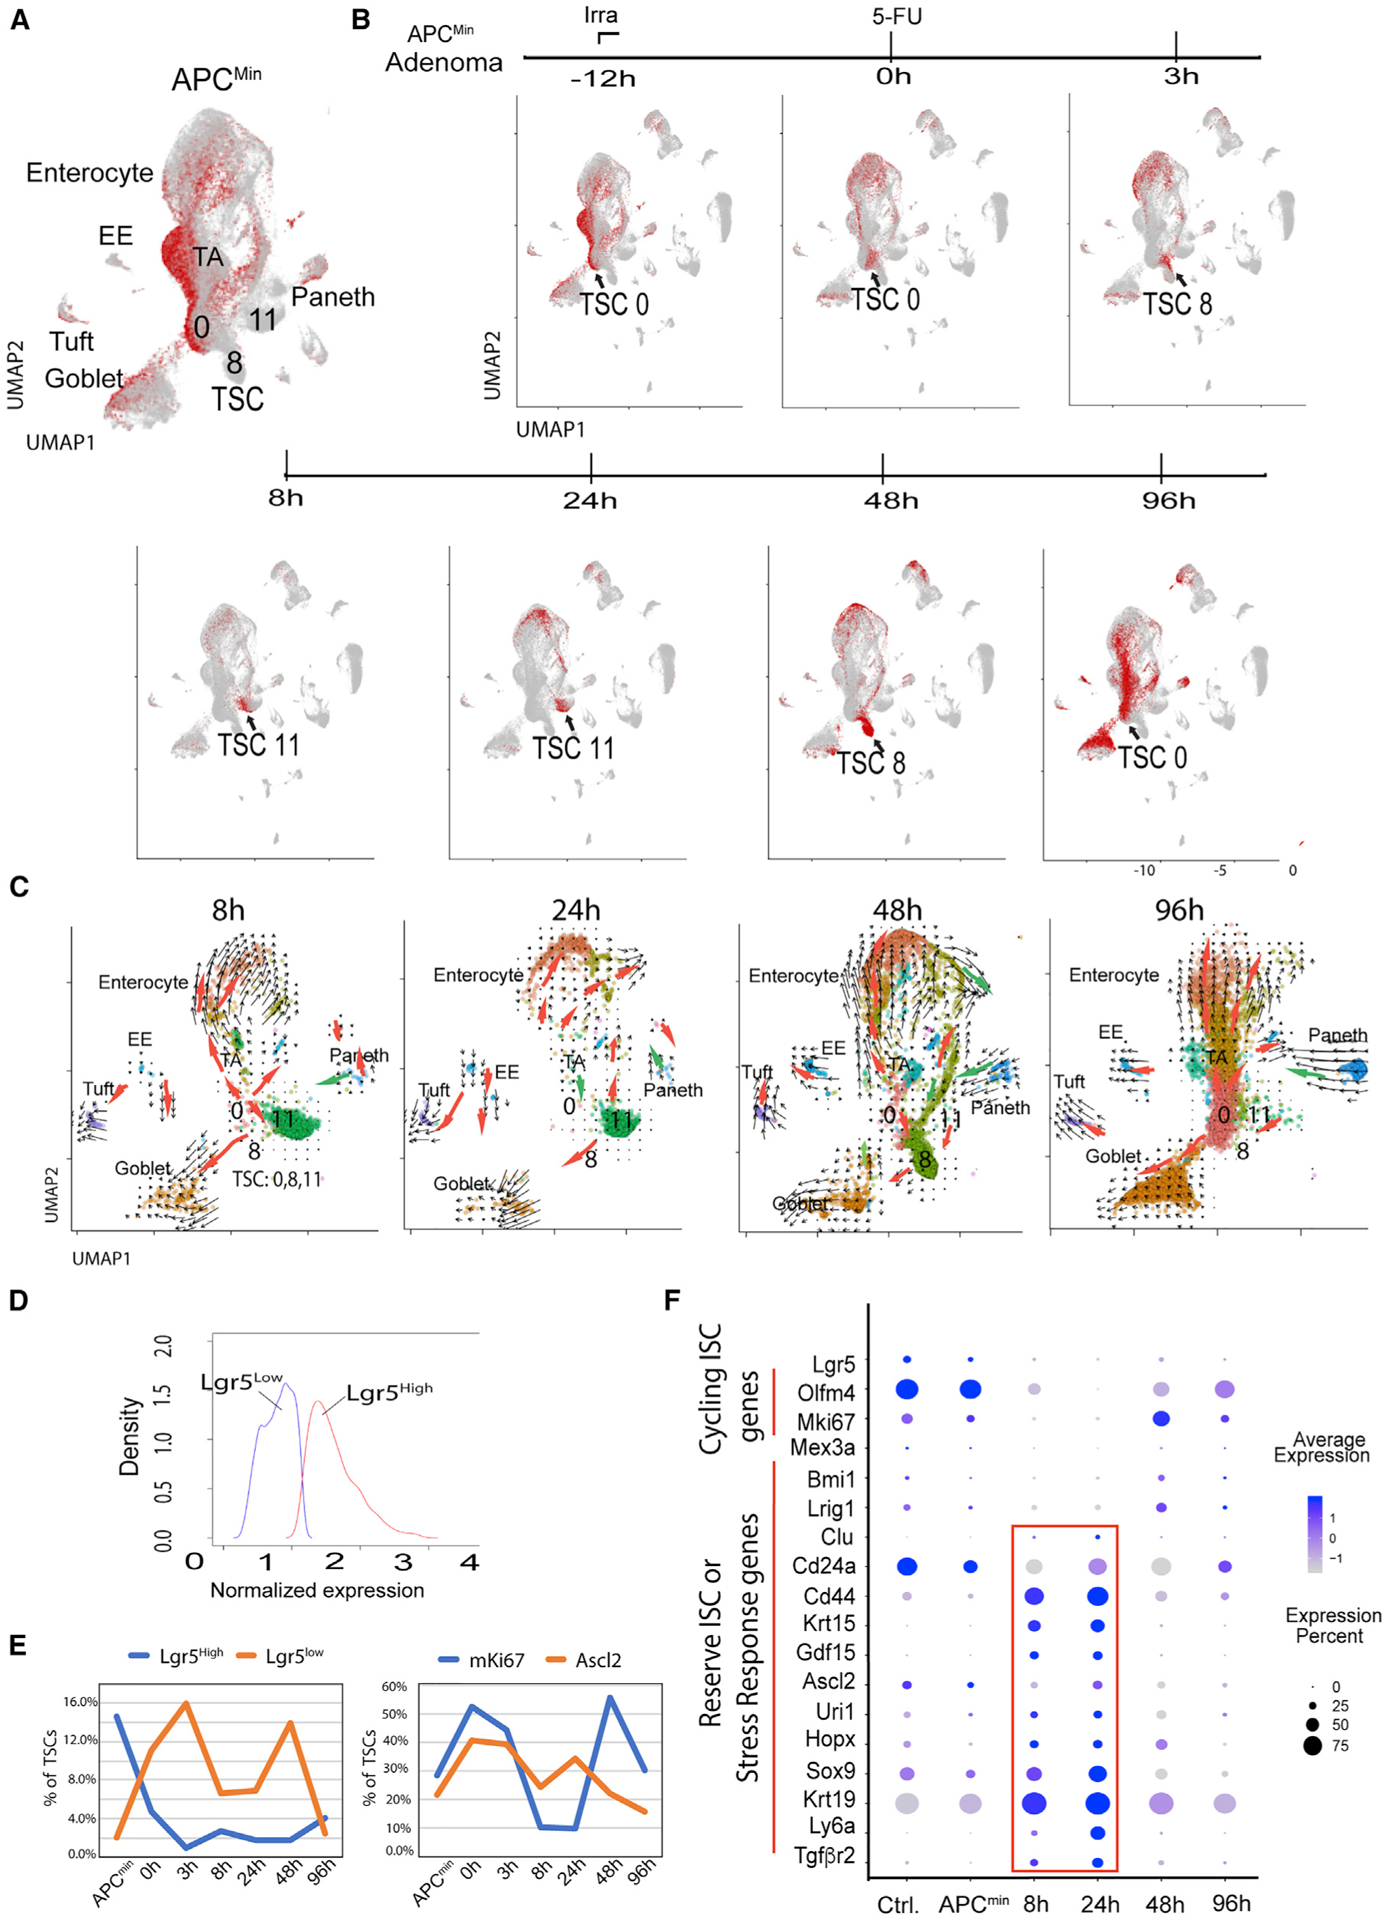
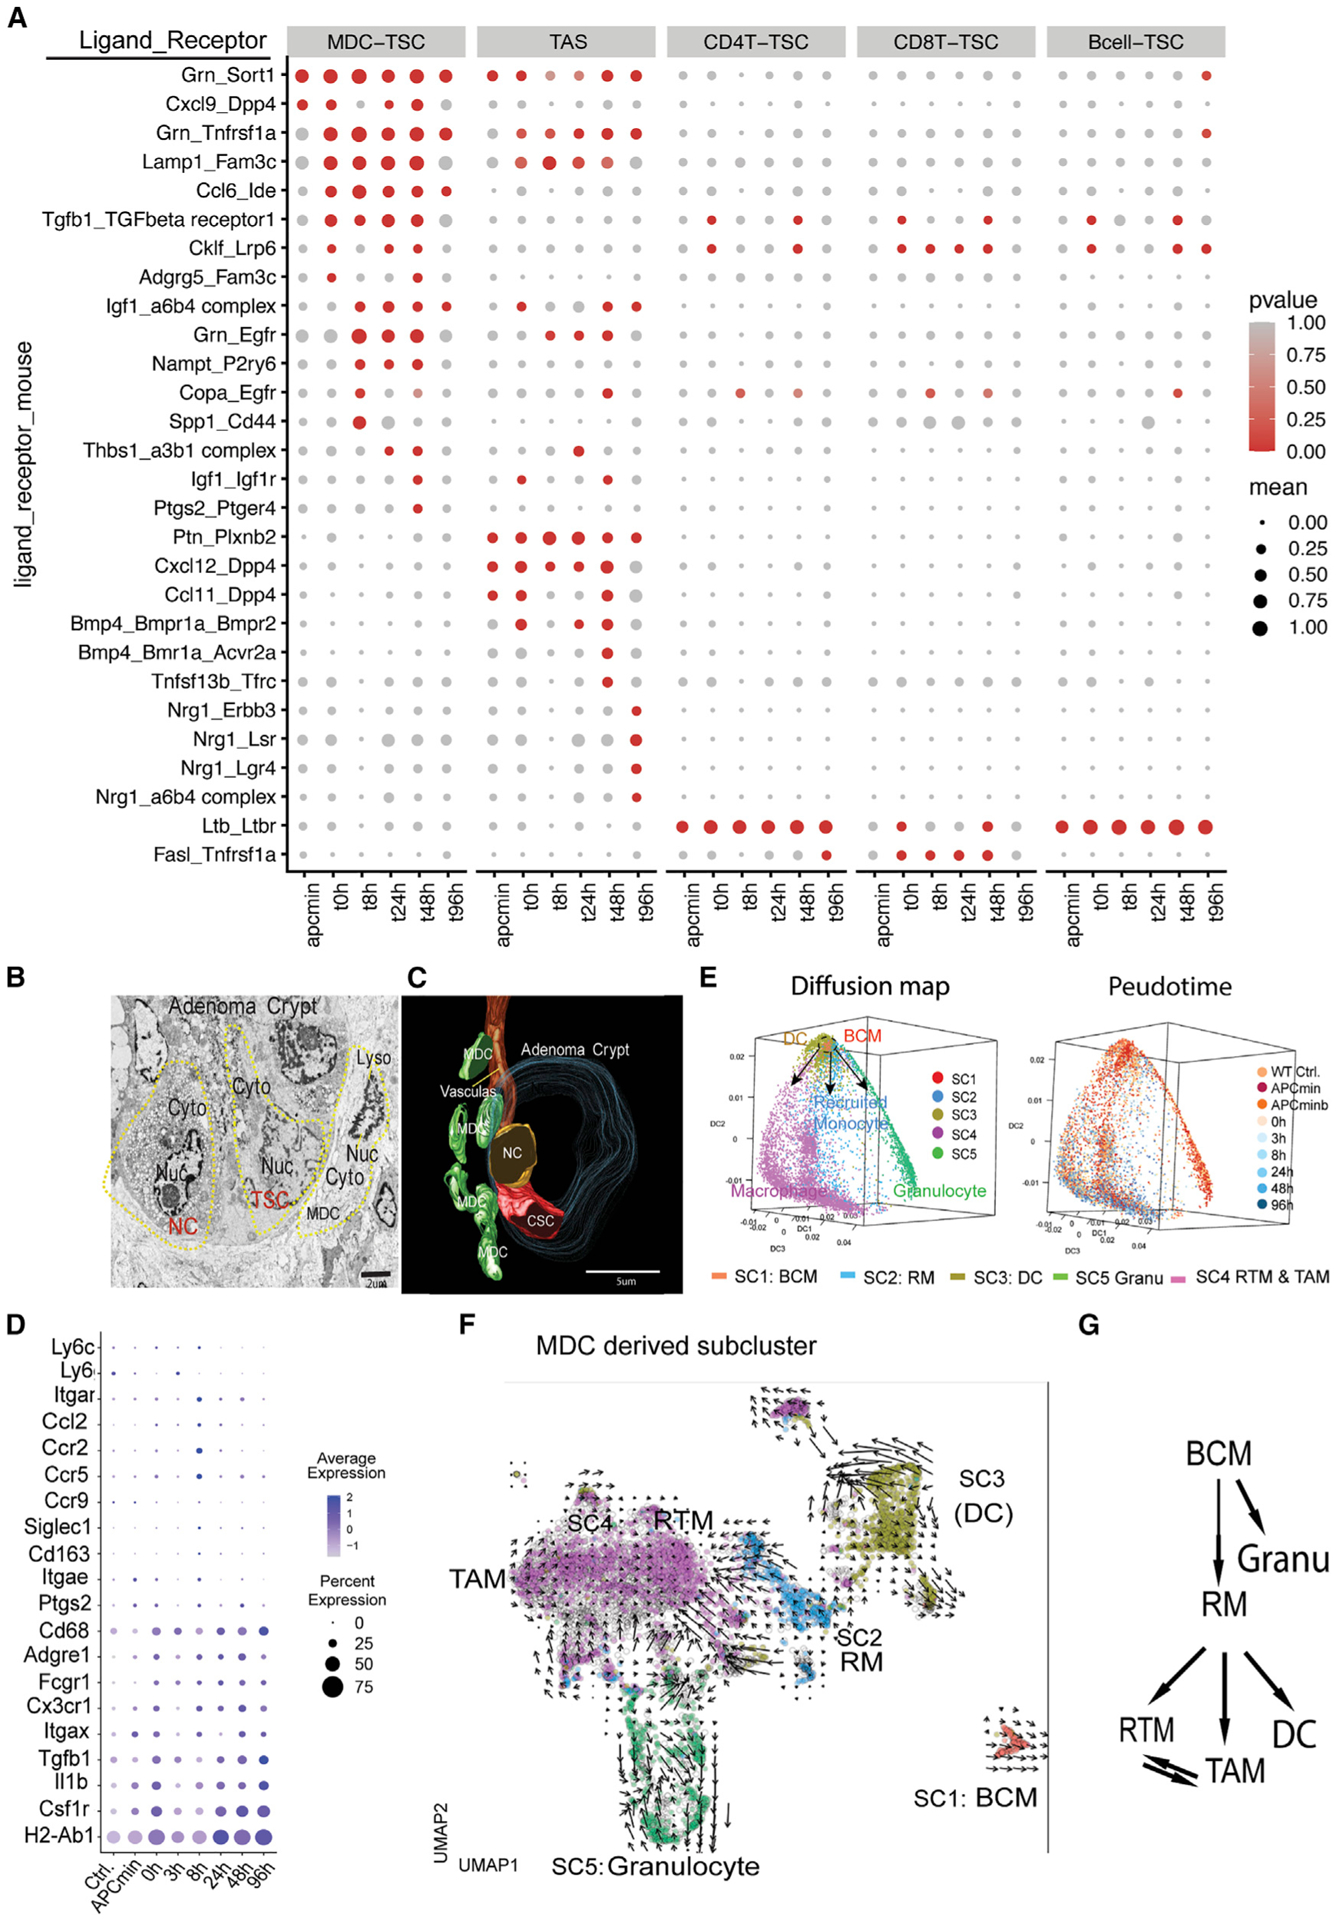
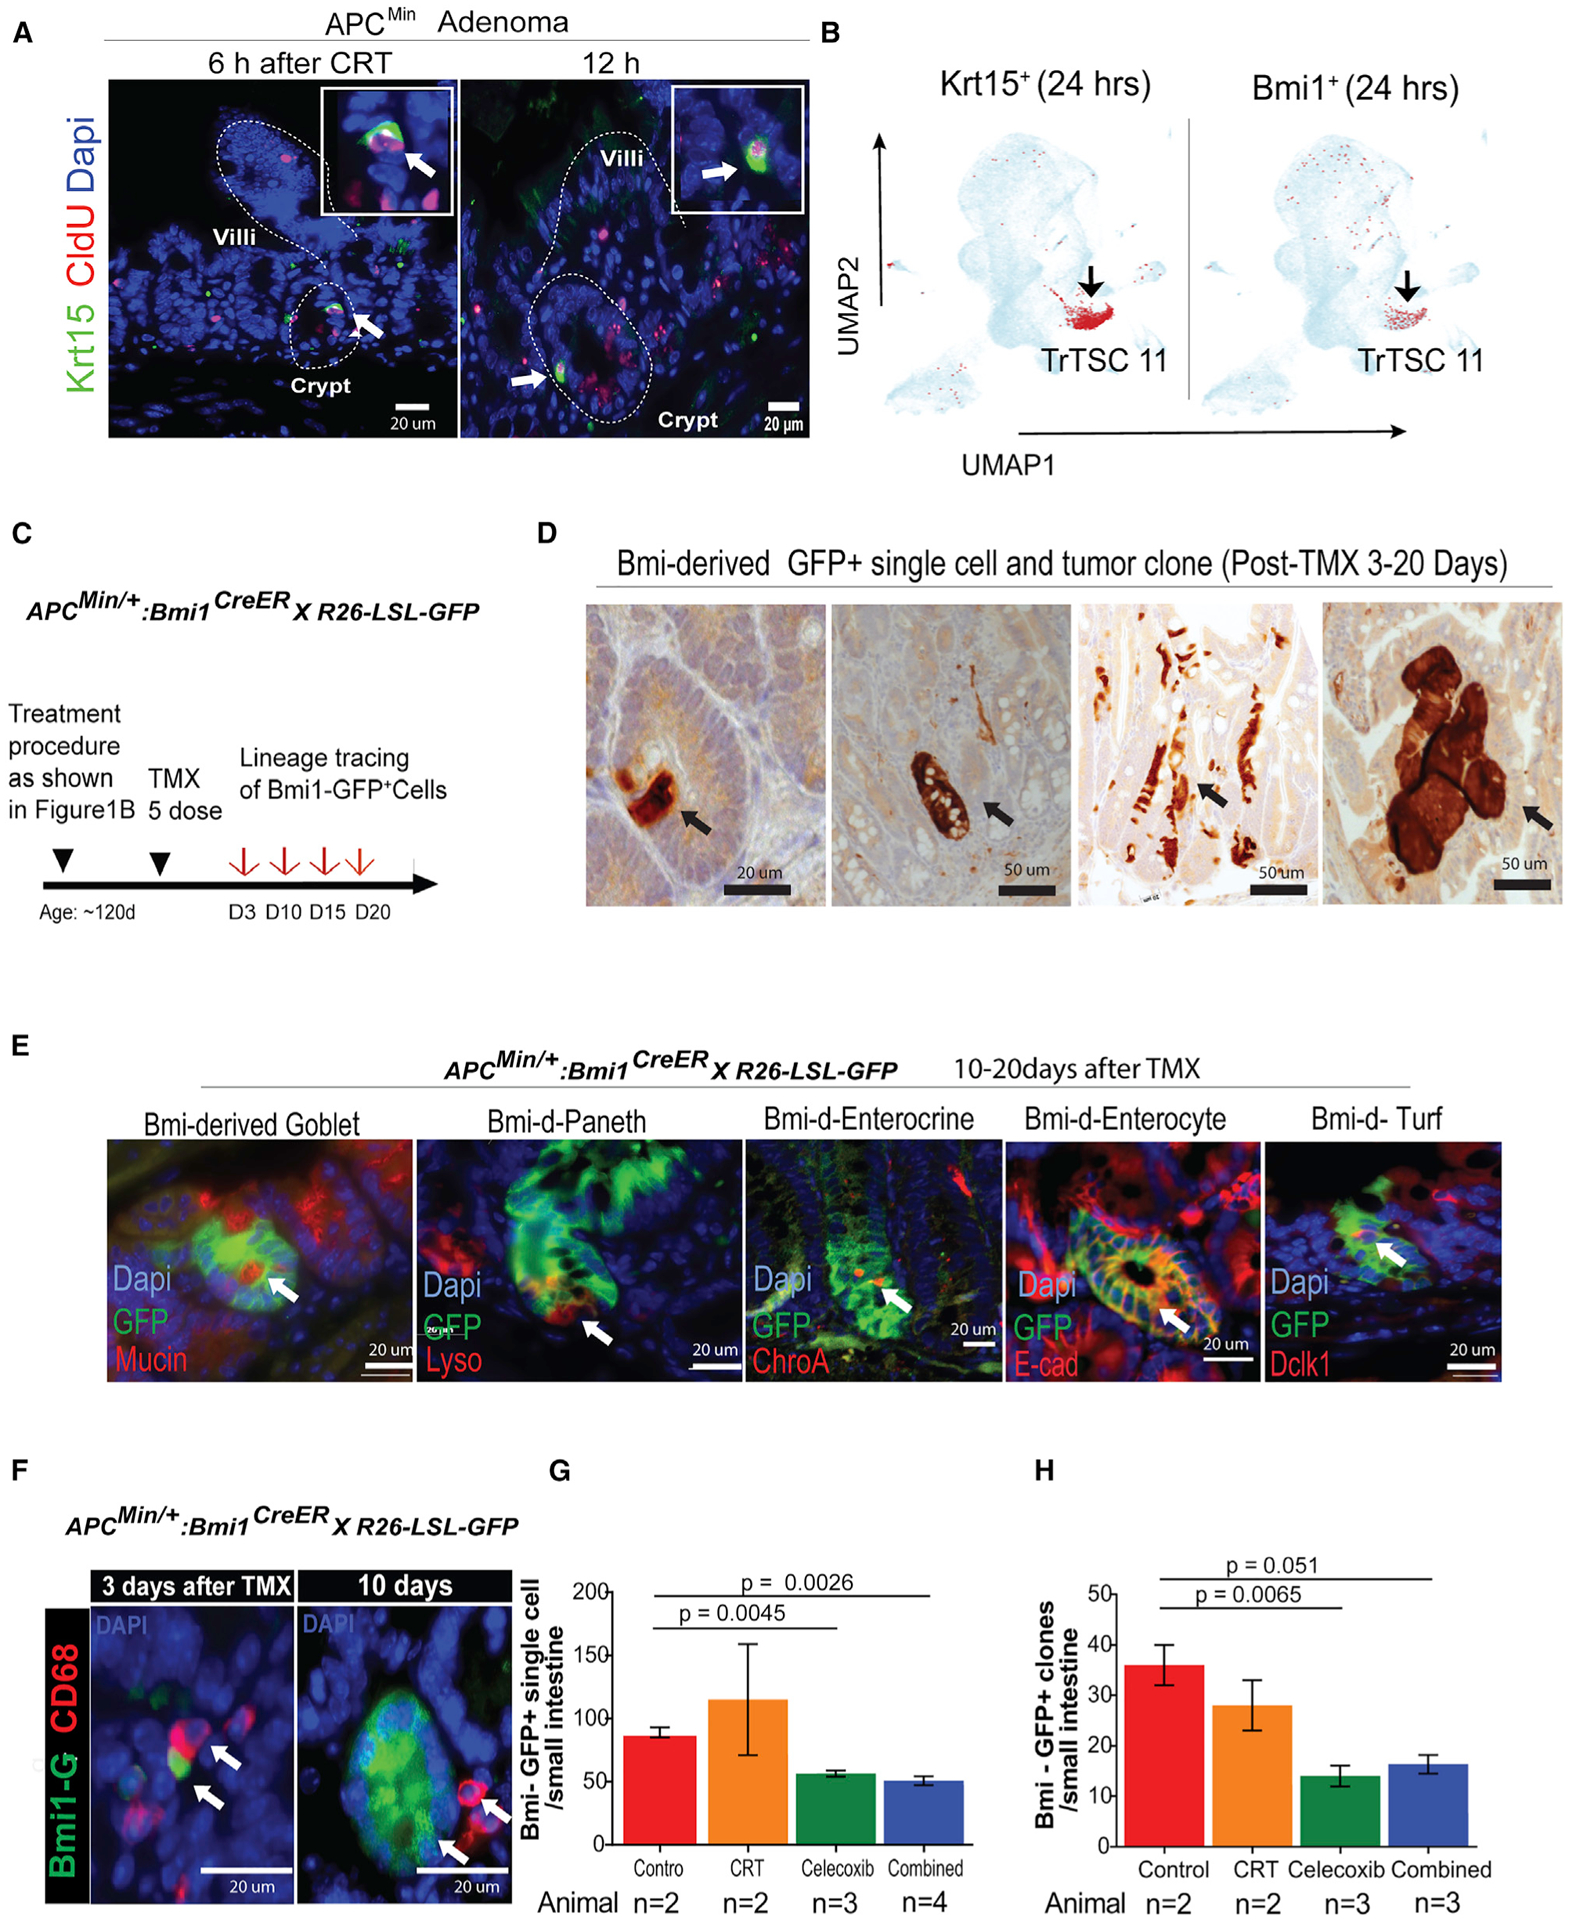
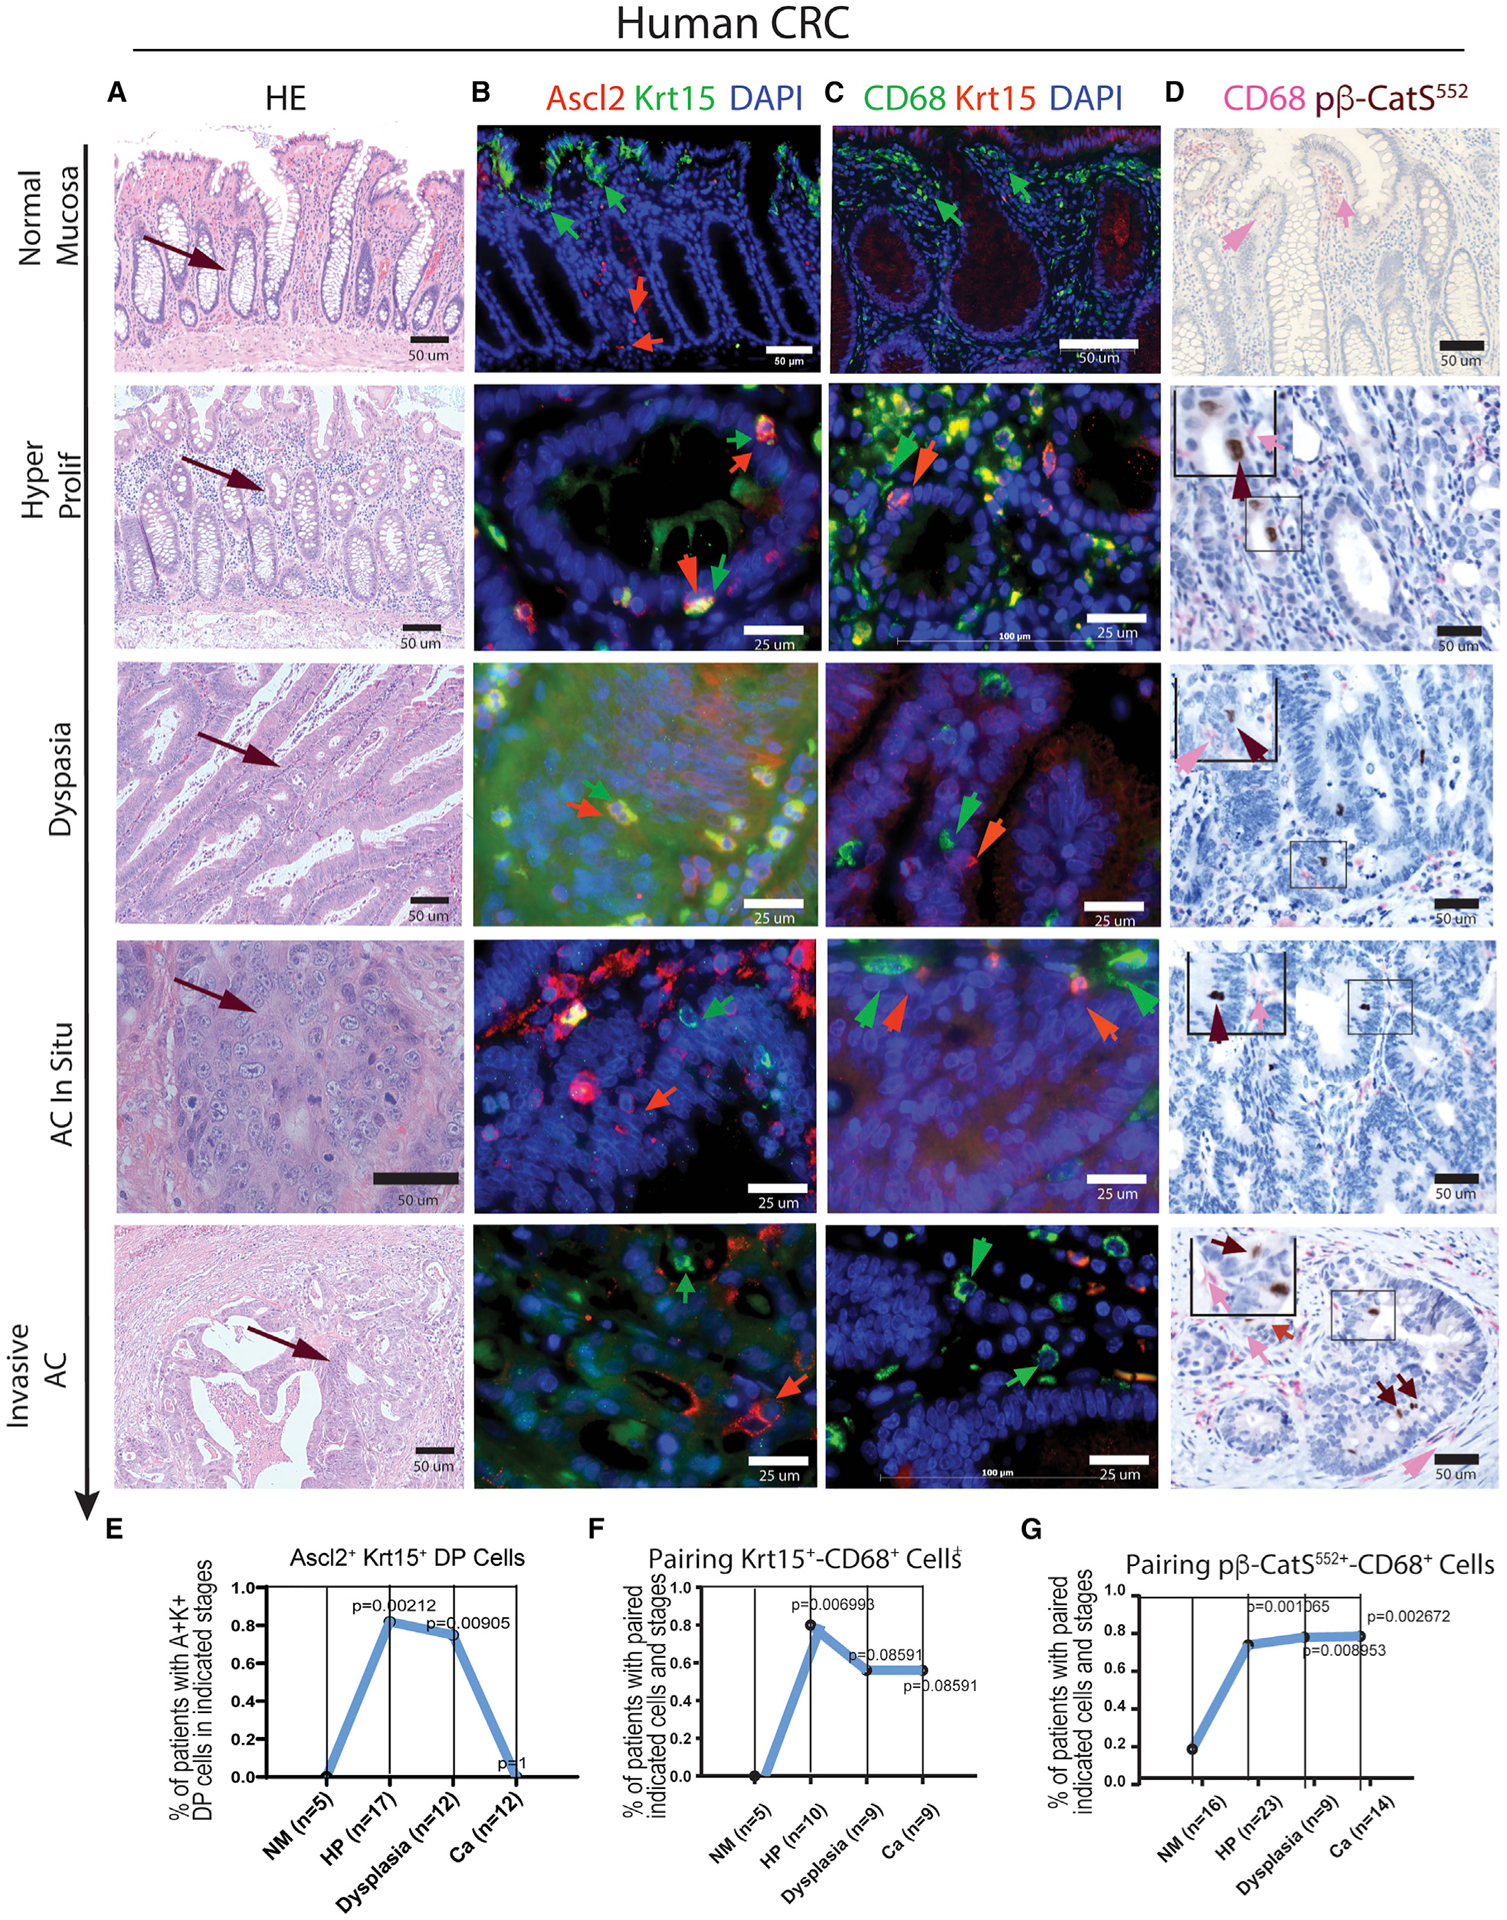
Tumor-initiating stem cells (TSCs) are critical for drug resistance and immune escape. However, the mutual regulations between TSC and tumor microenvironment (TME) remain unclear. Using DNA-label retaining, single-cell RNA sequencing (scRNA-seq), and other approaches, we investigated intestinal adenoma in response to chemoradiotherapy (CRT), thus identifying therapy-resistant TSCs (TrTSCs). We find bidirectional crosstalk between TSCs and TME using CellPhoneDB analysis. An intriguing finding is that TSCs shape TME into a landscape that favors TSCs for immunosuppression and propagation. Using adenoma-organoid co-cultures, niche-cell depletion, and lineaging tracing, we characterize a functional role of cyclooxygenase-2 (Cox-2)-dependent signaling, predominantly occurring between tumor-associated monocytes and macrophages (TAMMs) and TrTSCs. We show that TAMMs promote TrTSC proliferation through prostaglandin E2 (PGE2)-PTGER4(EP4) signaling, which enhances β-catenin activity via AKT phosphorylation. Thus, our study shows that the bidirectional crosstalk between TrTSC and TME results in a pro-tumorigenic and immunosuppressive contexture.

Keywords: C5AR1; CD74; EP4; MIF; Pge2; RPS19; immune barrier; mciroenvironment; niche; resistance; stem cell.


Conflict of interest statement

Declaration of interests The authors declare no competing interests.

Figures

Figure 1.
Figure 1.. CRT induced, but celecoxib prevented, adenoma progression and different responses of slow-cycling and active-cycling tumor cells to CRT
(A) Determining the rate and time frame of adenoma formation and development in ApcMin/+ mice. (B) The procedures of CRT, celecoxib, and the combined therapies with the two. (C) Images of tumors with different therapies. (D and E) Measurement of adenoma size and number with different therapies. (F) Pathohistological studies using H&E staining to monitor the progression or prevention of adenoma induced by CRT or celecoxib. (G) Image showing division of slow-cycling cells. (H–J) Measurement of percentage changes of active-cycling (H), slow-cycling (I), and activation of slow-cycling (J) tumor cells, respectively, in response to CRT. Ordinary one-way ANOVA multile comparisons with post-hoc t-tests (A,D,E), Means+/−SD. Data represent means with SD from a pool of section images with two to three independent experiments (H,I,J).
Figure 2.
Figure 2.. Analyses of therapy-resistant (Tr) cell population and TME cellular components using scRNA-seq approach
(A) The experimental procedure for single-cell harvest from adenoma, EpC versus MC separation, and scRNA-seq analysis. (B) UMAP analysis of scRNA-seq data combining all cells isolated during CRT. (C) Percentage of different cell types as indicated between WT control and adenoma (Apcmin), as well as during CRT. (D) Heatmap of known genes for categorizing different cell groups. (E) Expression pattern of some representative genes in UMAP.
Figure 3.
Figure 3.. Identification of genes predominantly expressed in TrTSCs
(A) TSC clusters 0, 8, and 11 and distribution of epithelial lineages produced by TSCs. (B) Overall responses of different cell types to CRT and TrTSC population. (C) Trajectory analysis of epithelial fraction of adenoma between 8 and 96 h after CRT. (D and E) Determining Lgr5hi and Lgr5lo cell subsets and their corresponding changes during CRT. (F) Dot blot analysis of a list of genes with information of cell numbers and gene levels.
Figure 4.
Figure 4.. Analysis of TME-TSC signaling modules by CellPhoneDB and MDC subclusters (SCs)
(A) Signaling modules indicated by ligand-receptor pairing between TME cellular components and TSCs identified using CellPhoneDB. (B and C) Recruiting of TAMMs to the TSC niche revealed by TEM (B) and 3D-SEM (C). (D) Dot plot showing representative gene expression within MDCs during CRT. (E) Diffusion map and time change related to SCs in MDCs with the genes in each SC listing in Table S1. (F) Trajectory analysis of SCs of MDCs using RNA velocity program. (G) Lineage relationship between different MDC subpopulations indicated by combining diffusion map and RNA velocity analyses.
Figure 5.
Figure 5.. Roles of TAMMs in supporting organoid culture in vitro and tumor growth in vivo
(A and B) Images of growth changes in the co-culture of adenoma-derived organoids with or without M-MDCs and with or without adding EP4 and COX-2 inhibitors (A), and the quantification of organoid mass (= No. × area) under different conditions. This quantification was based on two independent experiments each with multiple replicates. Each experiment was normalized to the mean of the crypt-only group, and then two experiments were subject to statistical analysis. Two-way ANOVA with post hoc test was used to compare group means. (B). For normalized mass data: we fit a two-way ANOVA model with all data from two experiments. Then, post-hoc t-tests were performed to test specific comparisons of interest. P-values were adjusted using the sidak method. The same experiment was repeated two times at different times and data are Mean+/− SEM. (C and D) IF assay of crypt budding and p-ßcatS552 detection (C), and western blot analyses of the p-ßcatS552 protein level in organoid culture with or without adding inhibitors (D). (E and F) Flow cytometry analysis of RMs (E) and TAMs (F) and inhibition of Cox-2 reduced both RMs and TAMs. T-tests with Means +/− SD. (G) Dot plot showing gene expression associated with RM and TAMs. (H) Adenoma growth was substantially reduced by Clodrosome compared with Encapsome. (I–K) Clodrosome caused significant depletion of CD11bintCX3CR1+ cells, which was shown to be Ly6cMHCII+, thus fitting the definition of TAMs (B). H-K, T-tests with Welch’s correction Means +/−SD.
Figure 6.
Figure 6.. Testing a role of PGE2 signaling in promoting TSCs propagation and tumorigenesis using lineage tracing assay
(A) IF co-staining of TrCSC markers Krt15 (green) with CldU+ (red) slow-cycling cells. (B) Predominant expression of Krt15 or Bmi1 in TSC C11 at 24 h after CRT. (C) The procedure for marking Bmi1-Cre-derived single TSCs. (D) IH tracing Bmi1-derived tumor clones (brown). (E) Lineage tracing showing that Bmi1-CreER-derived clones include all four epithelial lineages in intestine. (F) After TMX induction, association of CD68+ with Bmi1+ (green) single cells and Bmi1-derived tumor clones. (G) Percentage of Bmi1+ single cells per small intestine with different therapies (*n = 2–4 mice). (H) Quantification of Bmi1-Cre-derived tumor clones per small intestine with different therapies (*n = 2–3 mice). *Because of the COVID-19 pandemic, the mouse experiment to increase the control group of animal number in the Bmi1-CreER:R26LSL-GFP:ApcMin/+-induced lineage assay was affected. T-tests, Means+/−SD.
Figure 7.
Figure 7.. Examination of TrTSC/CSC markers and the association of MDCs with TSC/CSC at different adenoma progression and cancer stages in sections from human CRC patients using IH/IF assay
(A–D) H&E staining shows the pathological feature of adenoma progression and cancer stages in sections of human CRC (A). With the corresponding sections, the following panels show (B) IF co-staining of markers Krt15 and Ascl2, (C) IF co-staining of CD68 and Krt15, and (D) IHC co-staining of p-β-catS552 and CD68. (E–G) Statistical analysis of the significance of correlation for detection of Krt15+Ascl2+ TrTSCs (E), association of CD68+ MDCs with Krt15+ TSCs (F), or association of CD68+ MDCs with p-β-catS552 TSCs/CSCs in the corresponding stages in human CRCs (G). Fisher’s exact test was used to test whether the percentage of double-positive samples in HM differed from the ones on the other stages.

References

    1. Aoki T, Frȍsen J, Fukuda M, Bando K, Shioi G, Tsuji K, Ollikainen E, Nozaki K, Laakkonen J, and Narumiya S (2017). Prostaglandin E2-EP2-NF-κB signaling in macrophages as a potential therapeutic target for intracranial aneurysms. Sci. Signal 10, eaah6037. - PubMed
    1. Arneth B (2019). Tumor Microenvironment. Medicina (Kaunas) 56, 15. - PMC - PubMed
    1. Asfaha S, Hayakawa Y, Muley A, Stokes S, Graham TA, Ericksen RE, Westphalen CB, von Burstin J, Mastracci TL, Worthley DL, et al. (2015). Krt19(+)/Lgr5(−) Cells Are Radioresistant Cancer-Initiating Stem Cells in the Colon and Intestine. Cell Stem Cell 16, 627–638. - PMC - PubMed
    1. Ayyaz A, Kumar S, Sangiorgi B, Ghoshal B, Gosio J, Ouladan S, Fink M, Barutcu S, Trcka D, Shen J, et al. (2019). Single-cell transcriptomes of the regenerating intestine reveal a revival stem cell. Nature 569, 121–125. - PubMed
    1. Bankaitis ED, Ha A, Kuo CJ, and Magness ST (2018). Reserve Stem Cells in Intestinal Homeostasis and Injury. Gastroenterology 155, 1348–1361. - PMC - PubMed

Publication types