. 2021 Sep 7;36(10):109595.
doi: 10.1016/j.celrep.2021.109595.

Chronic stress primes innate immune responses in mice and humans

Affiliations

Chronic stress primes innate immune responses in mice and humans

Tessa J Barrett et al. Cell Rep. .

Abstract

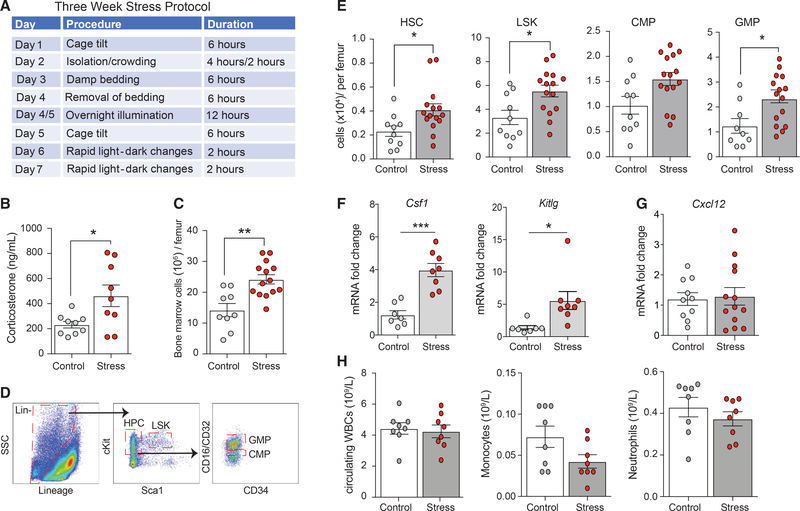
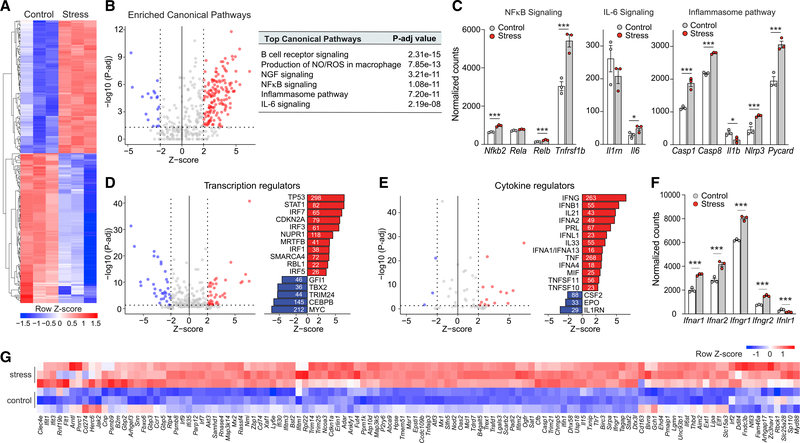
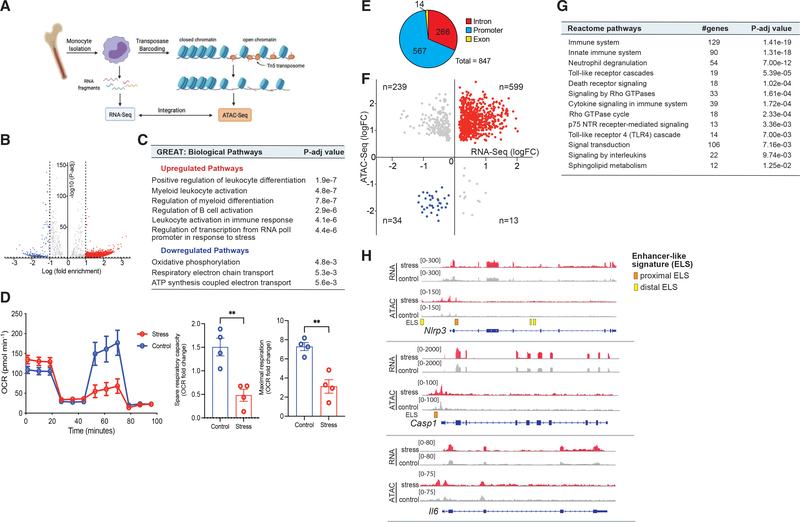
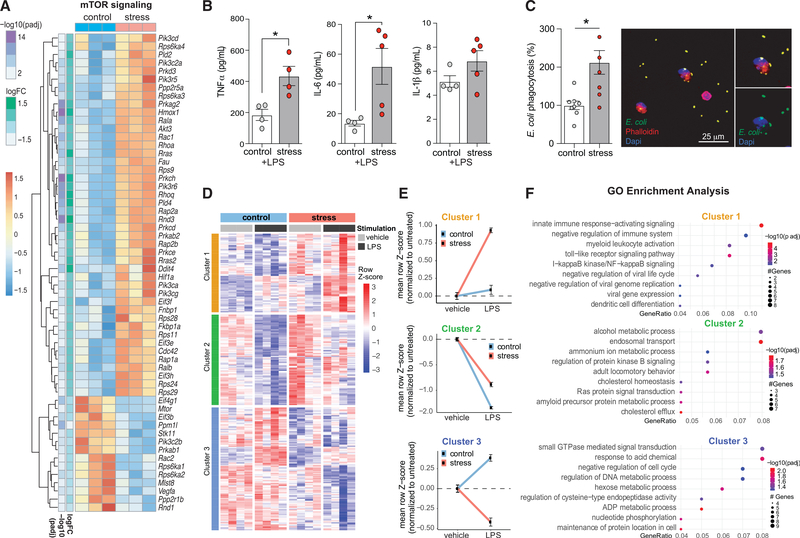
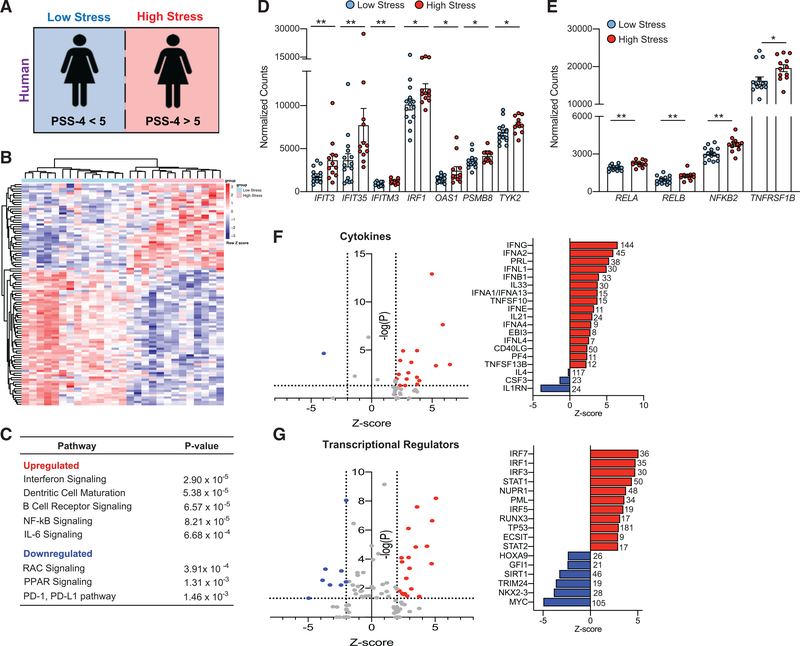
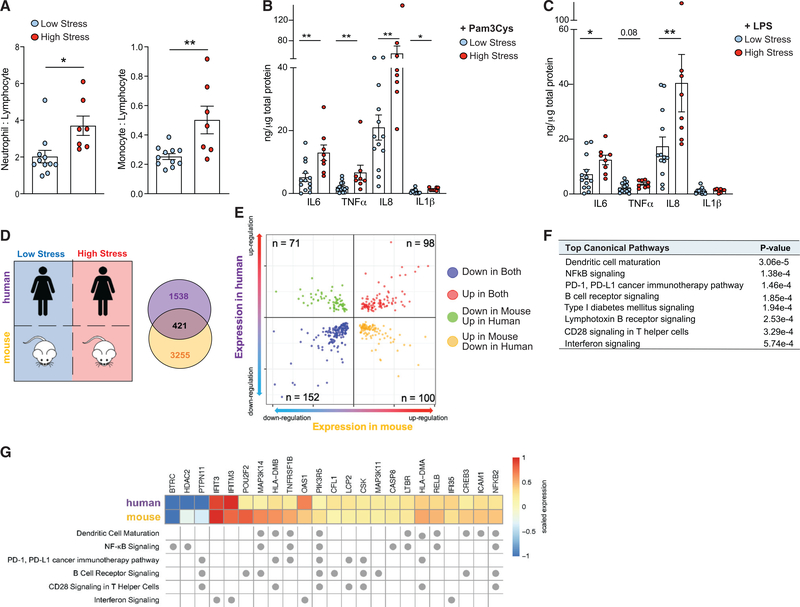
Psychological stress (PS) is associated with systemic inflammation and accelerates inflammatory disease progression (e.g., atherosclerosis). The mechanisms underlying stress-mediated inflammation and future health risk are poorly understood. Monocytes are key in sustaining systemic inflammation, and recent studies demonstrate that they maintain the memory of inflammatory insults, leading to a heightened inflammatory response upon rechallenge. We show that PS induces remodeling of the chromatin landscape and transcriptomic reprogramming of monocytes, skewing them to a primed hyperinflammatory phenotype. Monocytes from stressed mice and humans exhibit a characteristic inflammatory transcriptomic signature and are hyperresponsive upon stimulation with Toll-like receptor ligands. RNA and ATAC sequencing reveal that monocytes from stressed mice and humans exhibit activation of metabolic pathways (mTOR and PI3K) and reduced chromatin accessibility at mitochondrial respiration-associated loci. Collectively, our findings suggest that PS primes the reprogramming of myeloid cells to a hyperresponsive inflammatory state, which may explain how PS confers inflammatory disease risk.

Trial registration: ClinicalTrials.gov NCT03022552.

Keywords: inflammation; metabolism; monocytes; priming; psychological stress; women.


Conflict of interest statement

Declaration of interests M.N. has received funds or material research support from Lilly, Alnylam, Biotronik, CSL Behring, GlycoMimetics, GSK, Medtronic, Novartis, and Pfizer, as well as consulting fees from Biogen, Gimv, IFM Therapeutics, Molecular Imaging, Sigilon, and Verseau Therapeutics. H.R.R. receives in-kind donations for research from Abbott Vascular, Siemens, and BioTelemetry. All of the other authors declare no competing interests.

Figures

Figure 1.
Figure 1.. Chronic variable stress activates hematopoiesis in mice
(A) Experimental outline of 3-week chronic variable stress protocol. (B) Circulating corticosterone levels in control (white circles) and stressed (red circles) mice at the end of the 3-week chronic variable stress protocol. (C and D) Total bone marrow cell count (C) and characterization of hematopoietic and stem cell populations by flow cytometry (D) in the bone marrow of stressed and control mice. (E) Levels of hematopoietic progenitor cells (HPCs), LinSca1+cKit+ (LSK), common myeloid progenitors (CMPs), and granulocyte macrophage progenitors (GMPs) in the bone marrow of stressed and control mice. (F and G) Relative mRNA levels of (F) the cytokine macrophage colony-stimulating factor (Mcsf) and stem cell factor (Scf), and (G) the retention factor Cxcl12 in the bone marrow of stressed and control mice. (H) Circulating white blood cell (WBC), monocyte, and neutrophil counts in stressed and control mice. Data are the means ± SEMs. p values were calculated using a Mann-Whitney t test; *p ≤ 0.05, **p ≤ 0.01, ***p ≤ 0.001. n = 3–15 mice/group.
Figure 2.
Figure 2.. Chronic variable stress leads to transcriptome reprogramming in mouse monocytes
(A) RNA-seq heatmap displaying differentially expressed transcripts (adjusted p < 0.05 and |log2FC| > 1.5) between monocytes isolated from mice exposed to chronic variable stress and nonstressed control mice (n = 3 mice/group). (B) Top canonical pathways of genes upregulated in monocytes from stressed versus control mice (p < 0.01). (C) Normalized expression counts of genes in the NF-κB, IL-6, and inflammasome signaling pathways in monocytes from stressed and control mice. (D and E) Ingenuity Pathway Analysis of predicted upstream (D) transcriptional and (E) cytokine regulators of genes differentially expressed in monocytes from stressed versus control mice. The number next to each bar represents genes in our dataset that have a measurement direction consistent with the activation of that transcriptional regulator. (F) Normalized expression counts of interferon receptor-related genes in monocytes from stressed and control mice. (G) Heatmap showing RNA-seq normalized gene expression values of interferon-stimulated genes (row Z score) in monocytes isolated from the bone marrow of stressed or control mice (n = 3). Data in (C) and (F) are means ± SEMs. p values were calculated using a Mann-Whitney test; *p ≤ 0.05, ***p ≤ 0.001.
Figure 3.
Figure 3.. Epigenetic reprogramming of inflammatory gene loci by stress
(A) Experimental design of assay for transposase-accessible chromatin with high-throughput sequencing (ATAC-seq) of bone marrow monocytes from control and stressed mice and integration with RNA-seq. (B) Volcano plot showing chromatin loci identified by ATAC-seq to be more (red) or less (blue) accessible in bone marrow monocytes from mice exposed to chronic variable stress versus control (n = 6, 3 mice/phenotype). (C) Biological pathways were identified using the genomic regions enrichment of annotations tool (GREAT) analysis of loci with increased and decreased accessibility following chronic stress. (D) Oxygen consumption rate (OCR) of monocytes isolated from the bone marrow of stressed or control mice (n = 4) and sequentially treated with oligomycin, carbonyl cyanide p-trifluoro-methoxyphenylhydrazone (FCCP), and rotenone plus antimycin (Rtn/AA). Quantification of spare and maximal respiration. (E) Pie chart showing distribution of open chromatin loci in genes overlapping in RNA-seq and ATAC-seq datasets. (F) Integration scatterplot showing overlap between chromatin accessibility (ATAC-seq) and gene expression (RNA-seq) in monocytes from stressed versus nonstressed mice. Differentially expressed (DE) genes adjusted p value < 0.05, FC > 1.5. (G) Reactome pathways of overlapping ATAC-seq peaks and RNA-seq reads that were activated or inhibited in stressed mice relative to control mice. (H) RNA-seq (top) and ATAC-seq (bottom) reads in bone marrow monocytes at the Nlrp3, Casp1, and Il6 loci. Enhancer-like sequences (ELSs) are indicated by boxed regions at bottom. Data in (D) are means ± SEMs. p values were calculated using a Mann-Whitney t test; **p ≤ 0.01 n = 4 mice/group.
Figure 4.
Figure 4.. Stress primes monocytes toward a hyperinflammatory phenotype characterized by alterations to metabolic processes, cytokine production, and efferocytotic capacity
Heatmap showing the RNA-seq gene expression profile of the mammalian target of rapamycin (mTOR) signaling pathway in monocytes from mice exposed to chronic variable stress or nonstressed mice (n = 3/phenotype). (B) Lipopolysaccharide (LPS) stimulated (10 ng/mL; 6 h) cytokine response of bone marrow monocytes isolated from mice exposed to chronic variable stress or nonstressed mice (n = 4–5 mice/phenotype). (C) Phagocytosis of E. coli bioparticles by bone marrow monocytes isolated from stressed and nonstressed mice (n = 6 per phenotype). (D) Gene expression heatmap of monocytes isolated from stressed and nonstressed mice, and subsequently stimulated with LPS (n = 4/group); DE genes defined from effect of stress treatment factor alone (297 genes, p < 0.01) segregate into 3 clusters using hierarchical clustering (cluster 1 = 80 genes, cluster 2 = 92 genes, cluster 3 = 125 genes). (E) Mean expression of genes in each cluster for stress and nonstressed (control) mice in both basal and LPS stimulation. (F) GO enrichment analysis was performed separately for each cluster using the ClusterProfiler package from BioConductor, using an adjusted p value cutoff of 0.05. Data in (B) and (C) are means ± SEMs. p values were calculated using a Mann-Whitney test; *p ≤ 0.05.
Figure 5.
Figure 5.. Stress alters the human blood transcriptional profile
(A) Study design: whole blood was collected from women in PAXgene Blood RNA tubes, and RNA isolated and analyzed by RNA-seq. At the time of enrollment, the stress of the participants was determined by the validated Perceived Stress Scale 4 (PSS-4) questionnaire. Subjects were stratified into those with low stress (PSS-4 < 5, n = 15) and those with high stress (PSS-4 > 5, n = 12). See demographics in Table S6. (B) Heatmap of the top 100 DE transcripts between low- and high-stress subjects, ranked by p value. Subjects and genes were hierarchically clustered with each row representing a single gene and each column representing an individual subject. (C) Canonical pathways upregulated and downregulated as determined by Ingenuity Pathway Analysis (IPA) of significantly DE transcripts in low-stress versus high-stress subjects (p < 0.05). (D and E) Expression of (D) interferon-related and (E) NF-κB-related transcripts DE in subjects with low and high stress. (F and G) IPA upstream analysis of predicted (F) cytokines and (G) transcriptional regulators of genes differentially expressed between subjects with high and low stress. The number next to each bar represents genes in our dataset that have a measurement direction consistent with the activation of that cytokine or transcriptional regulator. Data in (D) and (E) are means ± SEMs. p values were calculated using a Mann-Whitney t test; *p ≤ 0.05, **p ≤ 0.01.
Figure 6.
Figure 6.. Stress priming induces hyperinflammatory immune phenotype characterized by increased cytokine production
(A) Ratios of neutrophils to lymphocytes and monocytes to lymphocytes in peripheral blood of women enrolled in the HARP study (demographics, Table 1) stratified by low stress (PSS-4 < 5, n = 11) and high stress (PSS-4 > 5, n = 7). (B and C) Cytokine production in monocyte purified PBMCs from low stress and high stress subjects following stimulation with (B) Pam3Cys (10 μg/mL) or (C) LPS (10 ng/mL). Data are means ± SEMs. p values were calculated using a Mann-Whitney test; *p ≤ 0.05 relative to the low-stress group. (D) Comparison of human RNA-seq to mouse RNA-seq between high and low stress. Venn diagram depicting the 421-gene overlap in stress-induced differential gene expression in humans and mice. DE genes are defined by p < 0.05 in the human RNA-seq and adjusted p < 0.05 in the mouse RNA-seq. (E) Two-way volcano plot depicting overlap between human DE genes (y axis) and mouse DE genes (x axis); red dots indicate genes upregulated (n = 98) and blue dots indicate genes downregulated (n = 152) in both datasets. (F) Top common pathways of genes with concordant expression directionality in myeloid cells from chronically stressed humans and mice as determined by IPA (n = 250, 98 genes upregulated, 152 genes downregulated). (G) Heatmap of human and mouse mRNA expression values for genes found in the top enriched pathways common to high-stress mice and humans. Fold change of mRNA expression is scaled to represent relative maximum (1) and minimum (−1) expression of genes within each organism. Pathway assignment of genes is indicated by dots below the heatmap.

Comment in

  • Chronic stress and inflammation.
    Le Bras A. Le Bras A. Lab Anim (NY). 2021 Nov;50(11):309. doi: 10.1038/s41684-021-00884-y. Lab Anim (NY). 2021. PMID: 34697441 No abstract available.

References

    1. Ahmadi N, Hajsadeghi F, Mirshkarlo HB, Budoff M, Yehuda R, and Ebrahimi R (2011). Post-traumatic stress disorder, coronary atherosclerosis, and mortality. Am. J. Cardiol 108, 29–33. - PubMed
    1. Allton K, Jain AK, Herz HM, Tsai WW, Jung SY, Qin J, Bergmann A, Johnson RL, and Barton MC (2009). Trim24 targets endogenous p53 for degradation. Proc. Natl. Acad. Sci. USA 106, 11612–11616. - PMC - PubMed
    1. Andrews S (2010). FastQC: a quality control tool for high throughput sequence data, Available online at. http://www.bioinformatics.babraham.ac.uk/projects/fastqc.
    1. Arnold SV, Smolderen KG, Buchanan DM, Li Y, and Spertus JA (2012). Perceived stress in myocardial infarction: long-term mortality and health status outcomes. J. Am. Coll. Cardiol. 60, 1756–1763. - PMC - PubMed
    1. Barrat FJ, Crow MK, and Ivashkiv LB (2019). Interferon target-gene expression and epigenomic signatures in health and disease. Nat. Immunol. 20, 1574–1583. - PMC - PubMed

Publication types

Associated data