. 2021 Sep 7;36(10):109685.
doi: 10.1016/j.celrep.2021.109685.

Persistent mRNA localization defects and cell death in ALS neurons caused by transient cellular stress

Affiliations

Persistent mRNA localization defects and cell death in ALS neurons caused by transient cellular stress

Sebastian Markmiller et al. Cell Rep. .

Abstract

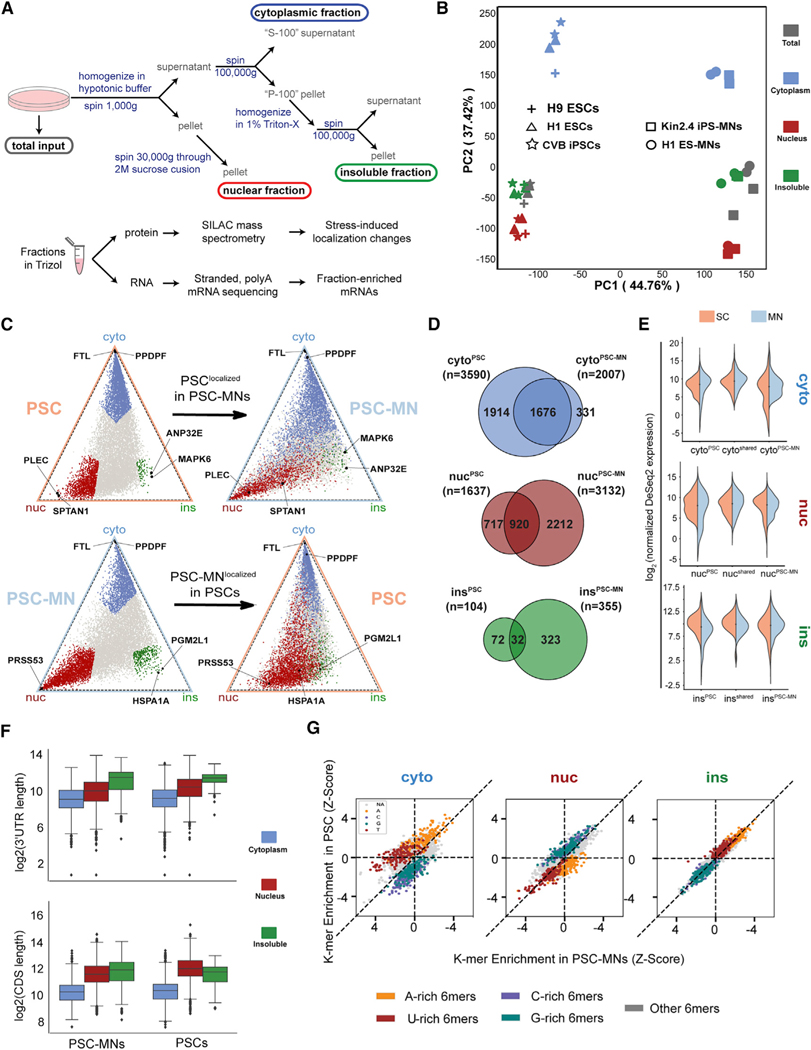
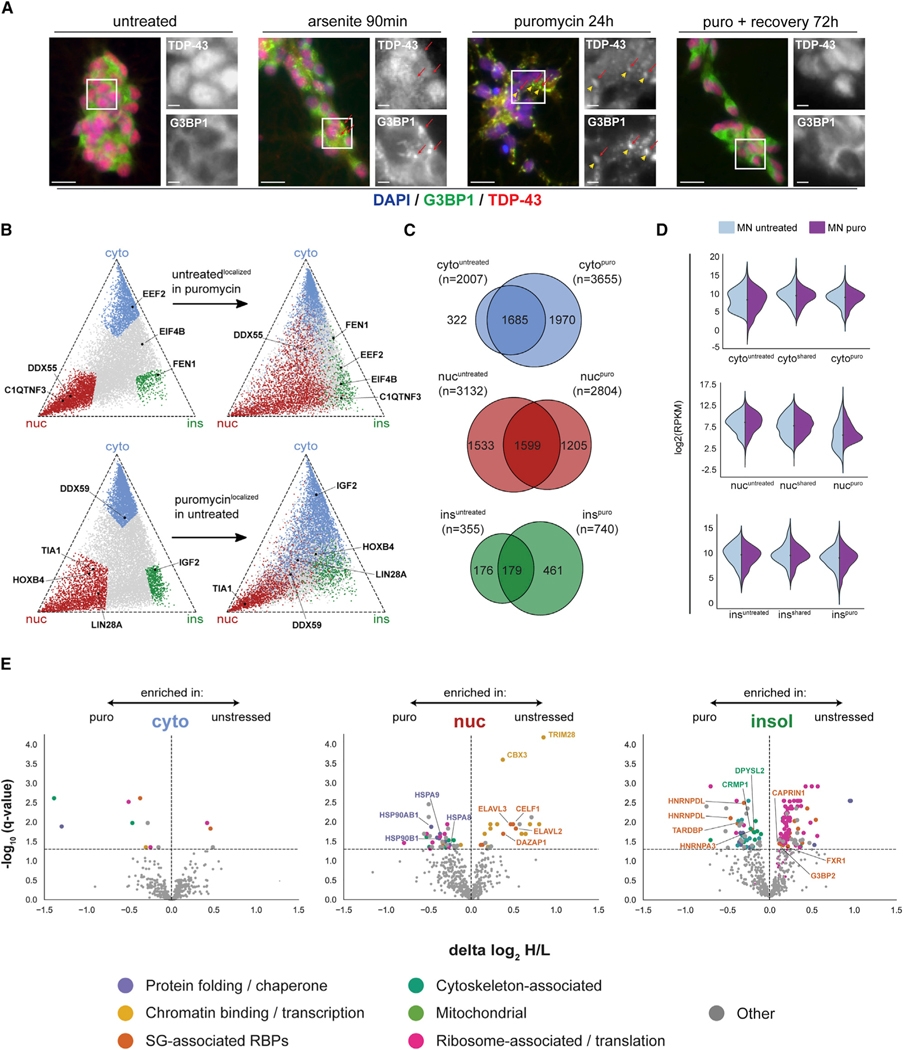
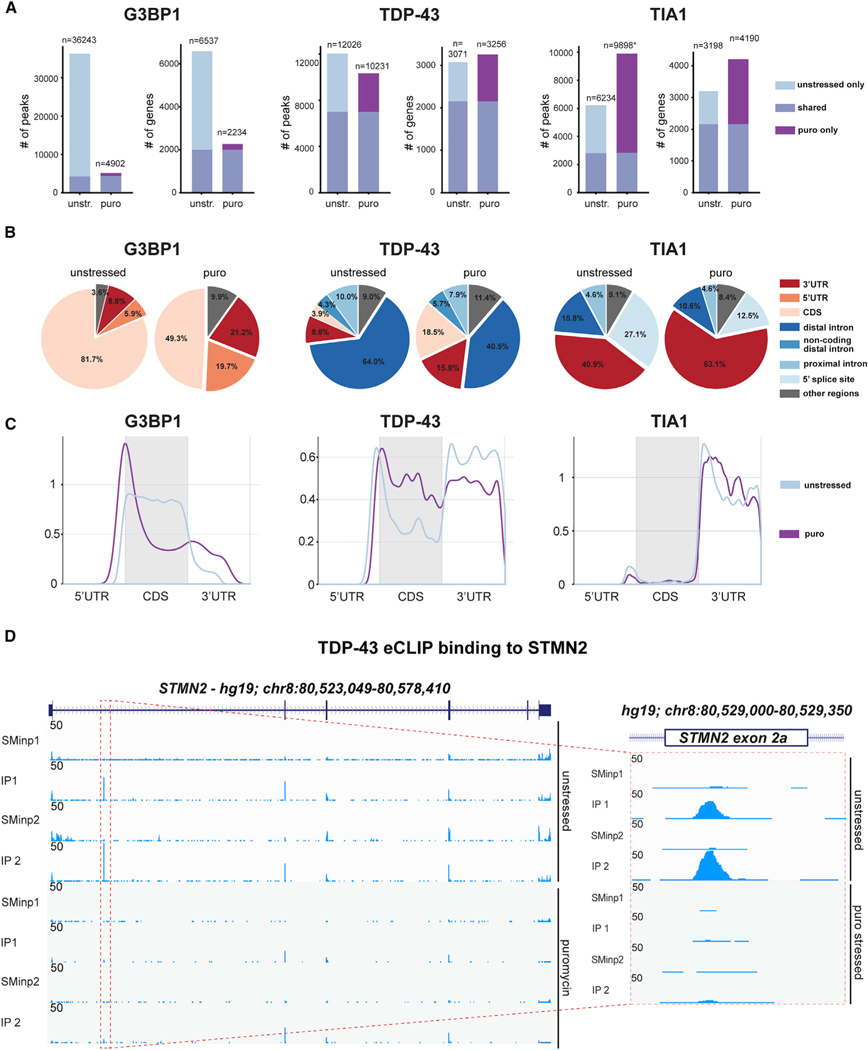
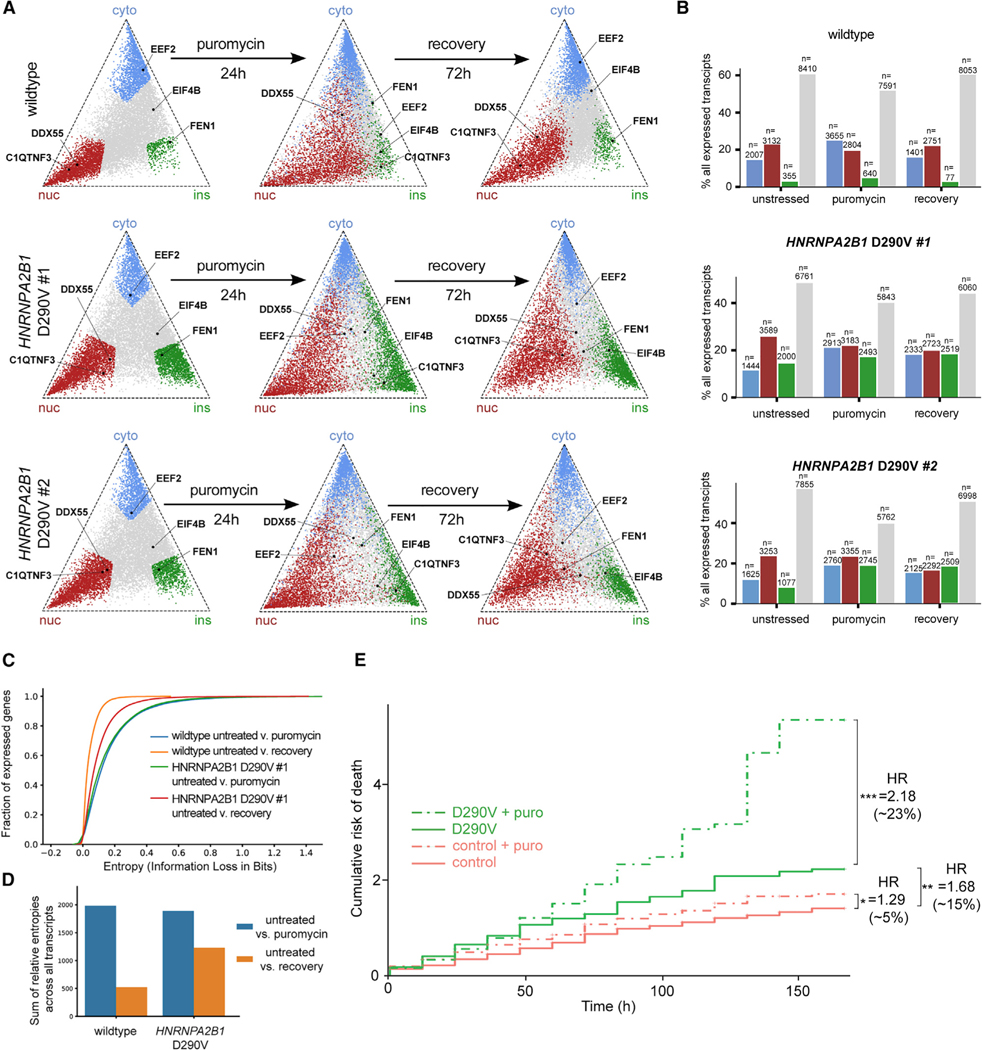
Persistent cytoplasmic aggregates containing RNA binding proteins (RBPs) are central to the pathogenesis of late-onset neurodegenerative disorders such as amyotrophic lateral sclerosis (ALS). These aggregates share components, molecular mechanisms, and cellular protein quality control pathways with stress-induced RNA granules (SGs). Here, we assess the impact of stress on the global mRNA localization landscape of human pluripotent stem cell-derived motor neurons (PSC-MNs) using subcellular fractionation with RNA sequencing and proteomics. Transient stress disrupts subcellular RNA and protein distributions, alters the RNA binding profile of SG- and ALS-relevant RBPs and recapitulates disease-associated molecular changes such as aberrant splicing of STMN2. Although neurotypical PSC-MNs re-establish a normal subcellular localization landscape upon recovery from stress, cells harboring ALS-linked mutations are intransigent and display a delayed-onset increase in neuronal cell death. Our results highlight subcellular molecular distributions as predictive features and underscore the utility of cellular stress as a paradigm to study ALS-relevant mechanisms.

Keywords: RNA localization; TDP-43; amyotrophic lateral sclerosis (ALS); cellular stress response; hnRNPA2B1; motor neurons; neurodegeneration; nucleocytoplasmic transport; protein aggregation; stress granules.


Conflict of interest statement

Declaration of interests G.W.Y. is co-founder, a member of the Board of Directors, a scientific advisor, equity holder, and paid consultant for Locanabio and Eclipse BioInnovations. G.W.Y. is a visiting professor at the National University of Singapore. The interest(s) of G.W.Y. have been reviewed and approved by the University of California-San Diego in accordance with its conflict-of-interest policies. The authors declare no other competing financial interests.

Figures

Figure 1.
Figure 1.. ceFRA-seq defines mRNA localization in pluripotent stem cells (PSCs) and pluripotent stem cell-derived motor neurons (PSC-MNs)
(A) Schematic of the cell fractionation and sample generation protocol. (B) Principal component analysis of ceFRA-seq data from PSCs and PSC-MNs. (C) Triangle plots visualizing the relative expression level of individual transcripts across the cytoplasmic, nuclear and insoluble fractions. Transcripts highlighted in blue (cyto), red (nuc), and green (ins) in the top panel are defined as fraction-enriched in PSCs. Transcripts highlighted in the bottom panel are defined as fraction-enriched in PSC-MNs. (D) Venn diagrams showing fraction-enriched transcripts in PSCs, PSC-MNs, or both. (E) Violin plots showing expression levels of transcripts that are fraction-enriched in PSCs only (left), in both PSCs and PSC-MNs (center), or in PSC-MNs only (F) Boxplots comparing the lengths of 30UTRs (top) and CDS (bottom) in fraction-enriched transcripts across PSCs and PSC-MNs. Error bars represent the 95% confidence interval, the bottom and top of the box represent the 25th and 75th percentiles, the line inside the box is the 50th percentile (median), and any outliers are shown as closed diamonds. (G) Scatterplots comparing enrichment of 6-mer sequence elements between PSCs and PSC-MNs across fractions. A/U/G/C-rich 6-mers are defined as containing 4 or more of the respective nucleotides within the 6-mer sequence. See also Figure S1 and Table S1.
Figure 2.
Figure 2.. Cellular stress induces widespread changes in subcellular mRNA and protein localization
(A) Immunofluorescence staining of PSC-MNs that were left untreated, treated with NaAsO2 (250 mM) for 90 min, treated with puromycin (10 μg/mL) for 24 h, or treated with puromycin followed by washout and recovery in puromycin-free medium for 72 h. Cells were stained with antibodies against G3BP1 and TDP-43. G3BP1-positive SGs are indicated by red arrows. TDP-43-positive SGs are indicated by solid yellow arrowheads. Nuclei were stained using DAPI. Scale bars, 20 μm in all panels. (B) Triangle plots visualizing the relative expression level of individual transcripts across the cytoplasmic, nuclear and insoluble fractions. Transcripts highlighted in blue (cyto), red (nuc), and green (ins) in the top panel are defined as fraction-enriched in unstressed PSC-MNs. Transcripts highlighted in the bottom panel are defined as fraction-enriched in puromycin-stressed PSC-MNs. (C) Venn diagrams showing fraction-enriched transcripts in unstressed PSC-MNs, puromycin-stressed PSC-MNs, or both. (D) Violin plots showing expression levels of transcripts that are fraction-enriched in unstressed PSC-MNs only (left), in unstressed and puromycin-stressed PSC-MNs (center), or in puromycin-stressed PSC-MNs only. (E) Volcano plots showing statistically significant puromycin-induced changes in the enrichment of detected proteins in the cytoplasmic, nuclear, and insoluble fractions, respectively. Selected protein categories are highlighted in color as indicated. Statistically significant changes were identified using multiple unpaired t-test with an FDR cutoff of 0.05. See also Figures S2 and S3 and Tables S1 and S2.
Figure 3.
Figure 3.. eCLIP reveals both common and distinct stress-induced changes in target binding across SG-associated RNA binding proteins
(a) Bar graphs showing both the number of peaks and total transcripts bound by G3BP1 (left), TDP-43 (center), and TIA1 (right) in untreated and puromycin-stressed PSC-MNs, respectively. (B) Venn diagrams showing the proportions of binding peaks falling within distinct transcript regions for G3BP1, TDP-43, and TIA1 in untreated and puromycin-stressed PSC-MNs, respectively. (C) Metagene plots showing distribution of binding peak density across transcripts for G3BP1, TDP-43, and TIA1 in untreated and puromycin-stressed PSC-MNs, respectively. (D) Genome browser tracks illustrating changes in TDP-43 binding to exon 2a of the STMN2 mRNA in untreated and puromycin-stressed PSC-MNs, respectively. See also Table S3.
Figure 4.
Figure 4.. Stress-induced localization changes persist in the context of ALS-associated mutations
(A) Triangle plots visualizing the relative expression level of individual transcripts across the cytoplasmic, nuclear and insoluble fractions in wild-type PSC-MNs (top panel) and PSC-MNs derived from two individual cell lines harboring the HNRNPA2B1 C290V mutation (middle and bottom panel). Transcripts highlighted in blue (cyto), red (nuc), and green (ins) in the top panel are defined as fraction-enriched in unstressed wild-type PSC-MNs. Transcripts highlighted in the middle and bottom panels are defined as fraction-enriched in unstressed HNRNPA2B1 mutant PSC-MNs. (B) Bar graphs showing the distribution of fraction-enriched and non-localized transcripts in untreated (left), puromycin-stressed (center), and recovery (right) conditions in wild-type PSC-MNs (top panel) and PSC-MNs derived from two individual cell lines harboring the HNRNPA2B1 C290V mutation (middle and bottom panel). (C) Cumulative distribution plots showing relative entropies for all detected transcripts in the indicated comparisons between two conditions. (D) Bar graphs showing the sum of relative entropies for all detected transcripts when comparing untreated condition to puromycin stress (blue) or recovery (orange) condition in wild-type (left) or HNRNPA2B1 mutant (right) PSC-MNs. (E) Cumulative risk of death plots showing Cox proportional hazard analysis for control (red lines) and HNRNPA2B1 mutant (green lines) that were left unstressed (solid lines) or treated with puromycin for 24 h and then allowed to recover (broken lines). A hazard ratio above 1.0 indicates increased risk of death as compared to the untreated control lines from healthy individuals. See also Figure S4 and Table S1.

References

    1. Alami NH, Smith RB, Carrasco MA, Williams LA, Winborn CS, Han SSW, Kiskinis E, Winborn B, Freibaum BD, Kanagaraj A, et al. (2014). Axonal transport of TDP-43 mRNA granules is impaired by ALS-causing mutations. Neuron 81, 536–543. - PMC - PubMed
    1. Archbold HC, Jackson KL, Arora A, Weskamp K, Tank EM, Li X, Miguez R, Dayton RD, Tamir S, Klein RL, and Barmada SJ (2018). TDP43 nuclear export and neurodegeneration in models of amyotrophic lateral sclerosis and frontotemporal dementia. Sci. Rep 8, 4606. - PMC - PubMed
    1. Barmada SJ, Serio A, Arjun A, Bilican B, Daub A, Ando DM, Tsvetkov A, Pleiss M, Li X, Peisach D, et al. (2014). Autophagy induction enhances TDP43 turnover and survival in neuronal ALS models. Nat. Chem. Biol 10, 677–685. - PMC - PubMed
    1. Barmada SJ, Ju S, Arjun A, Batarse A, Archbold HC, Peisach D, Li X, Zhang Y, Tank EM, Qiu H, et al. (2015). Amelioration of toxicity in neuronal models of amyotrophic lateral sclerosis by hUPF1. Proc. Natl. Acad. Sci. USA 112, 7821–7826. - PMC - PubMed
    1. Benoit Bouvrette LP, Cody NAL, Bergalet J, Lefebvre FA, Diot C, Wang X, Blanchette M, and Lécuyer E. (2018). CeFra-seq reveals broad asymmetric mRNA and noncoding RNA distribution profiles in Drosophila and human cells. RNA 24, 98–113. - PMC - PubMed

Publication types

MeSH terms