. 2021 Sep 8;53(1):71.
doi: 10.1186/s12711-021-00665-8.

A simulation study of a honeybee breeding scheme accounting for polyandry, direct and maternal effects on colony performance

Affiliations

A simulation study of a honeybee breeding scheme accounting for polyandry, direct and maternal effects on colony performance

Tristan Kistler et al. Genet Sel Evol. .

Abstract

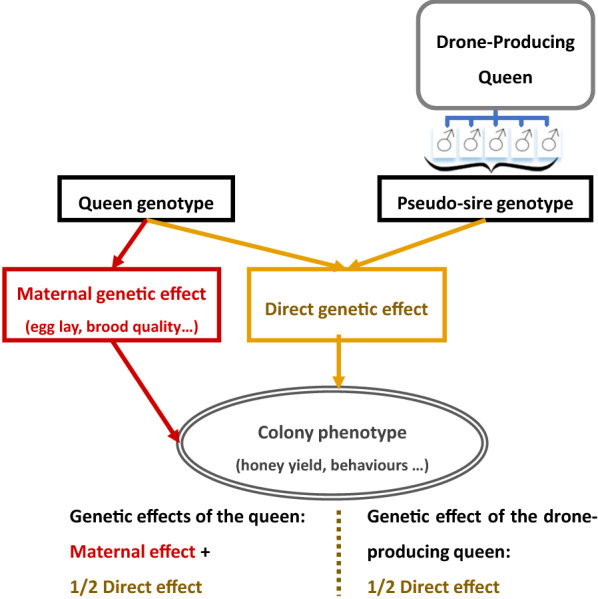
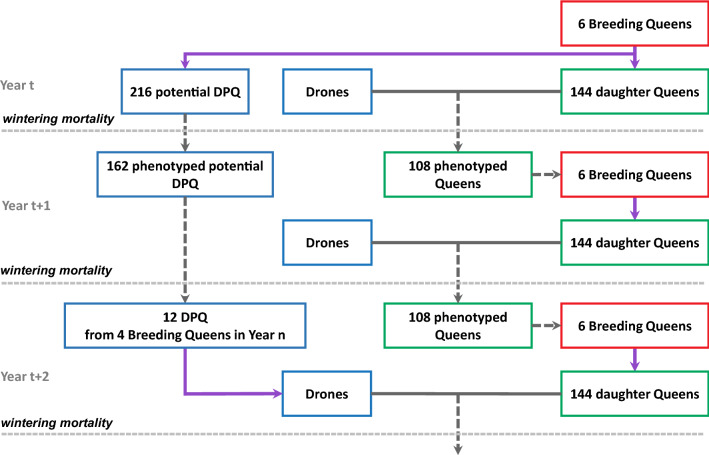
Background: Efficient breeding programs are difficult to implement in honeybees due to their biological specificities (polyandry and haplo-diploidy) and complexity of the traits of interest, with performances being measured at the colony scale and resulting from the joint effects of tens of thousands of workers (called direct effects) and of the queen (called maternal effects). We implemented a Monte Carlo simulation program of a breeding plan designed specifically for Apis mellifera's populations to assess the impact of polyandry versus monoandry on colony performance, inbreeding level and genetic gain depending on the individual selection strategy considered, i.e. complete mass selection or within-family (maternal lines) selection. We simulated several scenarios with different parameter setups by varying initial genetic variances and correlations between direct and maternal effects, the selection strategy and the polyandry level. Selection was performed on colony phenotypes.

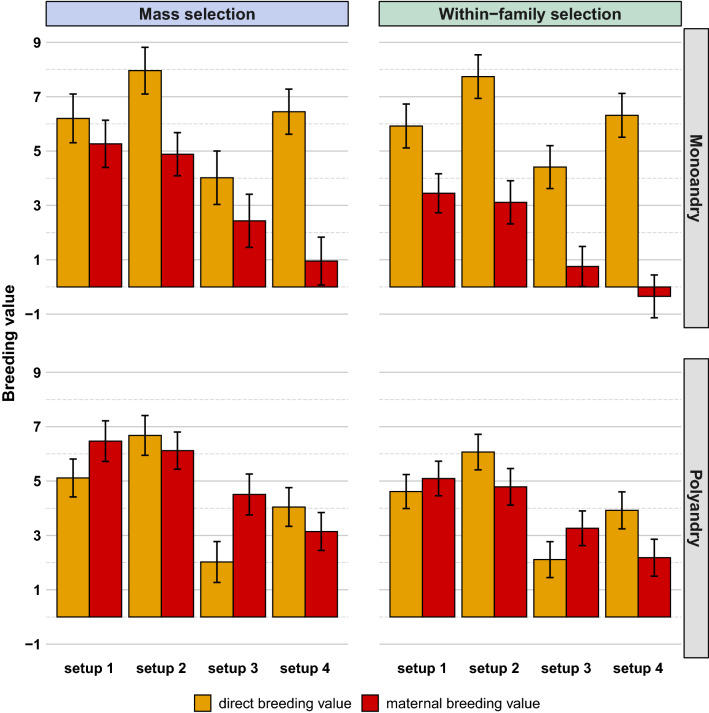
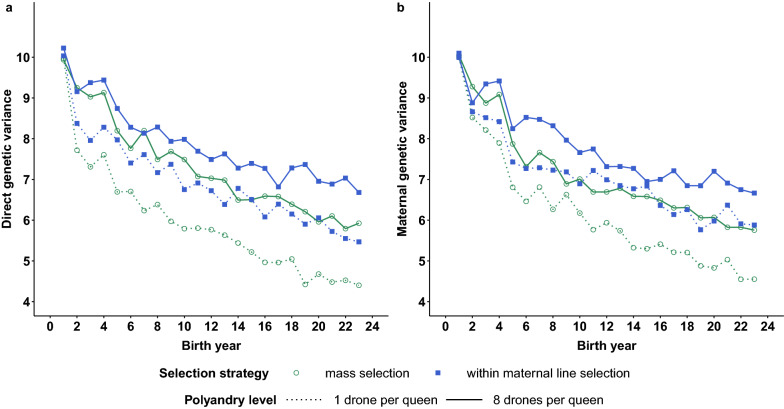
Results: All scenarios showed strong increases in direct breeding values of queens after 20 years of selection. Monoandry led to significantly higher direct than maternal genetic gains, especially when a negative correlation between direct and maternal effects was simulated. However, the relative increase in these genetic gains depended also on their initial genetic variability and on the selection strategy. When polyandry was simulated, the results were very similar with either 8 or 16 drones mated to each queen. Across scenarios, polyandrous mating resulted in equivalent or higher gains in performance than monoandrous mating, but with considerably lower inbreeding rates. Mass selection conferred a ~ 20% increase in performance compared to within-family selection, but was also accompanied by a strong increase in inbreeding levels (25 to 50% higher).

Conclusions: Our study is the first to compare the long-term effects of polyandrous versus monoandrous mating in honeybee breeding. The latter is an emergent strategy to improve specific traits, such as resistance to varroa, which can be difficult or expensive to phenotype. However, if used during several generations in a closed population, monoandrous mating increases the inbreeding level of queens much more than polyandrous mating, which is a strong limitation of this strategy.


Conflict of interest statement

The authors declare that they have no conflict of interest.

Figures

Fig. 1
Fig. 1
Description of the complex phenotype of a honeybee colony. The complex phenotype of the colony results from the activity of the queen and all the workers whose genotypes come from both the queen and the drone-producing queen (considered as a pseudo-sire, i.e. a virtual diploid sire)
Fig. 2
Fig. 2
Demographic diagram of the breeding population over three successive years. The breeding scheme shown here considers a small breeding population with six breeding queens producing daughter queens each year. Drones come from drone-producing queens (DPQ) that are the best phenotyped potential DPQ who survive the two winter periods (the 1st and 2nd winters in years t and t + 1 result in the random loss of 25 and 33% of all DPQ entering winter, respectively). Blue, green and red boxes refer to sires, potential breeding queens and breeding queens, respectively. Purple and solid grey arrows indicate genetic inheritance and mating, respectively. Dotted grey arrows refer to survival or selection events from one year to another
Fig. 3
Fig. 3
Evolution of the average inbreeding of queens under mass or within-maternal line selection with a monoandrous or polyandrous mating system. Inbreeding increases almost linearly from year 7 (after 4 years of closed-population breeding) onwards, with an annual increase of 1.1% in the within-maternal line selection scenario with polyandrous mating to 1.9% in the mass selection scenario with monoandrous mating, reaching 10% in years 14 and 8, respectively. The evolution of inbreeding levels under within-maternal line selection with monoandry and under mass selection with polyandry is very similar. In these two scenarios, inbreeding increases annually by 1.5% after year 7, reaching 10% in year 11. Bars represent 2 times the sampling standard deviation over the 160 simulation replicates
Fig. 4
Fig. 4
Direct and maternal average standardized breeding values of queens after 20 years of selection for all simulated scenarios. For each parameter setup, polyandry level and selection strategy, brown and red bars represent the direct and maternal average breeding values of queens after 20 years of selection, respectively. Deviation bars represent two times the sampling standard deviation over the 160 simulation replicates. For the setup parameters, see Table 1
Fig. 5
Fig. 5
Evolution of the average direct and maternal genetic parameters of queens under mass or within-maternal line selection with a monoandrous or polyandrous mating system. The evolution of the mean direct (a) genetic variance for the four scenarios of setup 1 is very similar to that of the mean maternal (b) genetic variance. Two significant decreases in variance take place between years 1 and 2 (first selection) and between years 4 and 5 (first selection in the closed population). Until year 4, the loss in direct and maternal genetic variance is essentially due to the Bulmer effect, whereas loss continues subsequently as inbreeding increases. Within-maternal line selection with polyandrous mating maintains the highest genetic variance, whereas mass selection with monoandrous mating induces the most severe losses. The within-maternal line selection with monoandry and mass selection with polyandry scenarios produced similar intermediate losses

Similar articles

Cited by

References

    1. van Wilgenburg E, Driessen G, Beukeboom LW. Single locus complementary sex determination in Hymenoptera: an" unintelligent" design? Front Zool. 2006;3:1. doi: 10.1186/1742-9994-3-1. - DOI - PMC - PubMed
    1. Zayed A, Packer L. Complementary sex determination substantially increases extinction proneness of haplodiploid populations. Proc Natl Acad Sci USA. 2005;102:10742–10746. doi: 10.1073/pnas.0502271102. - DOI - PMC - PubMed
    1. Adams J, Rothman ED, Kerr WE, Paulino ZL. Estimation of the number of sex alleles and queen matings from diploid male frequencies in a population of Apis mellifera. Genetics. 1977;86:583–596. doi: 10.1093/genetics/86.3.583. - DOI - PMC - PubMed
    1. Beye M, Hasselmann M, Fondrk MK, Page RE, Omholt SW. The gene csd is the primary signal for sexual development in the honeybee and encodes an SR-type protein. Cell. 2003;114:419–429. doi: 10.1016/S0092-8674(03)00606-8. - DOI - PubMed
    1. Hasselmann M, Beye M. Signatures of selection among sex-determining alleles of the honey bee. Proc Natl Acad Sci USA. 2004;101:4888–4893. doi: 10.1073/pnas.0307147101. - DOI - PMC - PubMed

LinkOut - more resources