. 2021 Sep 8;22(1):427.
doi: 10.1186/s12859-021-04334-x.

A novel automated image analysis pipeline for quantifying morphological changes to the endoplasmic reticulum in cultured human cells

Affiliations

A novel automated image analysis pipeline for quantifying morphological changes to the endoplasmic reticulum in cultured human cells

M Elena Garcia-Pardo et al. BMC Bioinformatics. .

Abstract

Background: In mammalian cells the endoplasmic reticulum (ER) comprises a highly complex reticular morphology that is spread throughout the cytoplasm. This organelle is of particular interest to biologists, as its dysfunction is associated with numerous diseases, which often manifest themselves as changes to the structure and organisation of the reticular network. Due to its complex morphology, image analysis methods to quantitatively describe this organelle, and importantly any changes to it, are lacking.

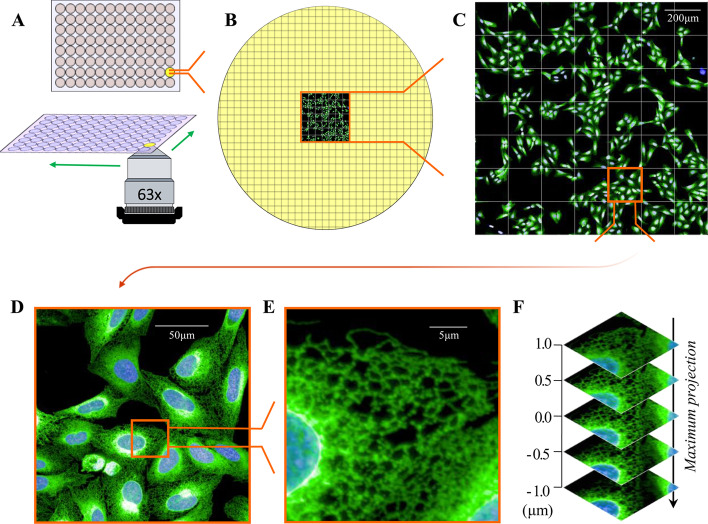
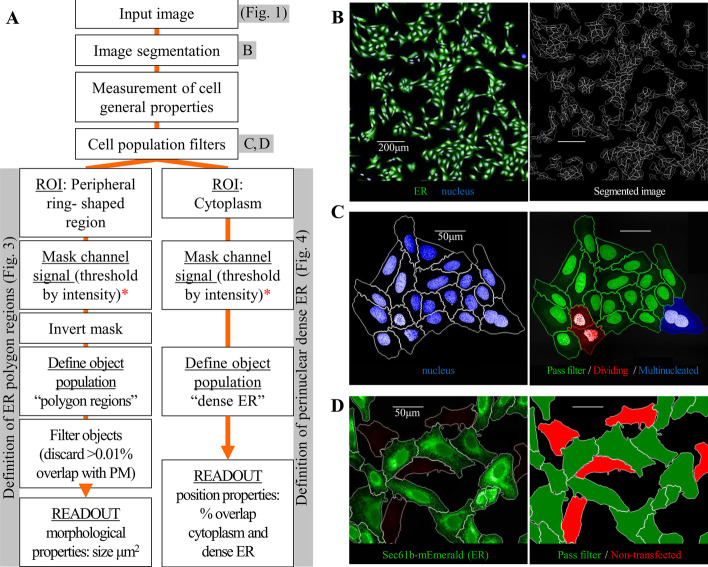
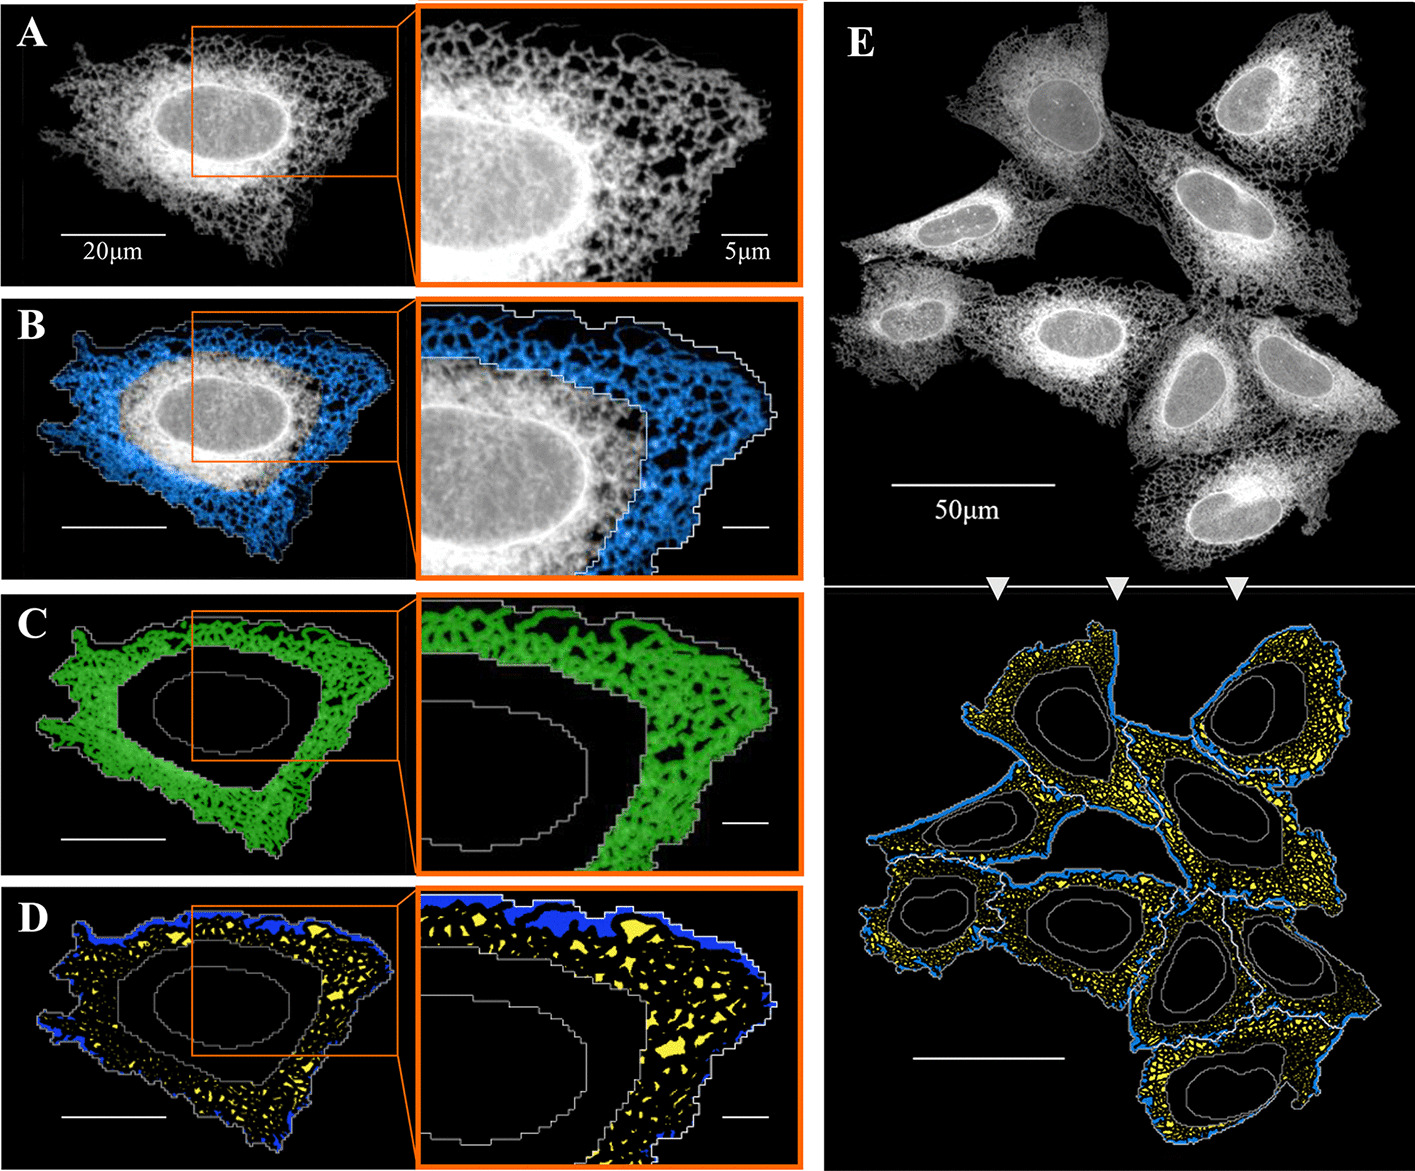
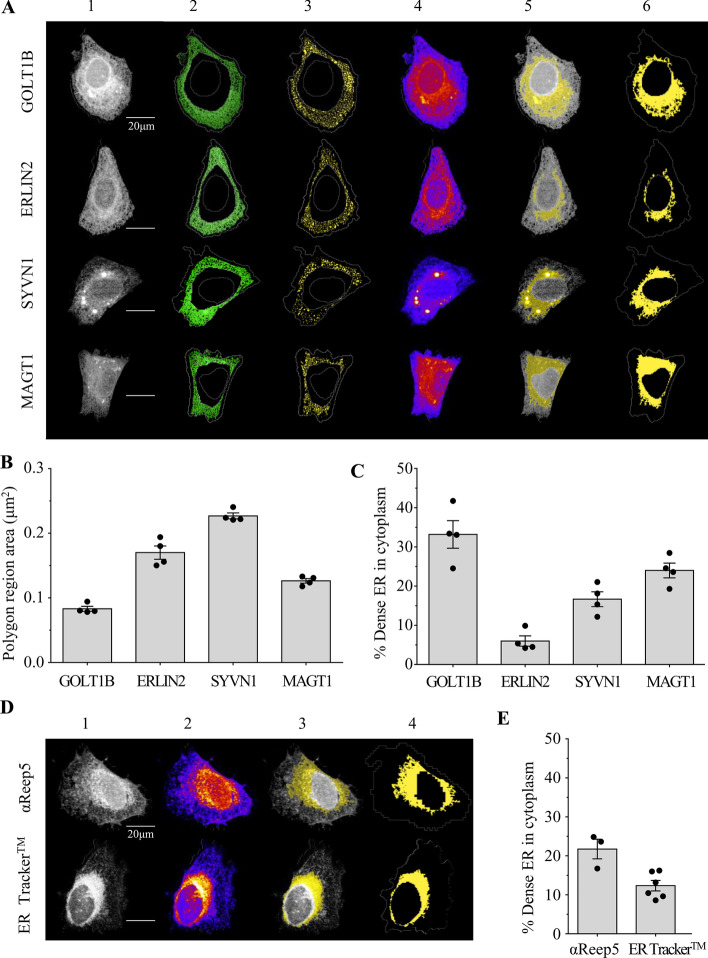
Results: In this work we detail a methodological approach that utilises automated high-content screening microscopy to capture images of cells fluorescently-labelled for various ER markers, followed by their quantitative analysis. We propose that two key metrics, namely the area of dense ER and the area of polygonal regions in between the reticular elements, together provide a basis for measuring the quantities of rough and smooth ER, respectively. We demonstrate that a number of different pharmacological perturbations to the ER can be quantitatively measured and compared in our automated image analysis pipeline. Furthermore, we show that this method can be implemented in both commercial and open-access image analysis software with comparable results.

Conclusions: We propose that this method has the potential to be applied in the context of large-scale genetic and chemical perturbations to assess the organisation of the ER in adherent cell cultures.

Keywords: Automated image analysis; ER function; Endoplasmic reticulum morphology; High-content imaging.


Conflict of interest statement

The authors declare that they have no competing interests.

Figures

Fig. 1
Fig. 1
Automated high-content/high-resolution imaging workflow. A 96-well microplates were imaged using an automated spinning disk confocal microscope with a 63 × water immersion objective. B Total number of imaged fields (grid) present in a standard 0.32 cm2 well of a 96-well plate (yellow) including an imaged area of 7 × 7 fields. C Enlarged 7 × 7 imaged area containing U-2 OS cells stably expressing the ER marker Sec61β-mEmerald (green) and nuclei stained with Hoechst 33342 (blue). Scale bar = 200 μm. D Enlarged single imaging field. Scale bar = 50 μm. E Enlarged region of the imaged field showing the detail of the ER network obtained with the 63 × objective. Scale bar = 5 μm. F Images correspond to maximum intensity projection of 5 confocal planes interspaced at 0.5 μm intervals
Fig. 2
Fig. 2
ER analysis pipeline workflow and preliminary steps. A Analysis pipeline workflow summary. ROI: Region of Interest. PM: plasma membrane B Example of segmentation of 7 × 7 imaging fields (left); identification of individual cells and cell regions: nucleus, PM and cytoplasm (right). Scale bars = 200 μm. C Filters based on nuclear morphological and intensity properties. (Left) Group of cells showing nuclei stained with Hoechst 33342. (Right) Filtered cells (green) and discarded cells: dividing cells (red) and multinucleated cells (blue). Scale bars = 50 μm. D Filters based on cytoplasmic ER marker (Sec61β-mEmerald) intensity. (Left) Group of cells showing ER labelled with Sec61β-mEmerald. (Right) Filtered cells (green) and discarded non-transfected cells (red). Scale bars = 50 μm
Fig. 3
Fig. 3
Definition of SER polygon regions. A–D Sequential key steps in the analysis shown on the same U-2 OS cell and enlarged region of the cell. Scale bars = 20 μm and 5 μm on the enlarged images. A U-2 OS cell expressing the ER marker Sec61β-mEmerald (white). B Definition of the peripheral ring-shaped region of the cytoplasm region of interest (ROI). C Masking of ER tubules (green) applying a threshold to the Sec61β-mEmerald signal within the ROI. D Inversion of ER mask resulting in detection of internal polygonal regions (yellow) and areas between the ER and the detected plasma membrane (blue). E Steps A and D shown in a group of cells. Scale bar = 50 μm
Fig. 4
Fig. 4
Definition of perinuclear dense RER structures. A–D Sequential key steps in the analysis shown on the same U-2 OS cell as in Fig. 2. Scale bars = 20 μm. A U-2 OS cell expressing the ER maker Sec61β-mEmerald (white). B Pseudo-coloured image based on Sec61β-mEmerald signal intensity, warm colours (red, orange, yellow) represent higher signal intensity, cold colours (pink, purple, blue) represent lower signal intensity. C Detection of dense ER (yellow area) after applying an intensity threshold to the Sec61β-mEmerald signal (white) within the cytoplasm (ROI). D Yellow region shows the surface of the cytoplasm, drawn in white, occupied by dense ER. E Steps A and D shown in a group of cells. Scale bar = 50 μm
Fig. 5
Fig. 5
Drug-induced ER reorganisation in U-2 OS cells. A Representative images of ER (green) distribution in U-2 OS cells expressing Sec61β-mEmerald after treatment with vehicle (DMSO), Thapsigargin, Tunicamycin, Palmitic acid, Cytochalasin B and Bafilomycin A1. Polygon regions are seen to be enlarged (red arrowheads in enlarged images) or constricted (yellow arrowheads in enlarged images). Nucleus (blue). Scale bars = 20 μm top row images and 10 = μm lower row of enlarged images. B Quantification of ER polygon region average size. C Quantification of% of dense ER in cell cytoplasm. Data are expressed as mean ± SEM (n = 5 independent experiments comprising ≥ 50 cells each) and values significantly different from vehicle control were determined by one-way ANOVA and Tukey’s multiple comparisons test (**, P < 0.01; ***, P < 0.001; ****, P < 0.0001; ns, P > 0.05)
Fig. 6
Fig. 6
Analysis of ER distribution in U-2 OS cells using various ER markers. A Images of a single cell showing sequential analysis of SER polygon regions (columns 2 and 3) and dense RER (columns 4, 5 and 6) in U-2 OS cells expressing various constructs that label the ER (GOLT1B-YFP, ERIN2-YFP, SYVN1-YFP and MAGT1-YFP) (column 1). B Quantification of ER polygon region average size. C Quantification of % of dense ER in cell cytoplasm in U-2 OS cells expressing each ER-localising protein. D Representative images of U-2 OS cells showing sequential analysis of dense RER (columns 2, 3 and 4) labelled with anti-Reep5 antibody and ER Tracker™ (column 1) and quantification of % of dense ER in cell cytoplasm (E). Data are expressed as mean ± SEM (n = 3–4 independent experiments comprising ≥ 50 cells each). All scale bars = 20 μm

Similar articles

Cited by

References

    1. Bougen-Zhukov N, Loh SY, Lee HK, Loo LH. Large-scale image-based screening and profiling of cellular phenotypes. Cytometry A. 2017;91(2):115–125. doi: 10.1002/cyto.a.22909. - DOI - PubMed
    1. McQuin C, Goodman A, Chernyshev V, Kamentsky L, Cimini BA, Karhohs KW, et al. Cell Profiler 3.0: next-generation image processing for biology. PLoS Biol. 2018;16(7):e2005970. doi: 10.1371/journal.pbio.2005970. - DOI - PMC - PubMed
    1. Caicedo JC, Cooper S, Heigwer F, Warchal S, Qiu P, Molnar C, et al. Data-analysis strategies for image-based cell profiling. Nat Methods. 2017;14(9):849–863. doi: 10.1038/nmeth.4397. - DOI - PMC - PubMed
    1. Hussain S, Le Guezennec X, Yi W, Dong H, Chia J, Yiping K, et al. Digging deep into Golgi phenotypic diversity with unsupervised machine learning. Mol Biol Cell. 2017;28(25):3686–3698. doi: 10.1091/mbc.e17-06-0379. - DOI - PMC - PubMed
    1. Galea G, Simpson JC. High-content screening and analysis of the golgi complex. Methods Cell Biol. 2013 doi: 10.1016/B978-0-12-417164-0.00017-3. - DOI - PubMed