

Generation of multicellular spatiotemporal models of population dynamics from ordinary differential equations, with applications in viral infection
- PMID: 34496857
- PMCID: PMC8424622
- DOI: 10.1186/s12915-021-01115-z
Generation of multicellular spatiotemporal models of population dynamics from ordinary differential equations, with applications in viral infection
Abstract
Background: The biophysics of an organism span multiple scales from subcellular to organismal and include processes characterized by spatial properties, such as the diffusion of molecules, cell migration, and flow of intravenous fluids. Mathematical biology seeks to explain biophysical processes in mathematical terms at, and across, all relevant spatial and temporal scales, through the generation of representative models. While non-spatial, ordinary differential equation (ODE) models are often used and readily calibrated to experimental data, they do not explicitly represent the spatial and stochastic features of a biological system, limiting their insights and applications. However, spatial models describing biological systems with spatial information are mathematically complex and computationally expensive, which limits the ability to calibrate and deploy them and highlights the need for simpler methods able to model the spatial features of biological systems.
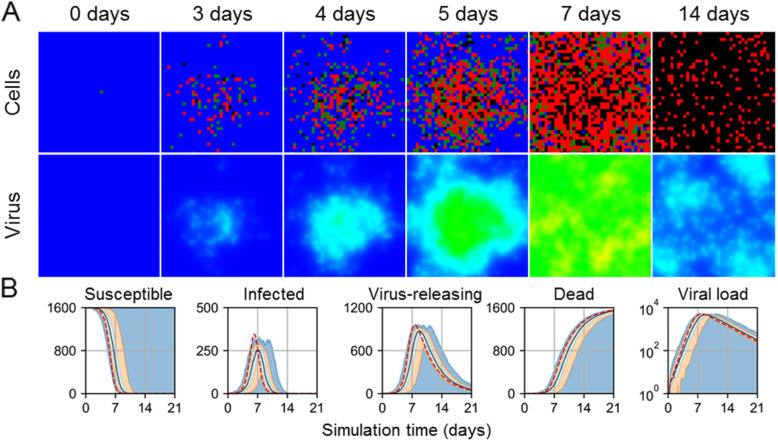
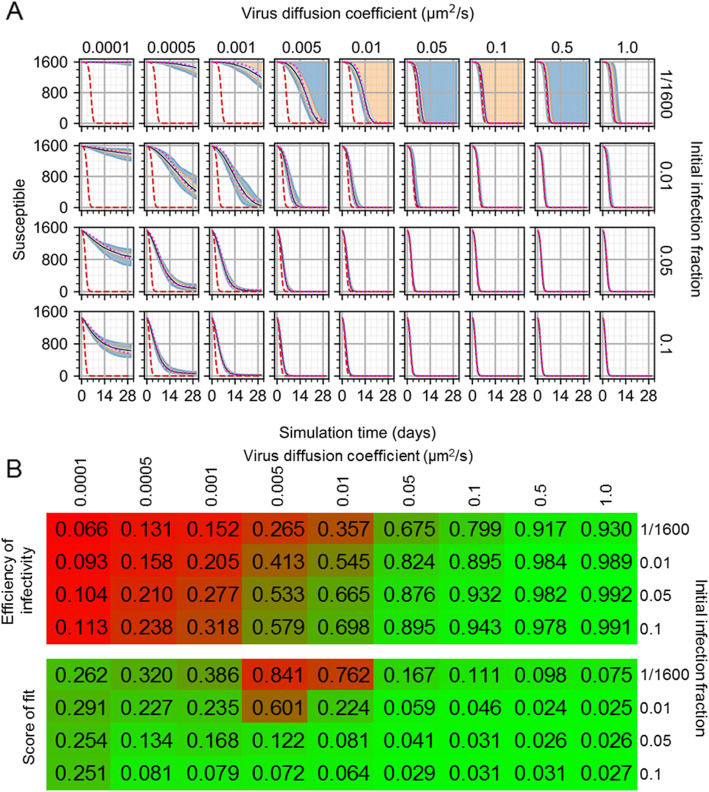
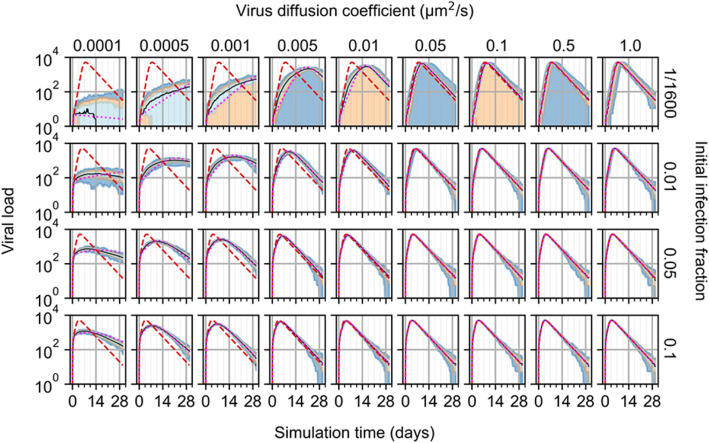
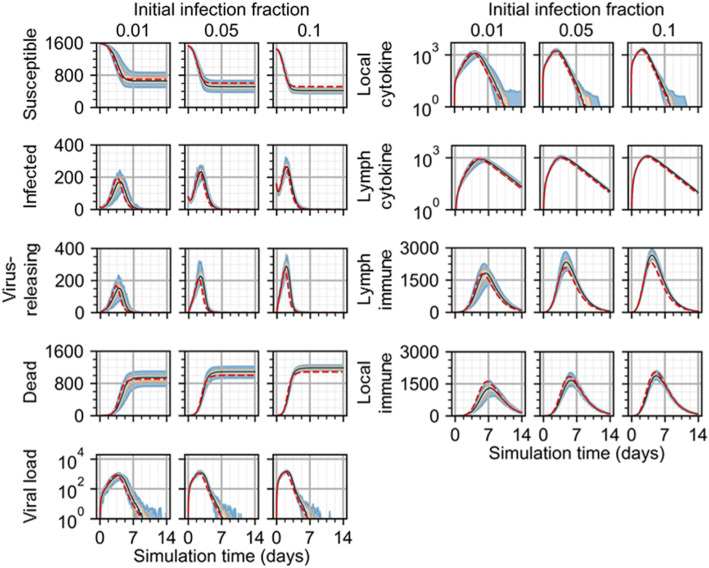
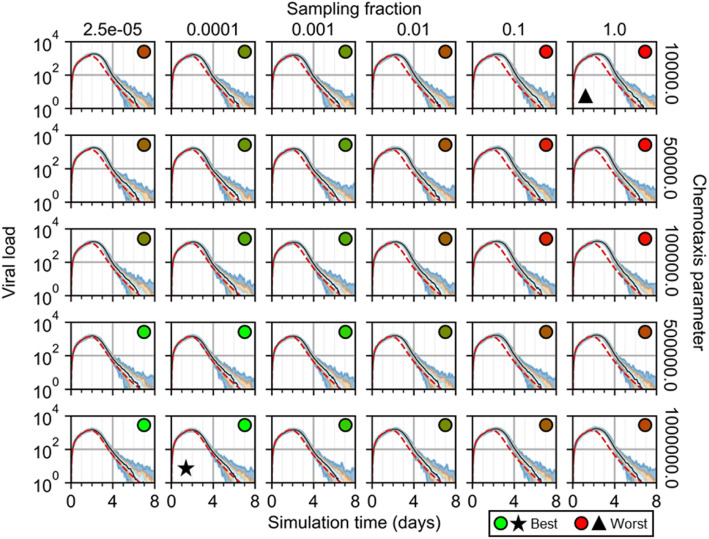
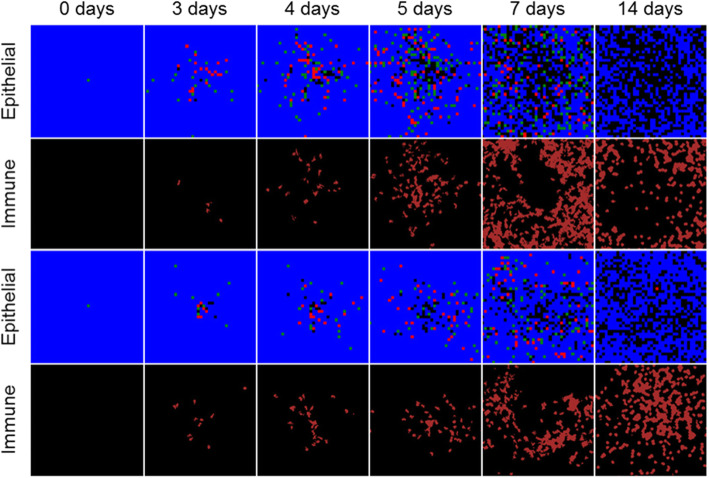
Results: In this work, we develop a formal method for deriving cell-based, spatial, multicellular models from ODE models of population dynamics in biological systems, and vice versa. We provide examples of generating spatiotemporal, multicellular models from ODE models of viral infection and immune response. In these models, the determinants of agreement of spatial and non-spatial models are the degree of spatial heterogeneity in viral production and rates of extracellular viral diffusion and decay. We show how ODE model parameters can implicitly represent spatial parameters, and cell-based spatial models can generate uncertain predictions through sensitivity to stochastic cellular events, which is not a feature of ODE models. Using our method, we can test ODE models in a multicellular, spatial context and translate information to and from non-spatial and spatial models, which help to employ spatiotemporal multicellular models using calibrated ODE model parameters. We additionally investigate objects and processes implicitly represented by ODE model terms and parameters and improve the reproducibility of spatial, stochastic models.
Conclusion: We developed and demonstrate a method for generating spatiotemporal, multicellular models from non-spatial population dynamics models of multicellular systems. We envision employing our method to generate new ODE model terms from spatiotemporal and multicellular models, recast popular ODE models on a cellular basis, and generate better models for critical applications where spatial and stochastic features affect outcomes.
Keywords: Agent-based modeling; Multicellular systems; Multiscale modeling.
© 2021. The Author(s).
Conflict of interest statement
JAG is the owner/operator of Virtual Tissues for Health, LLC, which develops applications of multiscale tissue models in medical applications.
Figures


Similar articles
-
Modeling HIV-1 dynamics and fitness in cell culture across scales.Bull Math Biol. 2014 Feb;76(2):486-514. doi: 10.1007/s11538-013-9926-2. Epub 2014 Feb 8. Bull Math Biol. 2014. PMID: 24510727
-
Effect of stochasticity on coinfection dynamics of respiratory viruses.BMC Bioinformatics. 2019 Apr 16;20(1):191. doi: 10.1186/s12859-019-2793-6. BMC Bioinformatics. 2019. PMID: 30991939 Free PMC article.
-
Ordinary differential equations with applications in molecular biology.Rev Med Chir Soc Med Nat Iasi. 2012 Jan-Mar;116(1):347-52. Rev Med Chir Soc Med Nat Iasi. 2012. PMID: 23077920
-
Computational cell biology: spatiotemporal simulation of cellular events.Annu Rev Biophys Biomol Struct. 2002;31:423-41. doi: 10.1146/annurev.biophys.31.101101.140930. Epub 2001 Oct 25. Annu Rev Biophys Biomol Struct. 2002. PMID: 11988477 Review.
-
Relating biophysical properties across scales.Curr Top Dev Biol. 2008;81:461-83. doi: 10.1016/S0070-2153(07)81016-7. Curr Top Dev Biol. 2008. PMID: 18023738 Review.
Cited by
-
Spatial information allows inference of the prevalence of direct cell-to-cell viral infection.PLoS Comput Biol. 2024 Jul 23;20(7):e1012264. doi: 10.1371/journal.pcbi.1012264. eCollection 2024 Jul. PLoS Comput Biol. 2024. PMID: 39042664 Free PMC article.
-
Influence of cell type specific infectivity and tissue composition on SARS-CoV-2 infection dynamics within human airway epithelium.PLoS Comput Biol. 2023 Aug 11;19(8):e1011356. doi: 10.1371/journal.pcbi.1011356. eCollection 2023 Aug. PLoS Comput Biol. 2023. PMID: 37566610 Free PMC article.
-
Mathematical Modeling of the Lethal Synergism of Coinfecting Pathogens in Respiratory Viral Infections: A Review.Microorganisms. 2023 Dec 13;11(12):2974. doi: 10.3390/microorganisms11122974. Microorganisms. 2023. PMID: 38138118 Free PMC article. Review.
-
Antagonism between viral infection and innate immunity at the single-cell level.PLoS Pathog. 2023 Sep 5;19(9):e1011597. doi: 10.1371/journal.ppat.1011597. eCollection 2023 Sep. PLoS Pathog. 2023. PMID: 37669278 Free PMC article.
-
Endothelial cells signaling and patterning under hypoxia: a mechanistic integrative computational model including the Notch-Dll4 pathway.Front Physiol. 2024 Feb 22;15:1351753. doi: 10.3389/fphys.2024.1351753. eCollection 2024. Front Physiol. 2024. PMID: 38455844 Free PMC article.
References
-
- Merks RMH, Glazier JA. A cell-centered approach to developmental biology. Physica A. 2005;352(1):113–130. doi: 10.1016/j.physa.2004.12.028. - DOI
Publication types
MeSH terms
Grants and funding
LinkOut - more resources
Full Text Sources
Medical
