Comment
. 2021 Dec 1;27(23):6500-6513.
doi: 10.1158/1078-0432.CCR-21-1652. Epub 2021 Sep 8.

The Novel Nucleoside Analogue ProTide NUC-7738 Overcomes Cancer Resistance Mechanisms In Vitro and in a First-In-Human Phase I Clinical Trial

Affiliations
Comment

The Novel Nucleoside Analogue ProTide NUC-7738 Overcomes Cancer Resistance Mechanisms In Vitro and in a First-In-Human Phase I Clinical Trial

Hagen Schwenzer et al. Clin Cancer Res. .

Abstract

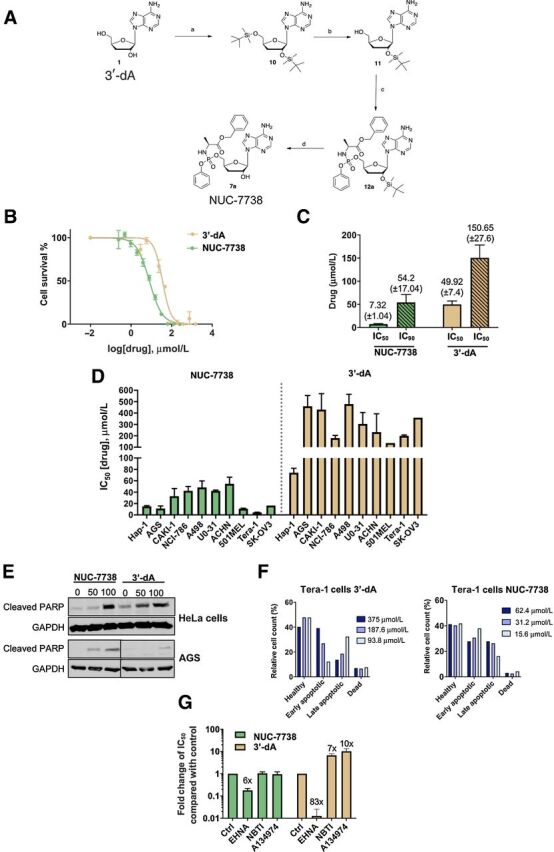
Purpose: Nucleoside analogues form the backbone of many therapeutic regimens in oncology and require the presence of intracellular enzymes for their activation. A ProTide is comprised of a nucleoside fused to a protective phosphoramidate cap. ProTides are easily incorporated into cells whereupon the cap is cleaved and a preactivated nucleoside released. 3'-Deoxyadenosine (3'-dA) is a naturally occurring adenosine analogue with established anticancer activity in vitro but limited bioavailability due to its rapid in vivo deamination by the circulating enzyme adenosine deaminase, poor uptake into cells, and reliance on adenosine kinase for its activation. In order to overcome these limitations, 3'-dA was chemically modified to create the novel ProTide NUC-7738.

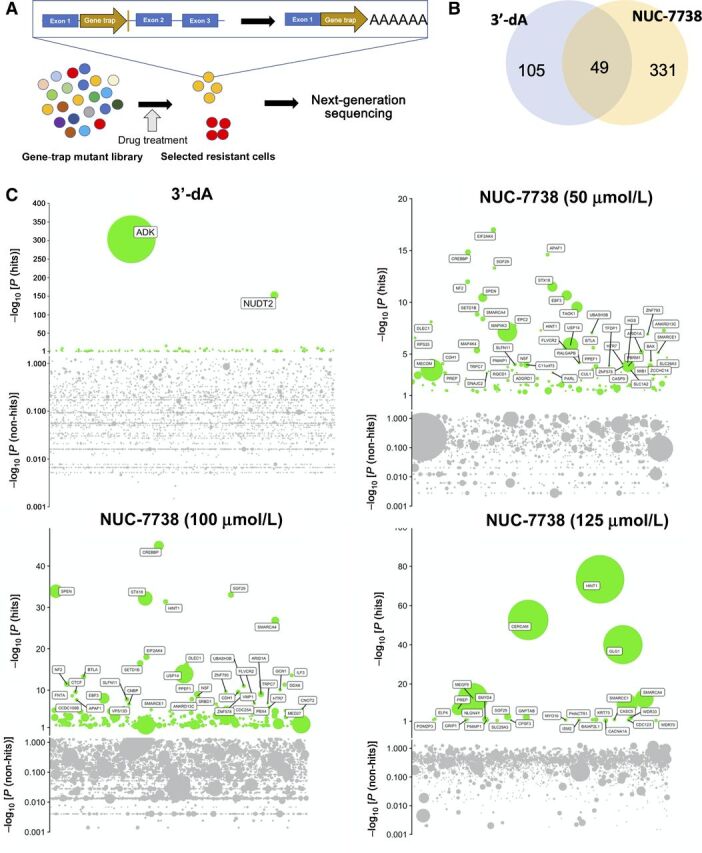
Experimental design: We describe the synthesis of NUC-7738. We determine the IC50 of NUC-7738 using pharmacokinetics (PK) and conduct genome-wide analyses to identify its mechanism of action using different cancer model systems. We validate these findings in patients with cancer.

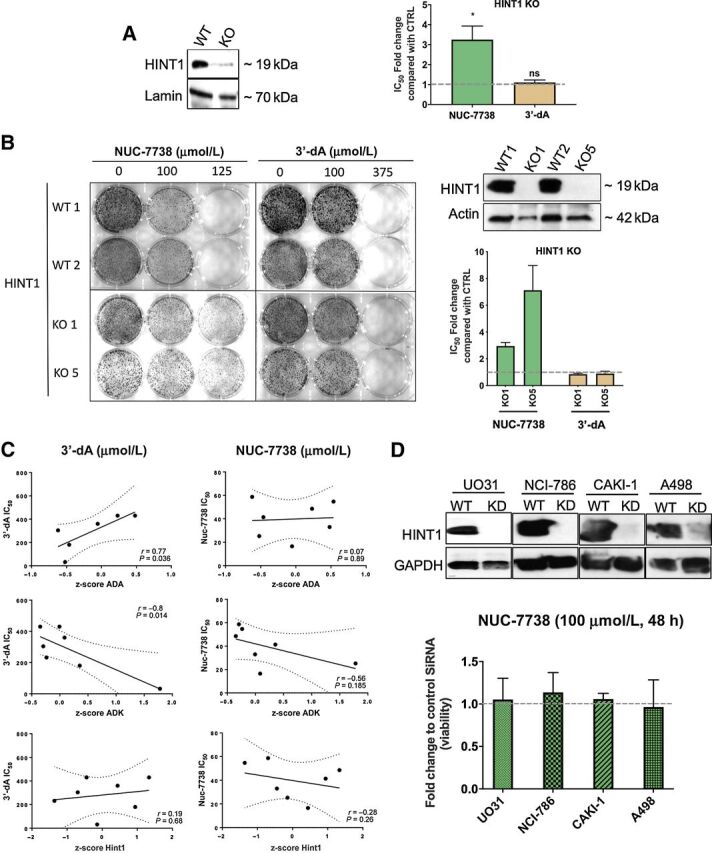
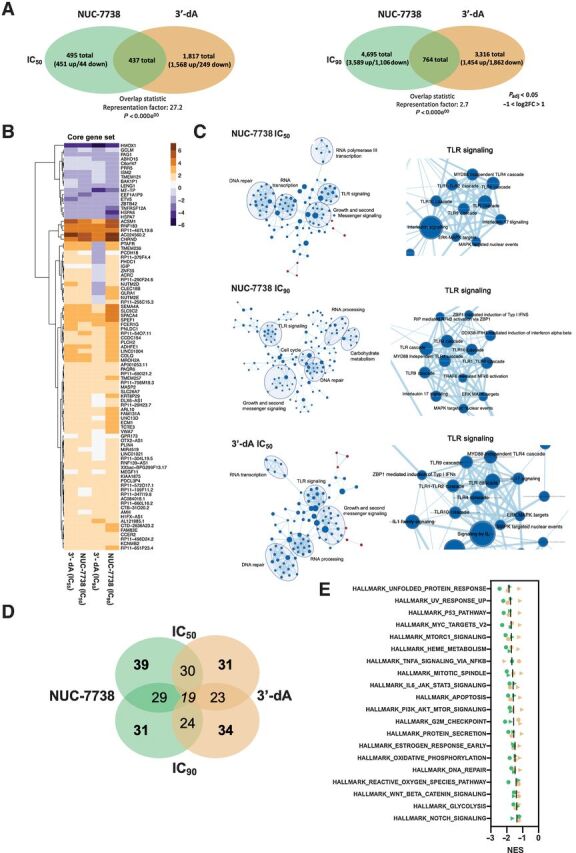
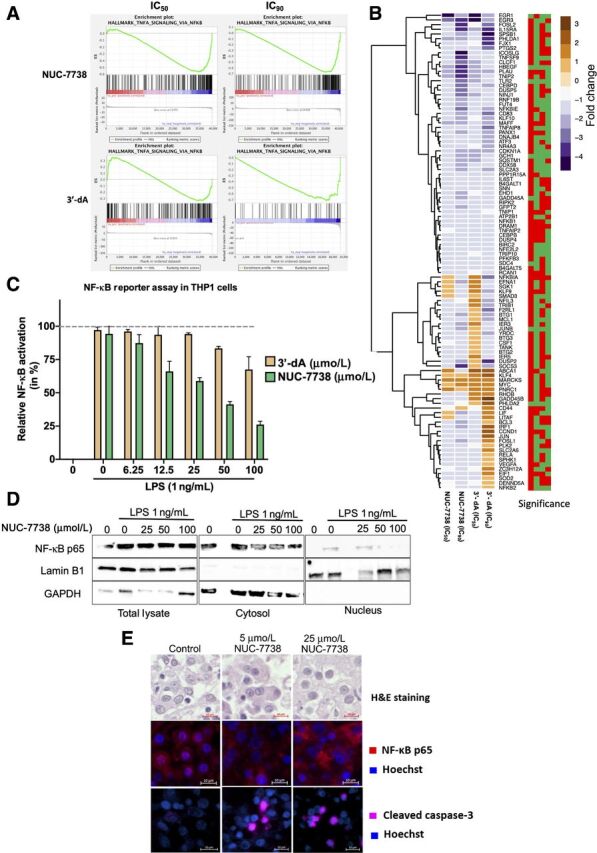
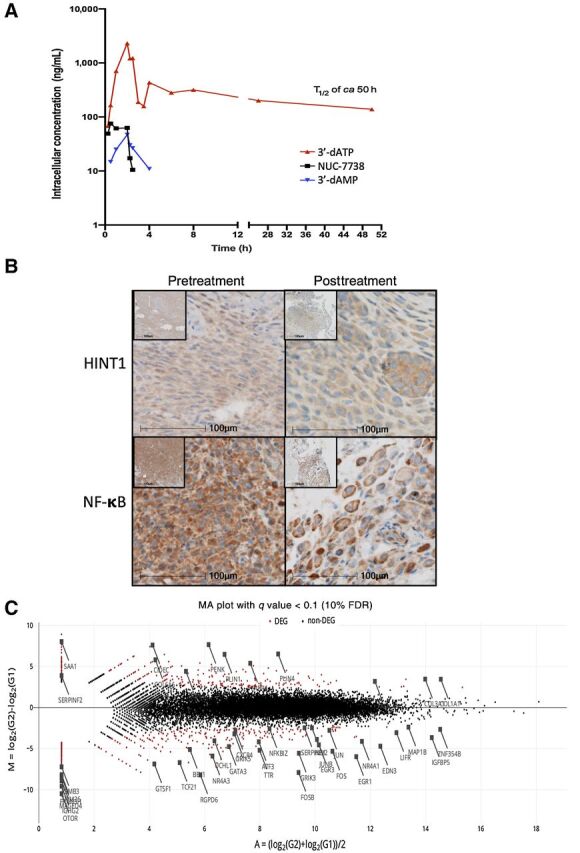
Results: We show that NUC-7738 overcomes the cancer resistance mechanisms that limit the activity of 3'-dA and that its activation is dependent on ProTide cleavage by the enzyme histidine triad nucleotide-binding protein 1. PK and tumor samples obtained from the ongoing first-in-human phase I clinical trial of NUC-7738 further validate our in vitro findings and show NUC-7738 is an effective proapoptotic agent in cancer cells with effects on the NF-κB pathway.

Conclusions: Our study provides proof that NUC-7738 overcomes cellular resistance mechanisms and supports its further clinical evaluation as a novel cancer treatment within the growing pantheon of anticancer ProTides.


Figures

Figure 1. NUC-7738, ProTide version 3′-dA, has cytotoxic activity. A, Scheme of the chemical synthesis of 3′-deoxyadenosine 5′-O-phenyl-(benzyloxy-L-alaninyl)-phosphate (NUC-7738), a functionalized ProTide of 3′-dA. B, HAP1 cells were treated with different concentrations of 3′-dA or NUC-7738 and cell viability was measured after 48 hours. One representative plot is shown. C, IC50 and IC90 determination of 3′-dA or NUC-7738 was performed using a nonlinear regression model. Mean and SEM of 4 biological replicates are shown. D, Determination of IC50 of 3′-dA or NUC-7738 in gastric, renal, melanoma, and ovarian cancer cell lines. Mean and SEM of at least 3 biological replicates is shown (where no SEM is shown, only 2 biological replicates were performed). E, Gastric or cervical cancer cells were treated with NUC-7738 or 3′-dA for 24 hours, following which cleaved PARP was detected by Western blot. GAPDH was used as a loading control. F, Tera-1 cells were treated with NUC-7738 or 3′-dA for 24 hours. Early and late apoptotic and dead cells were sorted and counted after staining with Guava Nexin kit. G, Chemical perturbation of known enzymes involved in processing of 3′-dA. HAP1 cells were treated with NUC-7738 and 3′-dA in the presence or absence of the ADA antagonist EHNA, the hENT1 antagonist NBTI, or the ADK inhibitor A134974. The fold-change difference in IC50 values compared with control is shown as means with SEM (n > 3).
Figure 1.
NUC-7738, ProTide version 3′-dA, has cytotoxic activity. A, Scheme of the chemical synthesis of 3′-deoxyadenosine 5′-O-phenyl-(benzyloxy-L-alaninyl)-phosphate (NUC-7738), a functionalized ProTide of 3′-dA. B, HAP1 cells were treated with different concentrations of 3′-dA or NUC-7738 and cell viability was measured after 48 hours. One representative plot is shown. C, IC50 and IC90 determination of 3′-dA or NUC-7738 was performed using a nonlinear regression model. Mean and SEM of 4 biological replicates are shown. D, Determination of IC50 of 3′-dA or NUC-7738 in gastric, renal, melanoma, and ovarian cancer cell lines. Mean and SEM of at least 3 biological replicates is shown (where no SEM is shown, only 2 biological replicates were performed). E, Gastric or cervical cancer cells were treated with NUC-7738 or 3′-dA for 24 hours, following which cleaved PARP was detected by Western blot. GAPDH was used as a loading control. F, Tera-1 cells were treated with NUC-7738 or 3′-dA for 24 hours. Early and late apoptotic and dead cells were sorted and counted after staining with Guava Nexin kit. G, Chemical perturbation of known enzymes involved in processing of 3′-dA. HAP1 cells were treated with NUC-7738 and 3′-dA in the presence or absence of the ADA antagonist EHNA, the hENT1 antagonist NBTI, or the ADK inhibitor A134974. The fold-change difference in IC50 values compared with control is shown as means with SEM (n > 3).
Figure 2. Genome-wide haploid genetic screen identifies genes necessary for the activity of 3′-dA and NUC-7738. A, Flowchart of insertional mutagenesis haploid screen. B, Venn diagram illustrating the overlap of genes found in 3′-dA and NUC-7738–treated samples. C, Bubble plots of 4 independent experiments. 3′-dA and NUC-7738 treatment was performed at given concentrations. P value is given on Y axis and genes sorted by their genomic location on X axis. Bubble sizes represent the number of unique insertions that were detected.
Figure 2.
Genome-wide haploid genetic screen identifies genes necessary for the activity of 3′-dA and NUC-7738. A, Flowchart of insertional mutagenesis haploid screen. B, Venn diagram illustrating the overlap of genes found in 3′-dA and NUC-7738–treated samples. C, Bubble plots of 4 independent experiments. 3′-dA and NUC-7738 treatment was performed at given concentrations. P value is given on Y axis and genes sorted by their genomic location on X axis. Bubble sizes represent the number of unique insertions that were detected.
Figure 3. Validation of top hits from genome-wide haploid screen. A, HINT1 was deleted in HAP1 cells using CRISPR/Cas9 technology, as shown by Western blot analysis of HINT1 KO cells using specific antibodies to HINT1. WT and KO cells were treated with either NUC-7738 or 3′-dA. IC50 values were determined and the fold change between KO and WT cells was calculated. B, Single-cell–derived clonal knockouts for HINT1 (KO1 and KO5) and 2 WT isogenic cell lines. Western blot analysis of HINT1 KO cells using specific antibodies to HINT1 is shown. Following treatment with NUC-7738 or 3′-dA, IC50 values were determined and the fold change between KO and WT cells were calculated. C, Correlation between IC50 of NUC-7738 or 3′-dA and mRNA abundance in different NCI-60 cells is given for ADA, ADK, and HINT1. mRNA expression levels are given as z-score calculated across all NCI-60 cell lines. mRNA expression levels were obtained from CellMinerTM v2.4.2. D, Western blot validation of siRNA-mediated HINT1 knockdown in renal cancer cell lines. WT and knockdown cells were treated with either NUC-7738 or 3′-dA. Graph shows the fold change in percentage of viable cells normalized to control (n = 3) after treatment with NUC-7738.
Figure 3.
Validation of top hits from genome-wide haploid screen. A, HINT1 was deleted in HAP1 cells using CRISPR/Cas9 technology, as shown by Western blot analysis of HINT1 KO cells using specific antibodies to HINT1. WT and KO cells were treated with either NUC-7738 or 3′-dA. IC50 values were determined and the fold change between KO and WT cells was calculated. B, Single-cell–derived clonal knockouts for HINT1 (KO1 and KO5) and 2 WT isogenic cell lines. Western blot analysis of HINT1 KO cells using specific antibodies to HINT1 is shown. Following treatment with NUC-7738 or 3′-dA, IC50 values were determined and the fold change between KO and WT cells were calculated. C, Correlation between IC50 of NUC-7738 or 3′-dA and mRNA abundance in different NCI-60 cells is given for ADA, ADK, and HINT1. mRNA expression levels are given as z-score calculated across all NCI-60 cell lines. mRNA expression levels were obtained from CellMinerTM v2.4.2. D, Western blot validation of siRNA-mediated HINT1 knockdown in renal cancer cell lines. WT and knockdown cells were treated with either NUC-7738 or 3′-dA. Graph shows the fold change in percentage of viable cells normalized to control (n = 3) after treatment with NUC-7738.
Figure 4. Transcription profiling of HAP1 cells treated with 3′-dA and NUC-7738. A, Venn diagram summarizing the number of differentially expressed genes (Padj < 0.05 and −2>FC>2) in 3′-dA and NUC-7738–treated samples. B, Expression heatmap of 91 genes commonly differentially expressed in all 4 tested conditions (Padj < 0.05 and −2>FC>2). GSEA and network mapping using Cytoscape. Genes ranked according to their P value and GSEA were performed on REACTOME gene sets. Gene overlaps between different pathways are shown. Nodes are GSEA enriched pathways while Edges represent overlapping shared genes between two pathways. C, GSEA and network mapping using Cytoscape. Genes ranked according to their P value and GSEA was performed on REACTOME gene sets. Gene overlaps between different pathways are shown. Nodes are GSEA enriched pathways while Edges represent overlapping shared genes between two pathways. D, Venn diagram summarizing number of overlapping enriched pathways by GSEA using Molecular Signature Database collection of HALLMARK gene. E, Summary of top 20 enriched pathways for Hallmark set enrichment analysis of hits for NUC-7738 and 3′-dA–treated cells. Green and orange indicate NUC-7738 and 3′-dA, respectively. Circles and triangles indicate dosing at IC50 and IC90, respectively.
Figure 4.
Transcription profiling of HAP1 cells treated with 3′-dA and NUC-7738. A, Venn diagram summarizing the number of differentially expressed genes (Padj < 0.05 and −2>FC>2) in 3′-dA and NUC-7738–treated samples. B, Expression heatmap of 91 genes commonly differentially expressed in all 4 tested conditions (Padj < 0.05 and −2>FC>2). GSEA and network mapping using Cytoscape. Genes ranked according to their P value and GSEA were performed on REACTOME gene sets. Gene overlaps between different pathways are shown. Nodes are GSEA enriched pathways while Edges represent overlapping shared genes between two pathways. C, GSEA and network mapping using Cytoscape. Genes ranked according to their P value and GSEA was performed on REACTOME gene sets. Gene overlaps between different pathways are shown. Nodes are GSEA enriched pathways while Edges represent overlapping shared genes between two pathways. D, Venn diagram summarizing number of overlapping enriched pathways by GSEA using Molecular Signature Database collection of HALLMARK gene. E, Summary of top 20 enriched pathways for Hallmark set enrichment analysis of hits for NUC-7738 and 3′-dA–treated cells. Green and orange indicate NUC-7738 and 3′-dA, respectively. Circles and triangles indicate dosing at IC50 and IC90, respectively.
Figure 5. NUC-7738 and 3′-dA affect the NF-κB pathway. A, Enrichment plots for NF-κB pathway for all 4 conditions. ES, Enrichment score. B, Expression levels of genes found in the leading edge of NF-κB pathway enrichment. Blue indicates downregulation and brown indicates upregulation of transcript. Significance plot indicates whether the gene was significantly differentially expressed. Red stands for Padj > 0.05 and green Padj < 0.05. Order of columns corresponds with expression heatmap. C, NF-κB activity was measured using the SEAP reporter gene assay in THP-1 cells. NF-κB activity was induced with lipopolysaccharide (LPS) in the presence or absence of NUC-7738. SEAP production as result of NF-κB activity was measured using the QuantiBlue colorimetric enzyme assay. Values were normalized to untreated LPS stimulated cells. D, NF-κB activity was induced with LPS in the presence or absence of NUC-7738 in NF-κB THP1 reporter cell line. Cells were harvested and fractionated into nuclear and cytosolic fraction. Western blot analysis using specific antibodies was employed to detect NF-κB p65 (RELA), nuclear marker Lamin B1, and cytosolic marker GAPDH. E, NF-κB p65 and Caspase 3 in ex vivo tissue treated with NUC-7738 for 24 hours. NF-κB p65 was seen in the nucleus of controls but disappeared after treatment with NUC-7738, and an increase in Caspase 3 was observed after 24 hours. H&E, Hematoxylin and eosin.
Figure 5.
NUC-7738 and 3′-dA affect the NF-κB pathway. A, Enrichment plots for NF-κB pathway for all 4 conditions. ES, Enrichment score. B, Expression levels of genes found in the leading edge of NF-κB pathway enrichment. Blue indicates downregulation and brown indicates upregulation of transcript. Significance plot indicates whether the gene was significantly differentially expressed. Red stands for Padj > 0.05 and green Padj < 0.05. Order of columns corresponds with expression heatmap. C, NF-κB activity was measured using the SEAP reporter gene assay in THP-1 cells. NF-κB activity was induced with lipopolysaccharide (LPS) in the presence or absence of NUC-7738. SEAP production as result of NF-κB activity was measured using the QuantiBlue colorimetric enzyme assay. Values were normalized to untreated LPS stimulated cells. D, NF-κB activity was induced with LPS in the presence or absence of NUC-7738 in NF-κB THP1 reporter cell line. Cells were harvested and fractionated into nuclear and cytosolic fraction. Western blot analysis using specific antibodies was employed to detect NF-κB p65 (RELA), nuclear marker Lamin B1, and cytosolic marker GAPDH. E, NF-κB p65 and Caspase 3 in ex vivo tissue treated with NUC-7738 for 24 hours. NF-κB p65 was seen in the nucleus of controls but disappeared after treatment with NUC-7738, and an increase in Caspase 3 was observed after 24 hours. H&E, Hematoxylin and eosin.
Figure 6. Clinical validation of the activity of NUC-7738. A, Intracellular levels of 3′-dATP, 3′-dAMP, and NUC-7738 were measured in the PBMCs from 7 patients who received treatment with NUC-7738 at a dose of 400–900 mg/m2 in the ongoing NuTide:701 clinical study. High intracellular levels of 3′-dATP were detected 0.25 hours after the start of infusion and were maintained for at least 48 hours. h, hours. B, IHC staining for HINT1 and NF-κB p65 subunit of pre- and posttreated tissue samples obtained from a melanoma cancer specimen. C, MA Plot summarizing transcriptomic profiling of pre- and posttreated tissue samples. Red dots indicate genes passing a FDR < 10%.
Figure 6.
Clinical validation of the activity of NUC-7738. A, Intracellular levels of 3′-dATP, 3′-dAMP, and NUC-7738 were measured in the PBMCs from 7 patients who received treatment with NUC-7738 at a dose of 400–900 mg/m2 in the ongoing NuTide:701 clinical study. High intracellular levels of 3′-dATP were detected 0.25 hours after the start of infusion and were maintained for at least 48 hours. h, hours. B, IHC staining for HINT1 and NF-κB p65 subunit of pre- and posttreated tissue samples obtained from a melanoma cancer specimen. C, MA Plot summarizing transcriptomic profiling of pre- and posttreated tissue samples. Red dots indicate genes passing a FDR < 10%.

Comment on

  • Selected Articles from This Issue.
    [No authors listed] [No authors listed] Clin Cancer Res. 2021 Dec 1;27(23):6279. doi: 10.1158/1078-0432.CCR-27-23-HI. Clin Cancer Res. 2021. PMID: 34853073 No abstract available.

References

    1. Tuli HS, Sharma AK, Sandhu SS, Kashyap D. Cordycepin: a bioactive metabolite with therapeutic potential. Life Sci 2013;93:863–9. - PubMed
    1. Paterson RRM. Cordyceps: a traditional Chinese medicine and another fungal therapeutic biofactory? Phytochemistry 2008;69:1469–95. - PMC - PubMed
    1. Ng TB, Wang HX. Pharmacological actions of Cordyceps, a prized folk medicine. J Pharm Pharmacol 2005;57:1509–19. - PubMed
    1. Yoon SY, Park SJ, Park YJ. The anticancer properties of cordycepin and their underlying mechanisms. Int J Mol Sci 2018;19:3027. Available from: https://www.ncbi.nlm.nih.gov/pmc/articles/PMC6212910/. - PMC - PubMed
    1. Cunningham KG, Manson W, Spring FS, Hutchinson SA. Cordycepin, a metabolic product isolated from cultures of Cordyceps militaris (Linn.) Link. Nature 1950;166:949. - PubMed

Publication types