. 2022 Jun;71(6):1068-1077.
doi: 10.1136/gutjnl-2021-325310. Epub 2021 Sep 8.

Chief cell plasticity is the origin of metaplasia following acute injury in the stomach mucosa

Affiliations

Chief cell plasticity is the origin of metaplasia following acute injury in the stomach mucosa

Brianna Caldwell et al. Gut. 2022 Jun.

Abstract

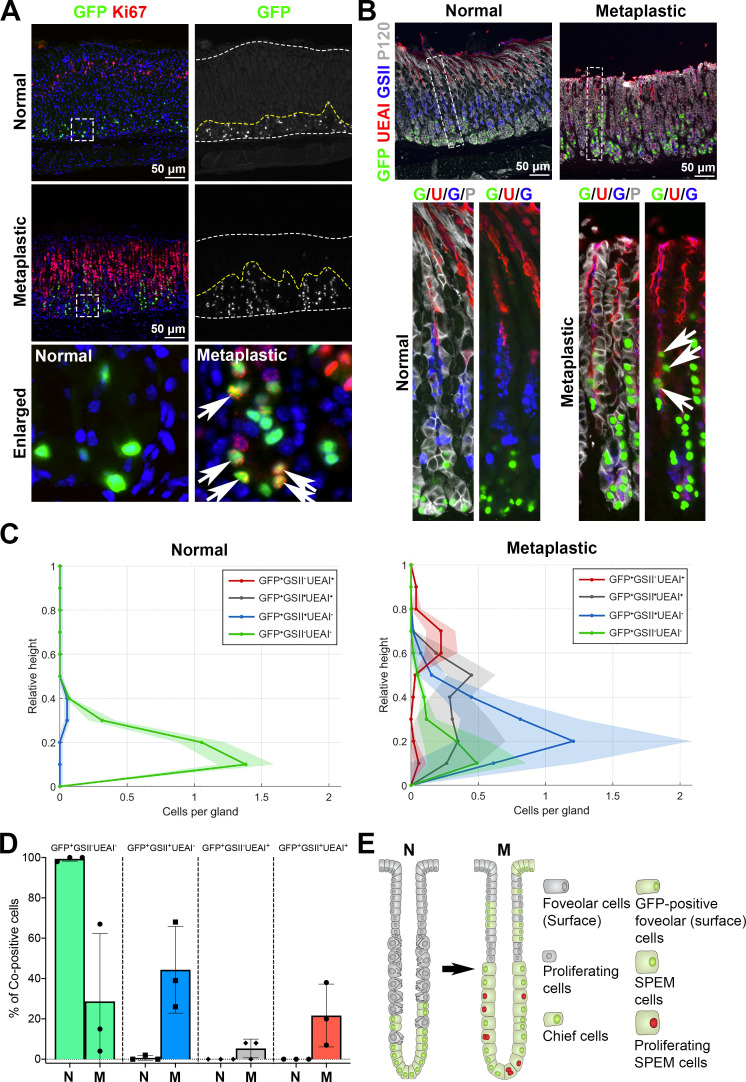
Objective: Metaplasia arises from differentiated cell types in response to injury and is considered a precursor in many cancers. Heterogeneous cell lineages are present in the reparative metaplastic mucosa with response to injury, including foveolar cells, proliferating cells and spasmolytic polypeptide-expressing metaplasia (SPEM) cells, a key metaplastic cell population. Zymogen-secreting chief cells are long-lived cells in the stomach mucosa and have been considered the origin of SPEM cells; however, a conflicting paradigm has proposed isthmal progenitor cells as an origin for SPEM.

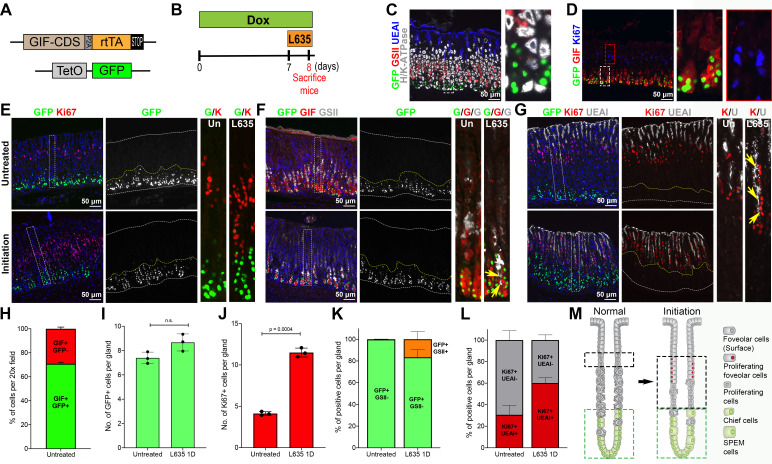
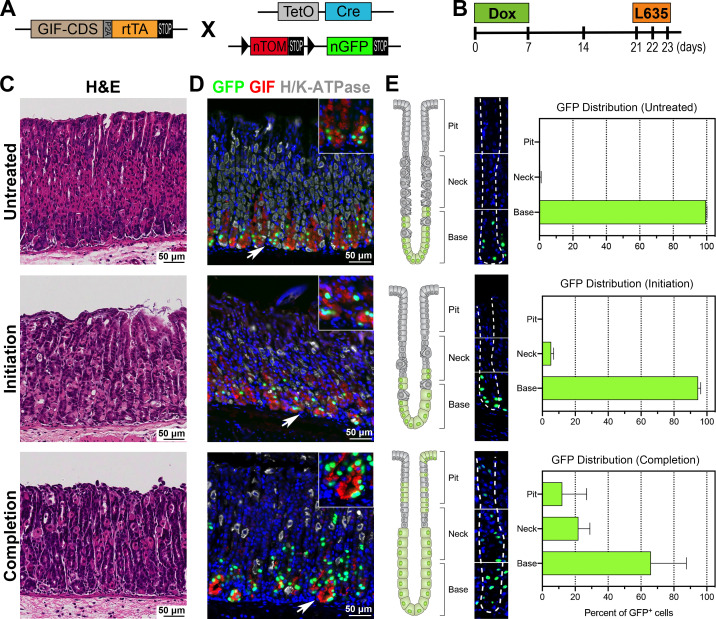
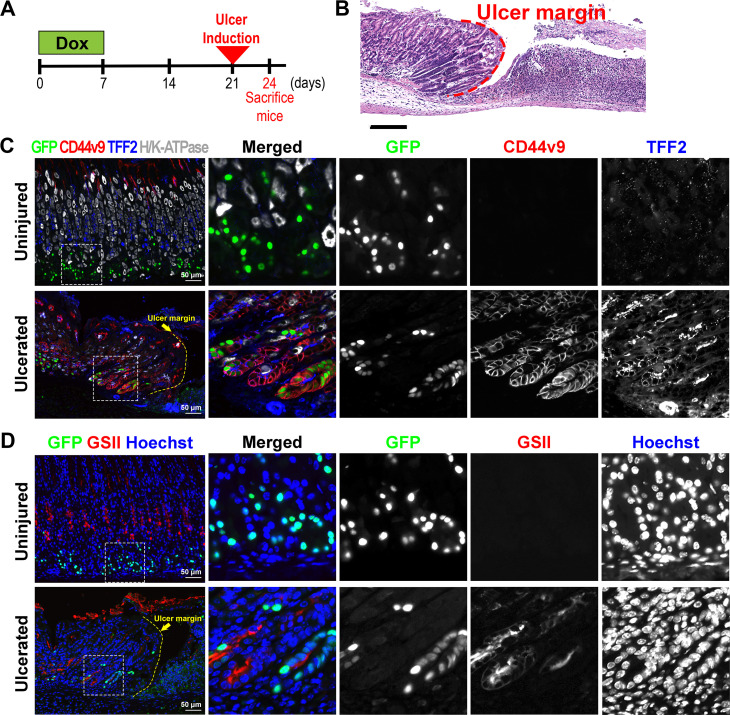
Design: Gastric intrinsic factor (GIF) is a stomach tissue-specific gene and exhibits protein expression unique to mature mouse chief cells. We generated a novel chief cell-specific driver mouse allele, GIF-rtTA. GIF-GFP reporter mice were used to validate specificity of GIF-rtTA driver in chief cells. GIF-Cre-RnTnG mice were used to perform lineage tracing during homoeostasis and acute metaplasia development. L635 treatment was used to induce acute mucosal injury and coimmunofluorescence staining was performed for various gastric lineage markers.

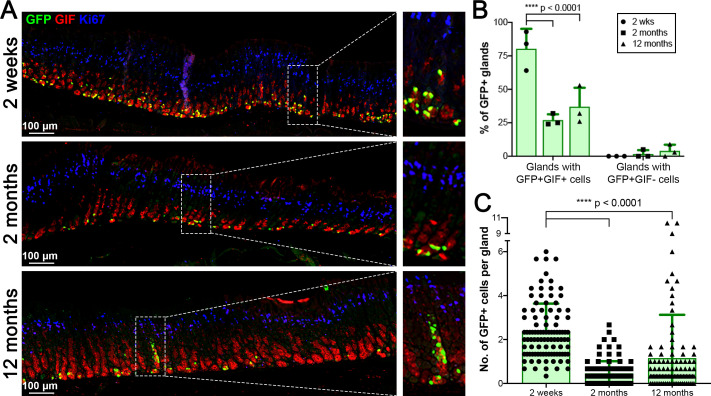
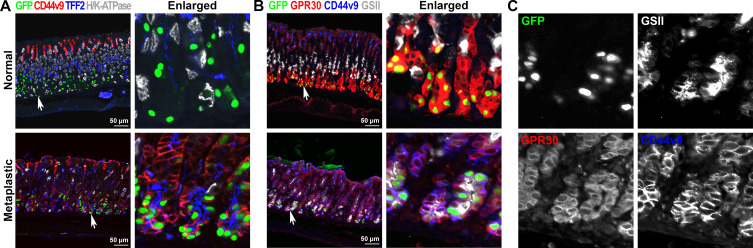
Results: We demonstrated that mature chief cells, rather than isthmal progenitor cells, serve as the predominant origin of SPEM cells during the metaplastic process after acute mucosal injury. Furthermore, we observed long-term label-retaining chief cells at 1 year after the GFP labelling in chief cells. However, only a very small subset of the long-term label-retaining chief cells displayed the reprogramming ability in homoeostasis. In contrast, we identified chief cell-originating SPEM cells as contributing to lineages within foveolar cell hyperplasia in response to the acute mucosal injury.

Conclusion: Our study provides pivotal evidence for cell plasticity and lineage contributions from differentiated gastric chief cells during acute metaplasia development.

Keywords: gastric epithelial cell function; gastric metaplasia; mucosal injury.


Conflict of interest statement

Competing interests: None declared.

Figures

Figure 1
Figure 1
Observation of GFP-positive chief cells during metaplasia initiation. (A) Diagram of the GIF-GFP allele used in this study. (B) Scheme of L635 treatment study in GIF-GFP mice. To first express GFP in chief cells, mice were administered doxycycline (Dox) water for 1 week before and throughout the L635 treatment. The GIF-GFP mice were treated with 1 dose of L635 following 1 week of Dox treatment to initiate the metaplastic process in the stomach mucosa. (C, D) Sections of the stomach tissues from GIF-GFP mice treated with Dox for 1 week were immunostained with antibodies against (C) GFP (green), GSII (mucus neck cells, red), UEAI (surface cells, blue) and H/K-ATPase (parietal cells, white) or (D) GFP (green), GIF (chief cells, red), Ki67 (proliferative cells/isthmal progenitor cells, blue). N=3 mice per group. (E–G) Sections of the stomach tissues from GIF-GFP mice treated without (untreated) or with 1 dose of L635 (initiation) at 1 week after the Dox treatment were immunostained with antibodies against (E) GFP (green) and Ki67 (red), (F) GFP (green), GIF (red) and GSII (white) or (G) GFP (green), Ki67 (red) and UEAI (white). Nuclei were counterstained with Hoechst (blue). Yellow arrows indicate cells copositive for GIF, GSII and GFP in panel F and cells copositive for UEAI and Ki67 in panel G. Dotted boxes depict regions enlarged. White dotted lines depict top and bottom of glands and yellow dotted lines depict the GFP+ cell zone. n=3 mice per group. (H) Quantitation of GIF and GFP copositive cells in GIF-GFP untreated mouse stomachs. The graph displays the percentage of GIF+/GFP+ (green) or GIF+/GFP− (red) cells per ×20 field. (I) Quantitation of GFP+ cells in GIF-GFP untreated or L635 1D mouse stomachs. The graph displays the number of GFP+ cells per gland. (J) Quantitation of K67+ cells in GIF-GFP untreated or L635 1D mouse stomachs. The graph displays the number of Ki67+ cells per gland. (K) Quantitation of GFP/GSII copositive cells in GIF-GFP untreated or L635 1D mouse stomachs. The graph displays the percentage of GFP+/GSII- (green) or GFP+/GSII+ cells (orange) per gland. (L) Quantitation of Ki67/UEAI copositive cells in GIF-GFP untreated or L635 1D mouse stomachs. The graph displays the percentage of Ki67+/UEAI+ (red) or of Ki67+/UEAI− cells (grey) per gland. Statistical significances were determined by unpaired Welch’s test (N=3 per group). (M) Schematic diagram of metaplasia initiation. Ggreen dotted lines depict the GFP+ chief cell zones and black dotted lines depict the proliferating cell zones in glands at the normal or metaplasia initiating stage. GIF, gastric intrinsic factor; n.s, not significant.
Figure 2
Figure 2
Lineage tracing of GIF-expressing chief cells in normal stomachs. (A) Immunostaining for GFP (green), GIF (red) and Ki-67 (blue) at 2 weeks, 2 months and 12 months following Dox treatment in GIF-Cre-RnTnG mouse stomachs. GFP+GIF+ cells represent long-lived chief cells and GFP+GIF cells indicate a lineage derivation from mature chief cells (****p<0.0001). The dotted boxes indicate the enlarged region. N=3 mice per group. (B) Quantitation of GFP+ glands. (C) Quantitation of GFP+ cells per gland. One hundred glands from proximal corpus were counted to perform the quantitative analyses (n=3, ****p<0.0001). GIF, gastric intrinsic factor.
Figure 3
Figure 3
Lineage tracing of GFP-labelled chief cells in metaplasia development. (A) Diagram of the GIF-Cre-RnTnG allele used in this study. (B) Scheme of L635 treatment study in GIF-Cre-RnTnG mice. To lineage label chief cells with GFP, mice were administered with Dox for 1 week on, 2 weeks off before the L635 treatment to fully mature the GFP-labelled chief cells. The GIF-Cre-RnTnG mice were treated without (untreated, N=4) or with one or three doses of L635 (initiation or completion, N=3). (C) H&E-stained stomach sections from GIF-Cre-RnTnG mice, untreated, L635-treated for one or three doses. (D) Sections of the stomach tissues from untreated, or L635 treated GIF-Cre-RnTnG mice were immunostained with antibodies against GFP (green), GIF (red) and H/K-ATPase (white). Nuclei were counterstained with Hoechst (blue). White arrows denote magnified insets. (E) Analysis of the distribution of GFP-labelled cells in different regions of glands in untreated or L635-treated GIF-Cre-RnTnG mouse stomachs. The corpus glands are illustrated on the left to show GFP-labelled cell position in different regions of glands (top, neck and base). A corpus gland stained for GFP (green) and Hoechst (blue) is at the centre. White dotted lines delineate a gland. Bar graphs display the percentage of GFP-labelled cells in different regions of gland. GIF, gastric intrinsic factor.
Figure 4
Figure 4
Immunofluorescence staining for SPEM markers in metaplastic glands. (A) Sections of the stomach tissues from GIF-Cre-RnTnG mice treated without (untreated) or with L635 for three doses (completion) were immunostained with antibodies against GFP (green), CD44v9 (red), TFF2 (blue) and H/K-ATPase (white). White arrows indicate enlarged area in panel. (B) Sections of the stomach tissues from GIF-Cre-RnTnG mice treated without (untreated) or with L635 for three doses (completion) were immunostained with antibodies against GFP (green), GPR30 (red), CD44v9 (blue) and GSII (white). White arrows indicate enlarged area in panel (C). GIF, gastric intrinsic factor; SPEM, spasmolytic polypeptide-expressing metaplasia.
Figure 5
Figure 5
Lineage contribution of GFP-labelled chief cells in metaplastic glands. (A) Sections of the stomach tissues from untreated (normal) or L635-treated (three doses, metaplastic) GIF-Cre-RnTnG mice were immunostained with antibodies against GFP (green) and Ki67 (red). Nuclei were counterstained with Hoechst (blue). Dotted boxes depict enlarged regions. white dotted lines delineate mucosa regions and yellow dotted lines define the GFP+ cell zones. White arrows indicate GFP and Ki67 copositive cells. N=3 mice per group. (B) Sections of the stomach tissues from untreated or L635-treated (three doses, metaplastic) GIF-Cre-RnTnG mice were immunostained with antibodies against GFP (green), UEAI (red), GSII (blue) and p120 (membrane marker, white). White dotted boxes depict enlarged regions. White arrows indicate GFP and UEAI copositive cells. N=3 mice per group. (C) Analysis of relative distribution of GFP+ cells in untreated (normal) and L635 treated (three doses, metaplastic) mouse stomach mucosa. The distribution histograms display each GFP+ cells coimmunostained for UEAI and GSII in the corpus gland shown in B. GFP+GSII-UEAI+ cells (red) indicate GFP-labelled surface cells. GFP+GSII+UEAI+ cells (grey) indicate transitioning cells from SPEM cells to surface cells. The y-axis represents the corpus gland divided into 10% increments (1=top and 0=base). The x-axis represents the number of cells in each region per gland. more than 50 glands were analysed in each group. (D) Bar graphs display the percentage of GFP+ cells coimmunostained for UEAI and GSII in the corpus gland shown in B. N=3 mice per group. (E) Schematic diagram of lineage contribution of GFP-labelled chief cells in metaplasia development. GIF, gastric intrinsic factor; SPEM, spasmolytic polypeptide-expressing metaplasia.
Figure 6
Figure 6
Lineage contribution of GFP-labelled chief cells in acetic acid-induced ulceration. (A) Scheme of acetic acid-induced ulceration in GIF-Cre-RnTnG mice. To first lineage label chief cells with GFP, mice received Dox for 1 week, followed by 2 weeks off before the gastric ulceration was induced. The stomach tissues were collected 3 days after the ulceration. (B) H&E-stained stomach sections from GIF-Cre-RnTnG mice at 3 days after acetic acid-induced injury. N=3 mice. Dotted line indicates ulcer margin. (C, D) Sections of the stomach tissues from uninjured or ulcerated lesions in the GIF-Cre-RnTnG mice were immunostained with (C) antibodies against GFP (green), CD44v9 (red), TFF2 (blue) and H/K-ATPase (white) and (D) antibodies against GFP (green) and GSII (red). Nuclei were counterstained with Hoechst. White dotted boxes depict enlarged regions and yellow dotted line indicates ulcer margin. GIF, gastric intrinsic factor.

Similar articles

Cited by

References

    1. Slack JMW. Metaplasia and transdifferentiation: from pure biology to the clinic. Nat Rev Mol Cell Biol 2007;8:369–78. 10.1038/nrm2146 - DOI - PubMed
    1. Giroux V, Rustgi AK. Metaplasia: tissue injury adaptation and a precursor to the dysplasia-cancer sequence. Nat Rev Cancer 2017;17:594–604. 10.1038/nrc.2017.68 - DOI - PMC - PubMed
    1. Goldenring JR. Pyloric metaplasia, pseudopyloric metaplasia, ulcer-associated cell lineage and spasmolytic polypeptide-expressing metaplasia: reparative lineages in the gastrointestinal mucosa. J Pathol 2018;245:132–7. 10.1002/path.5066 - DOI - PMC - PubMed
    1. Meyer AR, Goldenring JR. Injury, repair, inflammation and metaplasia in the stomach. J Physiol 2018;596:3861–7. 10.1113/JP275512 - DOI - PMC - PubMed
    1. Sáenz JB, Mills JC. Acid and the basis for cellular plasticity and reprogramming in gastric repair and cancer. Nat Rev Gastroenterol Hepatol 2018;15:257–73. 10.1038/nrgastro.2018.5 - DOI - PMC - PubMed

Publication types