. 2021 Sep 8;11(1):17849.
doi: 10.1038/s41598-021-97301-8.

Metabolic flexibility during sleep

Affiliations

Metabolic flexibility during sleep

Simeng Zhang et al. Sci Rep. .

Abstract

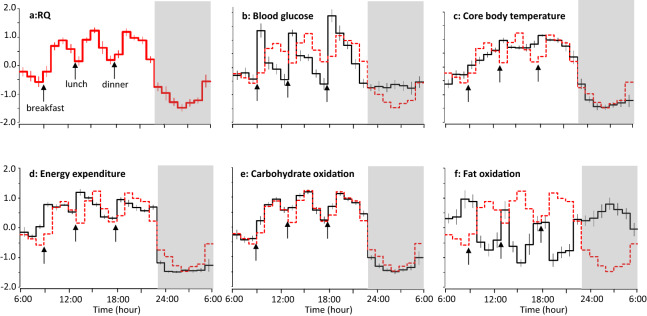
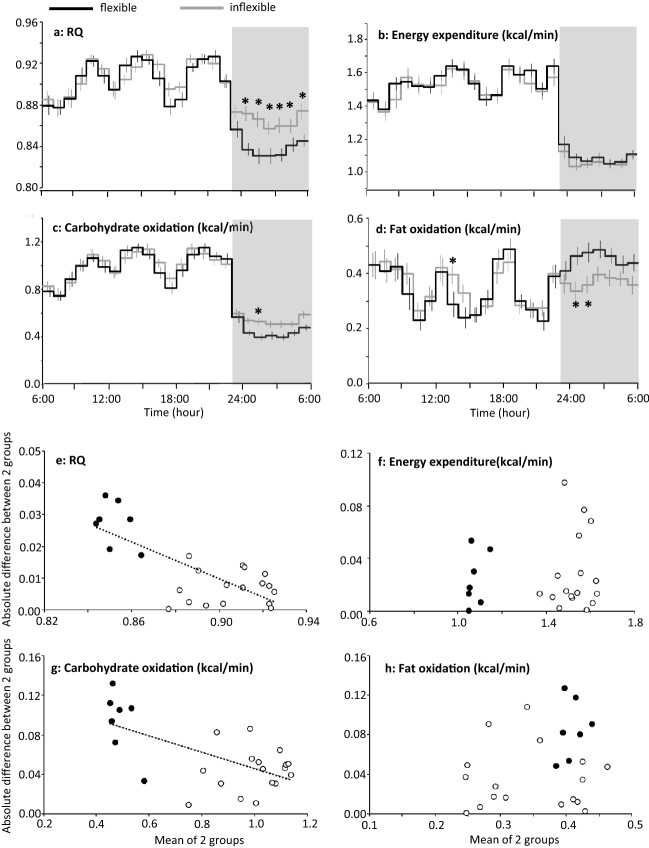
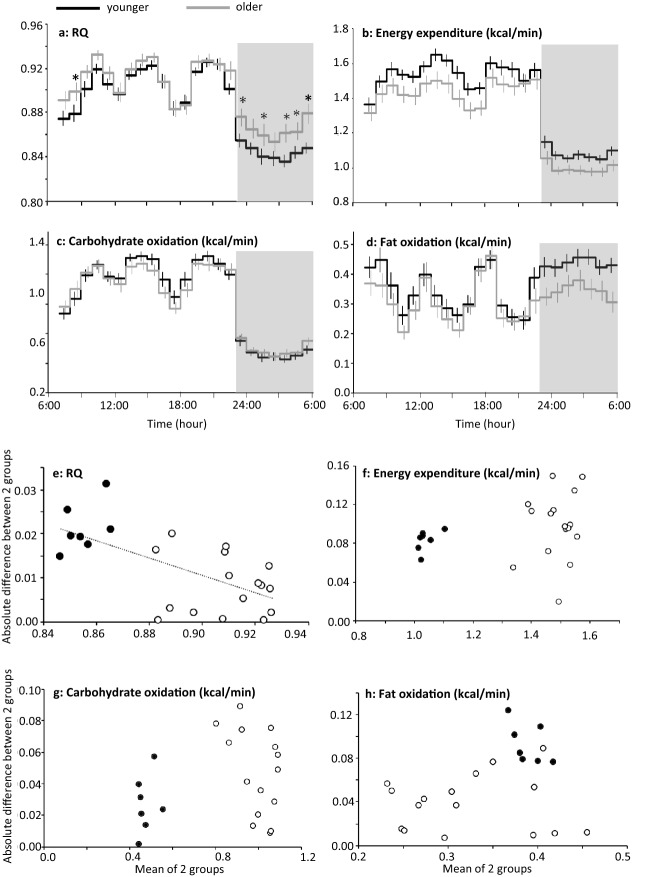
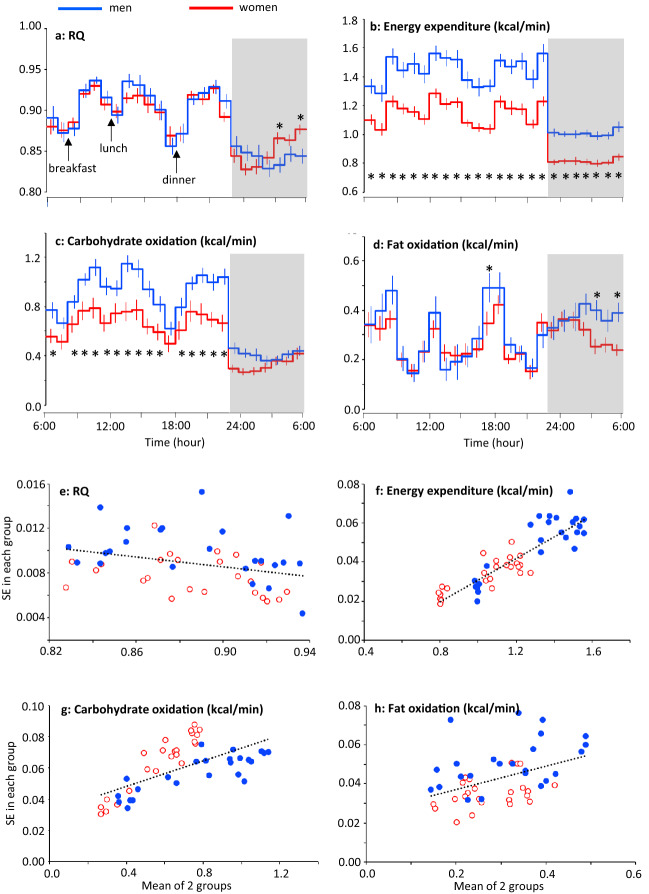
Known as metabolic flexibility, oxidized substrate is selected in response to changes in the nutritional state. Sleep imposes an extended duration of fasting, and oxidized substrates during sleep were assumed to progressively shift from carbohydrate to fat, thereby gradually decreasing the respiratory quotient (RQ). Contrary to this assumption, whole-room indirect calorimetry with improved time resolution revealed that RQ re-ascended prior to awakening, and nadir of RQ in non-obese young adults occurred earlier in women than men after bedtime. The transient decrease in RQ during sleep was blunted in metabolically inflexible men with smaller amplitude of diurnal rhythm in RQ. Similarly, the effect of 10 years difference in age on RQ became significant during sleep; the decrease in RQ during sleep was blunted in older subjects. Inter-individual difference in RQ become apparent during sleep, and it might serve as a window to gain insight into the early-stage pathogenesis of metabolic inflexibility.


Conflict of interest statement

The authors declare no competing interests.

Figures

Figure 1
Figure 1
Standardized time course of energy metabolism, body temperature and blood glucose. Hourly average of RQ (a), blood glucose (b), core body temperature (c), energy expenditure (d), carbohydrate oxidation (e) and fat oxidation (f) of each subject were standardized, and mean ± SE of 11 men are shown. For comparison, time course of RQ was shown as red dotted line in panels (bf). Data were derived from a sedentary control trial of a previous experiment focused on the effect of exercise on peripheral clock gene expression (24.5 ± 2.8 years; BMI 22.2 ± 1.9 kg/m2; body fat 16.1 ± 3.8%). Prescribed diet was provided as breakfast (9:00), lunch (13:00), and dinner (18:00). Subjects slept for 7 h from 23:00 to 6:00 (grey bars).
Figure 2
Figure 2
24 h profile of energy metabolism in metabolically flexible and inflexible subjects. (ad) Forty-one young men were grouped as metabolically flexible (n = 20) or inflexible (n = 21) according to the magnitude of range of RQ over the 24 h. Subjects took breakfast (7:00 or 9:00), lunch (12:00, 12:30 or 13:00), and dinner (18:00), and slept for 7 h (23:00–06:00, grey bars). Mean ± SE of RQ, energy expenditure, carbohydrate oxidation and fat oxidation were shown for metabolically flexible (black lines) and inflexible (grey lines) group. A linear mixed-models ANOVA showed a significant effect of time (P < 0.01) and a group × time interaction (P < 0.01) but main effect of group was not significant for RQ (P = 0.145), carbohydrate oxidation (P = 0.420) and fat oxidation (P = 0.731). For energy expenditure, effect of time was significant (P < 0.01) but main effect of group (P = 0.726) and group × time interaction (P = 0.170) was not significant. *Represents significant difference between the 2 subgroups by post hoc pair-wise comparisons (P < 0.05). (eh) Absolute differences between metabolically flexible and inflexible subgroup were plotted against mean of the two subgroups for RQ, energy expenditure, carbohydrate oxidation and fat oxidation. Values during sleep were shown as filled symbols (filled black circles). Significant negative correlation between absolute difference and mean of the two subgroups was observed in RQ and carbohydrate oxidation (P < 0.001).
Figure 3
Figure 3
Time course of energy metabolism in two age groups of 10 years apart. (ad) Fifty-three men were grouped as younger (n = 27, under 25 years of age) or older (n = 26, 25 years or more),–. Subjects took breakfast (7:00, 8:00 or 9:00), lunch (12:00, 12:30 or 13:00), and dinner (18:00), and slept for 7 or 8 h from 23:00 (grey bars). Because of unequal duration of sleeping period, the 8th hour of sleep in one experiment was not included for statistical analysis. Mean ± SE of RQ, energy expenditure, carbohydrate oxidation and fat oxidation for 23 h common to all data sets were shown for younger (black lines) and older (grey lines) group. A linear mixed-models ANOVA showed a significant effect of time (P < 0.01) and a group × time interaction (P = 0.032), but main effect of group was not significant (P = 0.078) for RQ. Similarly for carbohydrate oxidation, significant effect of time (P < 0.01) and a group × time interaction (P = 0.043) were found, but main effect of group was not significant (P = 0.792). For energy expenditure and fat oxidation, main effect of time was significant (P < 0.01), but main effect of group (P = 0.066 for energy expenditure and P = 0.129 for fat oxidation) and group × time interaction was not significant (P = 0.376 and P = 0.290). *Represents significant difference between the 2 subgroups by post hoc pair-wise comparisons (P < 0.05). Significant difference in RQ in the morning requires cautious interpretation, since % of subjects who took breakfast before 9:00 was not matched; 52% in younger and 69% in older group, respectively. (eh) Absolute difference between two age groups were plotted against mean of the two subgroups for RQ, energy expenditure, carbohydrate oxidation and fat oxidation. Values during sleep were shown as filled symbols (filled blue circles). Significant negative correlation between absolute difference and mean of the two subgroups was observed in RQ (P < 0.001).
Figure 4
Figure 4
24-h energy metabolism in men and women. (ad) Mean ± SE of RQ (a), energy expenditure (b), carbohydrate oxidation (c) and fat oxidation (d) in 10 men (blue lines) and 9 women (red lines) were calculated from a sedentary trial in previous experiments focused on the effect of exercise on 24-h fat oxidation. Prescribed diet was provided as breakfast (8:00), lunch (12:00), and dinner (18:00). Subjects slept for 7 h from 23:00 to 6:00 (grey bars). A linear mixed-models ANOVA showed a significant effect of time (P < 0.01), and a group × time interaction (P < 0.01) for RQ, energy expenditure, carbohydrate oxidation and fat oxidation. Main effect of group was significant for energy expenditure and carbohydrate oxidation (P < 0.01), but that for RQ (P = 0.924) and fat oxidation (P = 0.461) was not significant. *Represents significant difference between the 2 subgroups by post hoc pair-wise comparisons (P < 0.05). (eh) Relation between the mean and SE of RQ (e), energy expenditure (f), carbohydrate oxidation (g) and fat oxidation (h) of men (blue filled circles) and women (red open circles). Negative correlation in RQ and positive correlation in energy expenditure, carbohydrate oxidation and fat oxidation were observed between the mean and SE.
Figure 5
Figure 5
Cumulative display of sleep architecture during simultaneous assessment of energy metabolism. The percentage of subjects in each sleep stage is shown for men (upper panel) and women (lower panel). The total number of subjects was 38 men and 27 women (11 in follicular phase, 11 in luteal phase, and 5 cases without record). Subjects slept for 8 h in a metabolic chamber for indirect calorimetry,–. In this dataset, the nadir of the RQ was 3.00 ± 0.26 and 2.04 ± 0.39 h after bedtime for the men and women, respectively (P < 0.0368).

References

    1. Kelley DE, Mandarino LJ. Hyperglycemia normalizes insulin-stimulated skeletal muscle glucose oxidation and storage in noninsulin-dependent diabetes mellitus. J. Clin. Investig. 1990;86:1999–2007. doi: 10.1172/JCI114935. - DOI - PMC - PubMed
    1. Kelley DE, Goodpaster B, Wing RR, Simoneau J-A. Skeletal muscle fatty acid metabolism in association with insulin resistance, obesity, and weight loss. Am. J. Physiol. 1999;277:E1130–E1141. doi: 10.1152/ajpcell.1999.277.6.C1130. - DOI - PubMed
    1. Kelley DE, Mandarino J. Fuel selection in human skeletal muscle in insulin resistance: Reexamination. Diabetes. 2000;49:677–683. doi: 10.2337/diabetes.49.5.677. - DOI - PubMed
    1. Galgani JE, Moro C, Ravussin E. Metabolic flexibility and insulin resistance. Am. J. Physiol. 2008;295:E1009–E1017. - PMC - PubMed
    1. Goodpaster BH, Sparks LM. Metabolic flexibility in health and disease. Cell Metab. 2017;25:1027–1036. doi: 10.1016/j.cmet.2017.04.015. - DOI - PMC - PubMed

Publication types