. 2021 Sep;597(7875):250-255.
doi: 10.1038/s41586-021-03852-1. Epub 2021 Sep 8.

Cells of the human intestinal tract mapped across space and time

Affiliations

Cells of the human intestinal tract mapped across space and time

Rasa Elmentaite et al. Nature. 2021 Sep.

Abstract

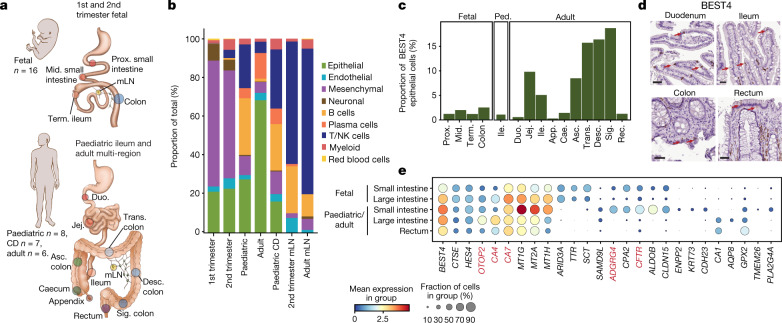
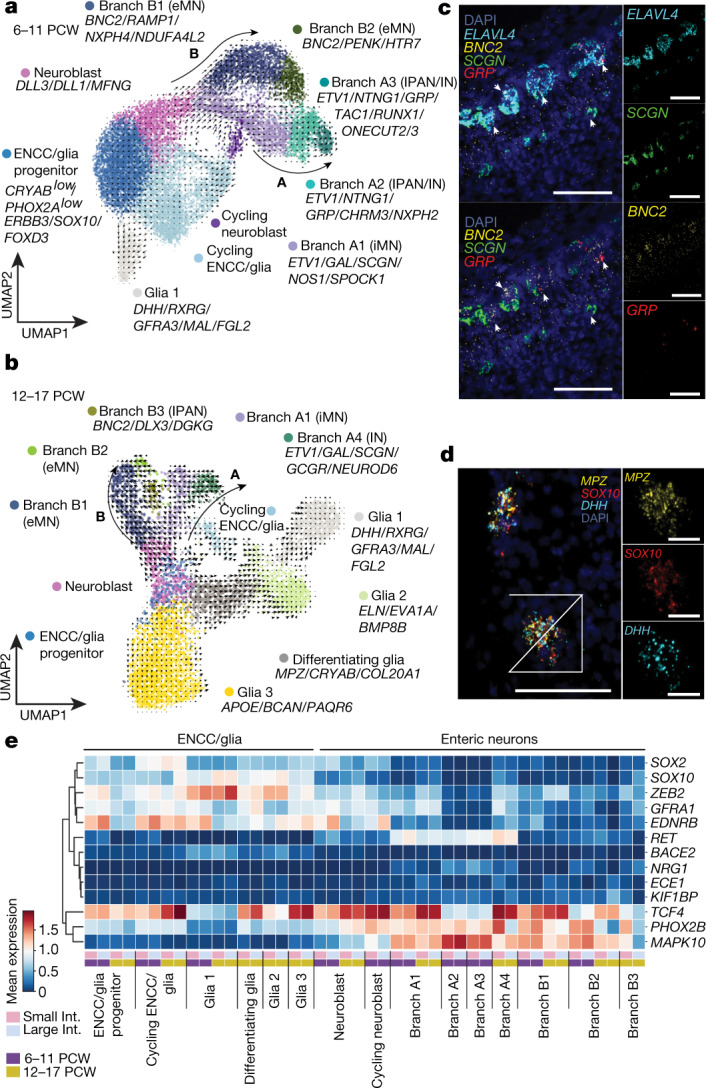
The cellular landscape of the human intestinal tract is dynamic throughout life, developing in utero and changing in response to functional requirements and environmental exposures. Here, to comprehensively map cell lineages, we use single-cell RNA sequencing and antigen receptor analysis of almost half a million cells from up to 5 anatomical regions in the developing and up to 11 distinct anatomical regions in the healthy paediatric and adult human gut. This reveals the existence of transcriptionally distinct BEST4 epithelial cells throughout the human intestinal tract. Furthermore, we implicate IgG sensing as a function of intestinal tuft cells. We describe neural cell populations in the developing enteric nervous system, and predict cell-type-specific expression of genes associated with Hirschsprung's disease. Finally, using a systems approach, we identify key cell players that drive the formation of secondary lymphoid tissue in early human development. We show that these programs are adopted in inflammatory bowel disease to recruit and retain immune cells at the site of inflammation. This catalogue of intestinal cells will provide new insights into cellular programs in development, homeostasis and disease.


Conflict of interest statement

In the past three years, S.A.T. has consulted for or been a member of scientific advisory boards at Roche, Qiagen, Genentech, Biogen, GlaxoSmithKline and ForeSite Labs. The remaining authors declare no competing interests.

Figures

Fig. 1
Fig. 1. Intestinal cellular census throughout life.
a, Schematic of human gut tissue sampling. Number of donors sampled for scRNA-seq is given. Mid., middle; prox., proximal; term., terminal; mLN, mesenteric lymph node; jej., jejunum; duo., duodenum; trans., transverse; asc., ascending; desc., descending; sig., sigmoid. b, Relative proportions of cell lineages at each developmental stage. NK, natural killer; CD, inflammatory bowel disease. c, Proportions of BEST4-expressing enterocytes among epithelial cells in scRNA-seq data of each tissue region and at each developmental stage. Ile., ileum; app., appendix; cae., caecum; rec., rectum. d, Expression of BEST4 in histological sections, from https://proteinatlas.org (Supplementary Table 8, n = 2 biologically independent samples for each region). Scale bars, 50 µm. e, Dot plot with relative expression of selected genes within BEST4 epithelial cells from different locations and ages. Key genes are highlighted in red, and the full Milo analysis can be found in Extended Data Fig. 3d. Source data
Fig. 2
Fig. 2. Epithelial cells and FCGR2A signalling in tuft cells.
a, b, Uniform manifold approximation and projection (UMAP) of fetal (a) and postnatal (b) epithelial cell types. Key cell types are circled with a dashed line and arrows depict paths of differentiation towards secretory and absorptive enterocytes as determined by scVelo. M cells, microfold cells; TA, transit-amplifying. c, Dot plot of TMPRSS2 and ACE2 expression in epithelial cells in the fetal intestine as in a. d, UMAP of enteroendocrine (EEC) and enterochromaffin (EC) cell subsets. Arrows depict summarised scVelo differentiation trajectories. C9orf16 is also known as BBLN. e, Heat map of genes that change along the differentiation trajectory from NEUROG3-expressing progenitors to enterochromaffin cells (red arrow in d). Arrows indicate genes that have known associations with enterochromaffin cell differentiation. f, Dot plot with expression of molecules upstream or downstream of the PLCG2 pathway in tuft cells and pooled absorptive (TA and enterocytes) and secretory (Paneth, goblet and EEC) cells. g, Per cent expression of Fcγ receptor by SiglecF+EpCAM+ and SiglecFEpCAM+ cells in wild-type mice determined by flow cytometry (individual points represent biological replicates; n = 4). Using a two-way ANOVA we observe significant interaction between Fcγ receptor expression (F(3, 39) = 42.29, P = 3.05 × 10⁻¹¹). Post-hoc analysis showed significant differences between non-Tuft epithelial cells and Tuft cells for FcγRIIB (mean difference = 2.80, 95% CI [1.80, 3.81], P < 0.0001) and FcγRIIB/III (mean difference = 4.88, 95% CI [3.88, 5.89], P < 0.0001) expression. ****Padj < 0.0001 values corrected with Tukey’s test for multiple comparisons. h, Schematic of proposed signalling pathways in tuft cells. RTK, receptor tyrosine kinases. Source data
Fig. 3
Fig. 3. Cells of the developing enteric nervous system.
a, b, UMAP of enteric neural crest cells (ENCC) and their progeny at 6–11 (a) and 12–17 (b) PCW. Overlaid arrows depict scVelo trajectories, with major neuronal branches shown as A and B. Marker genes for populations are listed. Branch A2 and A3 subsets were not observed at 12–17 PCW, possibly because they were outnumbered by the glial populations. c, d, Multiplex smFISH staining of SCGN branch A1, GRP branch A2/A3 and BNC2 branch B1/2 developing ELAVL4 neurons (arrows, n = 2) in the 15 PCW ileum (scale bars, 100 µm) (c) and glia 1 (DHH, MPZ, SOX10) cells in the mesentery (scale bars: main, 100 µm; expansion, 30 µm. n = 2 (d)). n represents the number of biological replicates across regions. e, Heat map showing the mean expression of genes associated with HSCR across intestinal regions and developmental stages. iMN, inhibitory motor neuron; IPAN, primary afferent neurons; IN, interneurons, int., intestine. Source data
Fig. 4
Fig. 4. Lymphoid tissue organogenesis programs adopted in Crohn’s disease.
a, UMAP of T and innate cells in scRNA-seq data across development. Dotted line denotes LTi-like cells and listed are characteristic genes. b, Schematic showing expression signatures of identified LTi-like states. c, Multiplex smFISH of 15 PCW ileum showing proximity of RORCCXCR5-expressing LTi-like cells to CXCL13-expressing mLTo cells (n = 2 biological replicates across regions). Arrows highlight cells of interest. Scale bars: main, 100 μm; expansion, 50 μm. d, UMAP of stromal cell types across development. The dotted line highlights key lineages. e, Spatial mapping of cell types from the scRNA-seq data to spatial transcriptomics data of 17 PCW terminal ileum using cell2location. Estimated abundance for cell types (colour intensity) across locations (dots) is overlaid on a histology image for LEC2 (left), LTi-like ILC3 (middle) and microfold (right) cells. f, Heat map showing top cell types across fetal, paediatric (healthy and Crohn’s disease) and adult data that are enriched for gene expression associated with either Crohn’s disease or ulcerative colitis (UC). All cell types listed are FDR < 10% for Crohn’s disease. Asterisks denote cell types with FDR < 10% for ulcerative colitis. CLP, common lymphoid progenitor. Source data
Extended Data Fig. 1
Extended Data Fig. 1. Data quality control.
a, Schematic showing tissue processing strategy for second trimester fetal, paediatric and adult scRNA-seq samples. After enzymatic dissociation, either total fraction was loaded onto a 10x Genomics Chromium chip or CD45+/− cell fractions were separated using magnetic cell sorting (MACS) and both fractions were loaded on the 10x Genomics Chromium chip separately. Lymph nodes were processed without enrichment. Second trimester fetal and adult cell samples were processed using 5ʹ v2 10x Genomics Chromium kits (Methods). b, Pre-processing and quality control of single-cell RNA-seq data generated in this study and described previously. In short, four datasets—namely first trimester fetal, second trimester fetal, paediatric healthy and Crohn’s disease, and adult—were pre-processed separately (including quality control, soupX analysis and scrublet doublet removal). Firstly, dimension reduction, clustering and annotation by cell lineage was performed on each dataset separately. Each cell lineage was sub-clustered and a fine-grained cell type and cell state annotation was performed based on marker gene expression. The four datasets were then merged together and each lineage was sub-clustered to unify cell type labels where appropriate. UMAP visualizations show the combined dataset coloured by sample age, enrichment fraction and donor name. c, UMAP visualization of cellular landscape of the human intestinal tract coloured by cellular lineage. d, Forest plot showing the relative importance (explained standard deviation) of each technical/biological factor on the cell type proportion. The 95% confidence intervals were computed from n = 1,431 data points (9 cell types × 159 samples). See Method section for more details. e, Dot plot in which the fold change represents the enrichment (or depletion, low fold change in blue) of cells compared with baseline. The LTSR value represents statistical significance of the fold change estimate ranging from 0 to 1, where 1 represents a confident estimate. See Method section for more details. f, Bar plots with relative proportion of cell lineages in each 10x Genomics Chromium run grouped by anatomical region within the scRNA-seq dataset as in Fig. 1b. Source data
Extended Data Fig. 2
Extended Data Fig. 2. Cell types defined in the study.
a, Dot plot for expression of marker genes of cell types and states in each cell lineage in the scRNA-seq dataset. Relates to Supplementary Tables 3, 4.
Extended Data Fig. 3
Extended Data Fig. 3. Region variability in BEST4 enterocytes.
a, Expression of CSTE (antibody: CAB032687, n = 3 biologically independent samples for each region) in gut histological sections from proteinatlas.org. Scale bar = 50 µm. b, UMAP visualization of BEST4 enterocytes in scRNA-seq dataset coloured by key marker BEST4/OTOP2 expression and region group (fetal and paediatric/adult). c, Volcano plot for differential abundance (DA) between cells from the small intestine and large intestine as in b. Each point represents a neighbourhood of BEST4 enterocytes (FDR: False Discovery Rate, logFC: log-Fold Change) for adult (red) and fetal samples (blue). The dotted line indicates the significance threshold of 10% FDR. d, Heat map showing the average neighbourhood expression of genes differentially expressed between DA neighbourhoods in adult BEST4 enterocytes (1,502 genes) as in c. Expression values for each gene are scaled between 0 and 1. Neighbourhoods are ranked by log-fold change in abundance between conditions. Positive log-fold change is small intestine neighbourhoods and negative is large intestine neighbourhoods. e, Expression of CFTR (antibody: CAB001951/HPA021939, n = 3 biologically independent samples for each region) in small intestinal (top) and colonic (bottom) histological sections from Human Protein Atlas (proteinatlas.org). Scale bar = 50 µm. f, Immunohistochemistry staining of BEST4 (HPA058564) and CFTR (HPA021939) in small intestinal sections as in e. Black arrows point to cells with goblet cell morphology and red arrows point to cells expressing either BEST4 or CFTR. Scale bar = 20 µm. Source data
Extended Data Fig. 4
Extended Data Fig. 4. Function of BEST4 epithelial cells.
a, b, Gene ontology terms from genes upregulated in BEST4 enterocytes from adult small (a) versus large (b) intestines as determined from Milo analysis. Source data
Extended Data Fig. 5
Extended Data Fig. 5. BEST2+ goblet cells.
a, UMAP visualization of expression of MUC2 (indicating goblet cells) and BEST2 in paediatric/adult epithelial cells from scRNA-seq dataset. b, Bar plot of the number of goblet cells captured across paediatric/adult intestinal tissues. c, Dot plot of gene expression correlating with BEST2 expression across epithelial cell types from scRNA-seq dataset calculated using Jaccard Similarity measure. Source data
Extended Data Fig. 6
Extended Data Fig. 6. Epithelial cell types throughout intestinal life.
a, UMAP of fetal (top) and pooled paediatric and adult (bottom) epithelial cells as in Fig. 2a, b coloured by gut region. b, Relative proportions of cell subtypes within total epithelial lineage as in Fig. 2a, b separated by donor age (row). Unit of age is years unless specified as weeks. c, Dot plot of TMPRSS2 and ACE2 expression by epithelial cells of the paediatric (left) and adult (right) intestine. d, e, UMAP of enteroendocrine cells (subsetted from Fig. 2a, b) coloured by d, (top) developmental age of donor and (bottom) normalised expression of key genes of NPW+ enterochromaffin cells and e, overlaid with calculated RNA velocity (arrows) and pseudotime (colour). f, Immunohistochemical staining of KLK12 (antibody: CAB025473, n = 3), AFP (antibody; HPA010607, n = 4), CES1 (antibody; HPA012023, n = 10), SLC18A1 (antibody; HPA063797, n = 12), GCH1 (antibody; HPA028612, n = 8), NPW (antibody; HPA064874, n = 8) in intestinal sections from Human Protein Atlas (proteinatlas.org). Red arrows highlight positive staining and n represents biological replicates across intestinal regions. g, Heat map of top differentially expressed genes in tuft cells across epithelial cell types in scRNA-seq dataset. The legend indicates whether the gene has a known association with tuft cells (purple) or are novel (orange). h, Immunohistochemical staining of HPGDS (antibody: HPA024035, n = 8), PSTPIP2 (antibody: HPA040944, n = 8), BMX (antibody: CAB032495, n = 7), MYO1B (antibody: HPA060144, n = 6), FYB1 (antibody: CAB025336, n = 7), SH2D7 (antibody: HPA076728, n = 7), PLCG2 (antibody: HPA020099, n = 8) protein expression in small intestine from Human Protein Atlas (proteinatlas.org). n represents biological replicates across intestinal regions. i, Dot plot showing expression of ITAM- and ITIM-linked receptors and receptor tyrosine kinases across tuft cells and pooled absorptive (TA and enterocytes) and secretory (Paneth, goblet and EECs) epithelial cells. j, Representative flow cytometry plots of FcγRII/III staining on EpCAM+SiglecF (non-tuft epithelial cells) and EpCAM+SiglecF+ (tuft cells) cells and isotype staining of EpCAM+SiglecF+ cells. Numbers show the percentage of cells within the gate out of the total population. Source data
Extended Data Fig. 7
Extended Data Fig. 7. Tuft cells and PLCG2 activation.
a, Heat map of expression of FCGR2A and downstream signalling molecules for epithelial cells with B and myeloid cell types included for reference. b, Representative brightfield images of paediatric intestinal organoid line (derived from healthy donors) in culture medium (undifferentiated) or differentiation medium (differentiated). Scale bar = 400 μm. c, Bar plot of relative expression of LGR5 and MUC2 (left) (n = 3 from one patient) and other key mRNA (right) by intestinal organoids as in b (n = 6 from two patients). Mean with standard error of the mean (s.e.m.) is shown in bar plots, and statistics are calculated by multiple t-test analysis: *P < 0.05 and **P < 0.005. d, Representative bright-field images of paediatric intestinal organoid line (derived from healthy donors) without (NT) or with stimulation with inflammatory recombinant human proteins IFNγ or TNF. e, Heat map of normalised gene expression in scRNA-seq data of organoids from Crohn’s disease (n = 1) and control (n = 3) paediatric biopsies stimulated with inflammatory cytokines as in d. f, Per cent expression of indicated Fcγ receptors by SiglecF+EpCAM+ small intestinal tuft cells in wild type (n = 5) and DSS-treated (n = 3) mice from a single experiment determined by flow cytometry. Mean with standard deviation is shown and statistics are calculated by multiple t-test analysis **P < 0.01; NS = not significant. Source data
Extended Data Fig. 8
Extended Data Fig. 8. Cell types in the developing enteric nervous system.
a, Multiplex smFISH images of SOX10,ERBB3,MPZ,PLP1 expressing ENCCs in the human small and large intestine at 6.5 PCW (Scale bar panels: main = 100 µm, zoom = 20 µm, n = 6). n here and below are biological replicates across regions. b, UMAP visualization of neural lineage cells in 6–11 and 12–17 PCW timepoints coloured by glial or neuronal score (left), cell cycle phase (middle) or pseudotime (right). Arrows show differentiation trajectory inferred from scVelo arrows as in Fig. 3a, b. c, Bar plot with relative abundance of cell types among ENCC-lineage populations as described in (Figure 3a, b) across intestinal regions and developmental timepoints. d, Heat map showing percentage of neural cells (6–17 PCW) described in this study (columns) matching with cells described in ref. (rows). e, Multiplex smFISH imaging of SCGN/BNC2-expressing enteric neurons (left, scale bar = 50 µm) and BMP8B-expressing Glia 2 subtype (right, scale bar panels main = 100 µm, zoom = 50 µm) in the adult sample (55-60 years, terminal ileum, n=1) and f, Multiplex smFISH of DHH -expressing Glia 1 cells (n=2, left, scale bar panels main = 100 µm, zoom = 10 µm) and BMP8B-expressing Glia 2 subtype (n=2, right, scale bar panels main = 100 µm, zoom = 50 µm) in the fetal myenteric plexus from 15 PCW small intestines. The boxed area is shown at higher magnification below, and n represents biological replicates across regions. g, HOX gene expression across neural subsets in 6–11 PCW samples. In the red box are Glia 1 (DHH) cells from all regions. Genes highlighted in red are colon-specific. h, Dot plot of key HSCR-associated ligand-receptor genes across the entire fetal scRNA-seq dataset. FPIL, fetal proximal ileum; FMIL, fetal middle ileum; FTIL, fetal terminal ileum; FLI, fetal large intestine. Source data
Extended Data Fig. 9
Extended Data Fig. 9. Annotation of developing enteric neural cells.
a, b, UMAP visualization of neural subsets combined from 6–17 PCW coloured by cell type annotation (a) or developmental stage (b). c, Bar plot showing regional distribution of neural subsets at 6–17 PCW. d, Dot plots with expression of key genes used to define enteric neuron subsets found at 6–11 PCW (above) and 12–17 PCW (middle) and glial cells across 6–17 PCW. Source data
Extended Data Fig. 10
Extended Data Fig. 10. Identification of LTi-cell-like subset.
a, Photo images of human intestinal gut and developing lymph nodes (arrows) at 8–17 PCW. Scale bar = 1 cm. b, Heat map of relative expression of key LTi defining and marker genes expressed by LTi-like cell types, NK cells and adult ILC3 as in Fig. 4a. Genes in red are highlighted in the schematic in Fig. 4b. c, Bar plot with productive TCRαβ chain in fetal T and innate lymphoid cell types as determined by V(D)J sequencing paired with scRNA-seq data. d, Dot plot of scaled expression of selected differentially expressed genes in fetal immune subsets from scRNA-seq dataset. e, Dot plot of expression of selected LTi-like genes in fetal liver ILCPs compared to LTi-like subsets in the gut. f, Bar graph showing the relative proportion of cell types among total T and innate lymphocyte population across developmental and adult gut regions and ages. FPIL, fetal proximal ileum; FMIL, fetal middle ileum; FTIL, fetal terminal ileum; FLI, fetal large intestine; FMLN, fetal mesenteric lymph node; DUO, duodenum; JEJ, jejunum; ILE, ileum; APD, appendix; CAE, caecum; ACL, ascending colon; TCL,transverse colon; DCL,descending colon; SCL,sigmoid colon; REC, rectum; MLN, mesenteric lymph node. g, Representative multiplex smFISH staining of fetal ileum tissue at 15 PCW showing three LTi-like subsets: NCR2+ ILC3, IL17A-expressing NCR ILC3and SCN1B-expressing ILCP cells (Scale bar panels: main = 20 µm, zoom =5 µm, n = 2, biological replicates across regions). h, UMAP visualization of fetal T and innate lymphoid cells (subsetted from Fig. 4a) coloured by cell type and overlaid with RNA velocity arrows. Inset panel shows ILCP and LTi-like NCR+ ILC3 cells. Source data
Extended Data Fig. 11
Extended Data Fig. 11. LTi-like cells in plate based single-cell sequencing data of sorted cells from the human fetal intestine.
a, UMAP visualization and feature plots of full-length Smart-seq2 data of flow cytometry-sorted CD45+ cells from second-trimester fetal tissue coloured by intestinal region or Leiden clustering. b, Dot plot of key marker gene expression in T and innate lymphoid cell subsets captured in Smart-seq2 experiment as in a. c, Bar plot of productive TCRαβ and TCRγδ chain in fetal T and innate lymphoid cell types as in a. Source data
Extended Data Fig. 12
Extended Data Fig. 12. Endothelial populations in the intestinal tract.
a, UMAP visualization of endothelial cell populations in fetal, paediatric and adult scRNA-seq data coloured by cell-cycle score (left) or annotation (right). Dashed line outlines lymphatic endothelial cell (LEC) subsets. b, Relative proportions of subtypes within total endothelial lineage separated by intestinal region (above) and intestinal region (below). Unit of age is years unless specified as weeks. Region names are: FPIL, fetal proximal ileum; FMIL, fetal middle ileum; FTIL, fetal terminal ileum; FLI, fetal large intestine; FMLN, fetal mesenteric lymph node; DUO, duodenum; JEJ, jejunum; ILE, ileum; APD, appendix; CAE, caecum; ACL, ascending colon; TCL, transverse colon; DCL, descending colon; SCL, sigmoid colon; REC, rectum; MLN, mesenteric lymph node. c, Heat map with top differentially expressed genes in the LEC subsets. d, Violin plot of NF-kB signalling activation score across endothelial subpopulations. e, Dot plot with scaled expression of selected genes involved in lymphoid tissue organization and immune cell recruitment amongst lymphatic endothelial cell subsets and mLTo cells. f, H&E staining of cross-section of fetal colon (15 PCW). Magnified panels show developing vessels (Scale bar panels: main = 200 µm, zoom = 20 µm, n = 9). g, Representative multiplex smFISH of PROX1 lymphatic vessels, CXCR5 ILC3 subsets and CXCL13-expressing mLTo cells in the human fetal intestine at 15 PCW (scale bar = 100 µm, n = 1). For f, g, n represents biological replicates across regions. Source data
Extended Data Fig. 13
Extended Data Fig. 13. Stromal in the intestinal tract.
a, Heat map of top differentially expressed genes between follicular dendritic cells (FDCs) and T reticular cells (TRCs) and related stromal subsets. Each row is a cell. Arrows highlight key genes discussed in the text. b, Bar graph showing the relative proportion of cell types among the total stromal lineage across fetal and adult gut regions (top) and developmental ages (bottom). Unit of age is years unless specified as weeks. Region names are: FPIL, fetal proximal ileum; FMIL, fetal middle ileum; FTIL, fetal terminal ileum; FLI, fetal large intestine; FMLN, fetal mesenteric lymph node; DUO, duodenum; JEJ, jejunum; ILE, ileum; APD, appendix; CAE, caecum; ACL, ascending colon; TCL, transverse colon; DCL, descending colon; SCL, sigmoid colon; REC, rectum; MLN, mesenteric lymph node. c, Dot plot comparing key defining genes expressed across populations in a and fetal mesenchymal lymphoid tissue organiser (mLTo) cells. d, Bar plot showing number of mLTo in scRNA-seq dataset and coloured by gut region. e, UMAP visualization of stromal cells as in Fig. 4d showing co-expression of CXCL13, CCL19, and CCL21. f, Heat map of top differentially expressed genes of mLTo cells between different intestinal regions. Each row is a cell. g, Heat map of mean expression of ligand-receptor pairs in mLTo, LTi-like and LEC subset from scRNA-seq dataset as identified using CellphoneDB. h, Heat maps showing mean expression of curated immune recruitment signal genes by selected fetal stromal, epithelial and endothelial cell types (top) and their receptor expression in the immune cell types of the fetal gut and mLNs. Red arrows in f and h link cognate ligand receptor pairs. Source data
Extended Data Fig. 14
Extended Data Fig. 14. Intestinal B cells and BCR analysis.
a, UMAP visualizations of scRNA-seq of subsetted B lineage cells from fetal samples. CLP, common lymphoid progenitor. b, Heat map with mean expression of differentially expressed gene in fetal B cell populations as in a. c, Violin plot of MHCII expression score of fetal B cell subsets as in a. ce, UMAP visualization of fetal B lineage cells as in a coloured by (d) BCR isotype retrieved from 10x Genomics Chromium V(D)J sequencing and (e) 10x Genomics technology. f, UMAP visualizations of subsetted B lineage cells from paediatric and adult scRNA-seq samples. LZ, light zone; DZ, dark zone; GC, germinal centre. g, Relative proportions of subtypes within total B cell factions in the gut (above) and lymph nodes (below) separated by donor age (row) as in a and f. Unit of age is years unless specified as weeks. h, Estimated clonal abundances per donor for members of expanded B lineage cell clones in fetal and adult scRNA-seq datasets. i, Quantification of somatic hypermutation frequencies of IgH sequences from B lineage cells in fetal and adult scRNA-seq datasets as in h. j, k, Quantification of somatic hypermutation frequencies of IgH sequences (j) and estimated clonal abundances per donor for members of expanded B lineage cell clones (k) across fetal and adult gut regions. FPIL, fetal proximal ileum; FMIL, fetal middle ileum; FTIL, fetal terminal ileum; FLI, fetal large intestine; FMLN, fetal mesenteric lymph node; DUO, duodenum; JEJ, jejunum; ILE, ileum; APD,appendix; CAE, caecum; ACL,ascending colon; TCL, transverse colon; DCL, descending colon; SCL, sigmoid colon; REC, rectum; MLN, mesenteric lymph node. l, Binary count of co-occurrence of expanded B cell clones identified by single-cell V(D)J analysis shared across gut regions and donors. Source data
Extended Data Fig. 15
Extended Data Fig. 15. Ectopic lymphoid tissue formation in paediatric Crohn’s disease.
a, Expression of mLTo gene markers by spatial coordinates in 10x Genomics Visium data (left) and abundance of mLTo and ILC3 cells as estimated by cell2location (right) across 17 PCW (top) and 13 PCW fetal ileum (bottom). White boxes highlight predicted developing SLO tissue zones. b, Spatial mapping of scRNA-seq data to 10x Genomics Visium data showing estimated abundance (colour intensity) of cell subsets (colour) in fetal terminal ileum from 17 PCW (top), ileum from 13 PCW (bottom). c, Abundances of cell types as identified using non-negative matrix factorization (NMF) in tissue zones from Visium data as in b. Dot plot shows NMF weights of cell types (columns) across NMF factors (rows), which correspond to tissue zones (normalized across factors per cell type by dividing by maximum values). d, Heat map showing mean probability of immune and stromal cell types matching between fetal and Crohn’s disease scRNA-seq datasets. e, Heat map with expression of cytokines and chemokines in cells involved in tertiary lymphoid organ development of fetal (black) and functionally related cell types in paediatric Crohn’s disease (red). f, Forest plot of top cell types across fetal, paediatric (healthy and IBD), and adult data enriched for expression of genes associated with either Crohn’s disease or ulcerative colitis. All cell types in red have FDR < 10%. The number of cells for each sample (n = 159 samples in total with complete metadata) and coarse-grain cell type (9 different cell types in total) combination was modelled with a generalised linear mixed model with a Poisson outcome. Error bars show standard error for each factor as estimated using the numDeriv package. Source data

Comment in

  • Mapping the human gut.
    Hindson J. Hindson J. Nat Rev Gastroenterol Hepatol. 2021 Nov;18(11):747. doi: 10.1038/s41575-021-00530-5. Nat Rev Gastroenterol Hepatol. 2021. PMID: 34584255 No abstract available.

References

    1. Elmentaite R, et al. Single-cell sequencing of developing human gut reveals transcriptional links to childhood Crohn’s disease. Dev. Cell. 2020;55:771–783.e5. doi: 10.1016/j.devcel.2020.11.010. - DOI - PMC - PubMed
    1. Holloway EM, et al. Mapping development of the human intestinal niche at single-cell resolution. Cell Stem Cell. 2021;28:568–580.e4. doi: 10.1016/j.stem.2020.11.008. - DOI - PMC - PubMed
    1. Fawkner-Corbett D, et al. Spatiotemporal analysis of human intestinal development at single-cell resolution. Cell. 2021;184:810–826.e23. doi: 10.1016/j.cell.2020.12.016. - DOI - PMC - PubMed
    1. James KR, et al. Distinct microbial and immune niches of the human colon. Nat. Immunol. 2020;21:343–353. doi: 10.1038/s41590-020-0602-z. - DOI - PMC - PubMed
    1. Kinchen J, et al. Structural remodeling of the human colonic mesenchyme in inflammatory bowel disease. Cell. 2018;175:372–386.e17. doi: 10.1016/j.cell.2018.08.067. - DOI - PMC - PubMed

Publication types

MeSH terms