. 2021 Sep;597(7877):549-554.
doi: 10.1038/s41586-021-03879-4. Epub 2021 Sep 8.

Inter-cellular CRISPR screens reveal regulators of cancer cell phagocytosis

Affiliations

Inter-cellular CRISPR screens reveal regulators of cancer cell phagocytosis

Roarke A Kamber et al. Nature. 2021 Sep.

Abstract

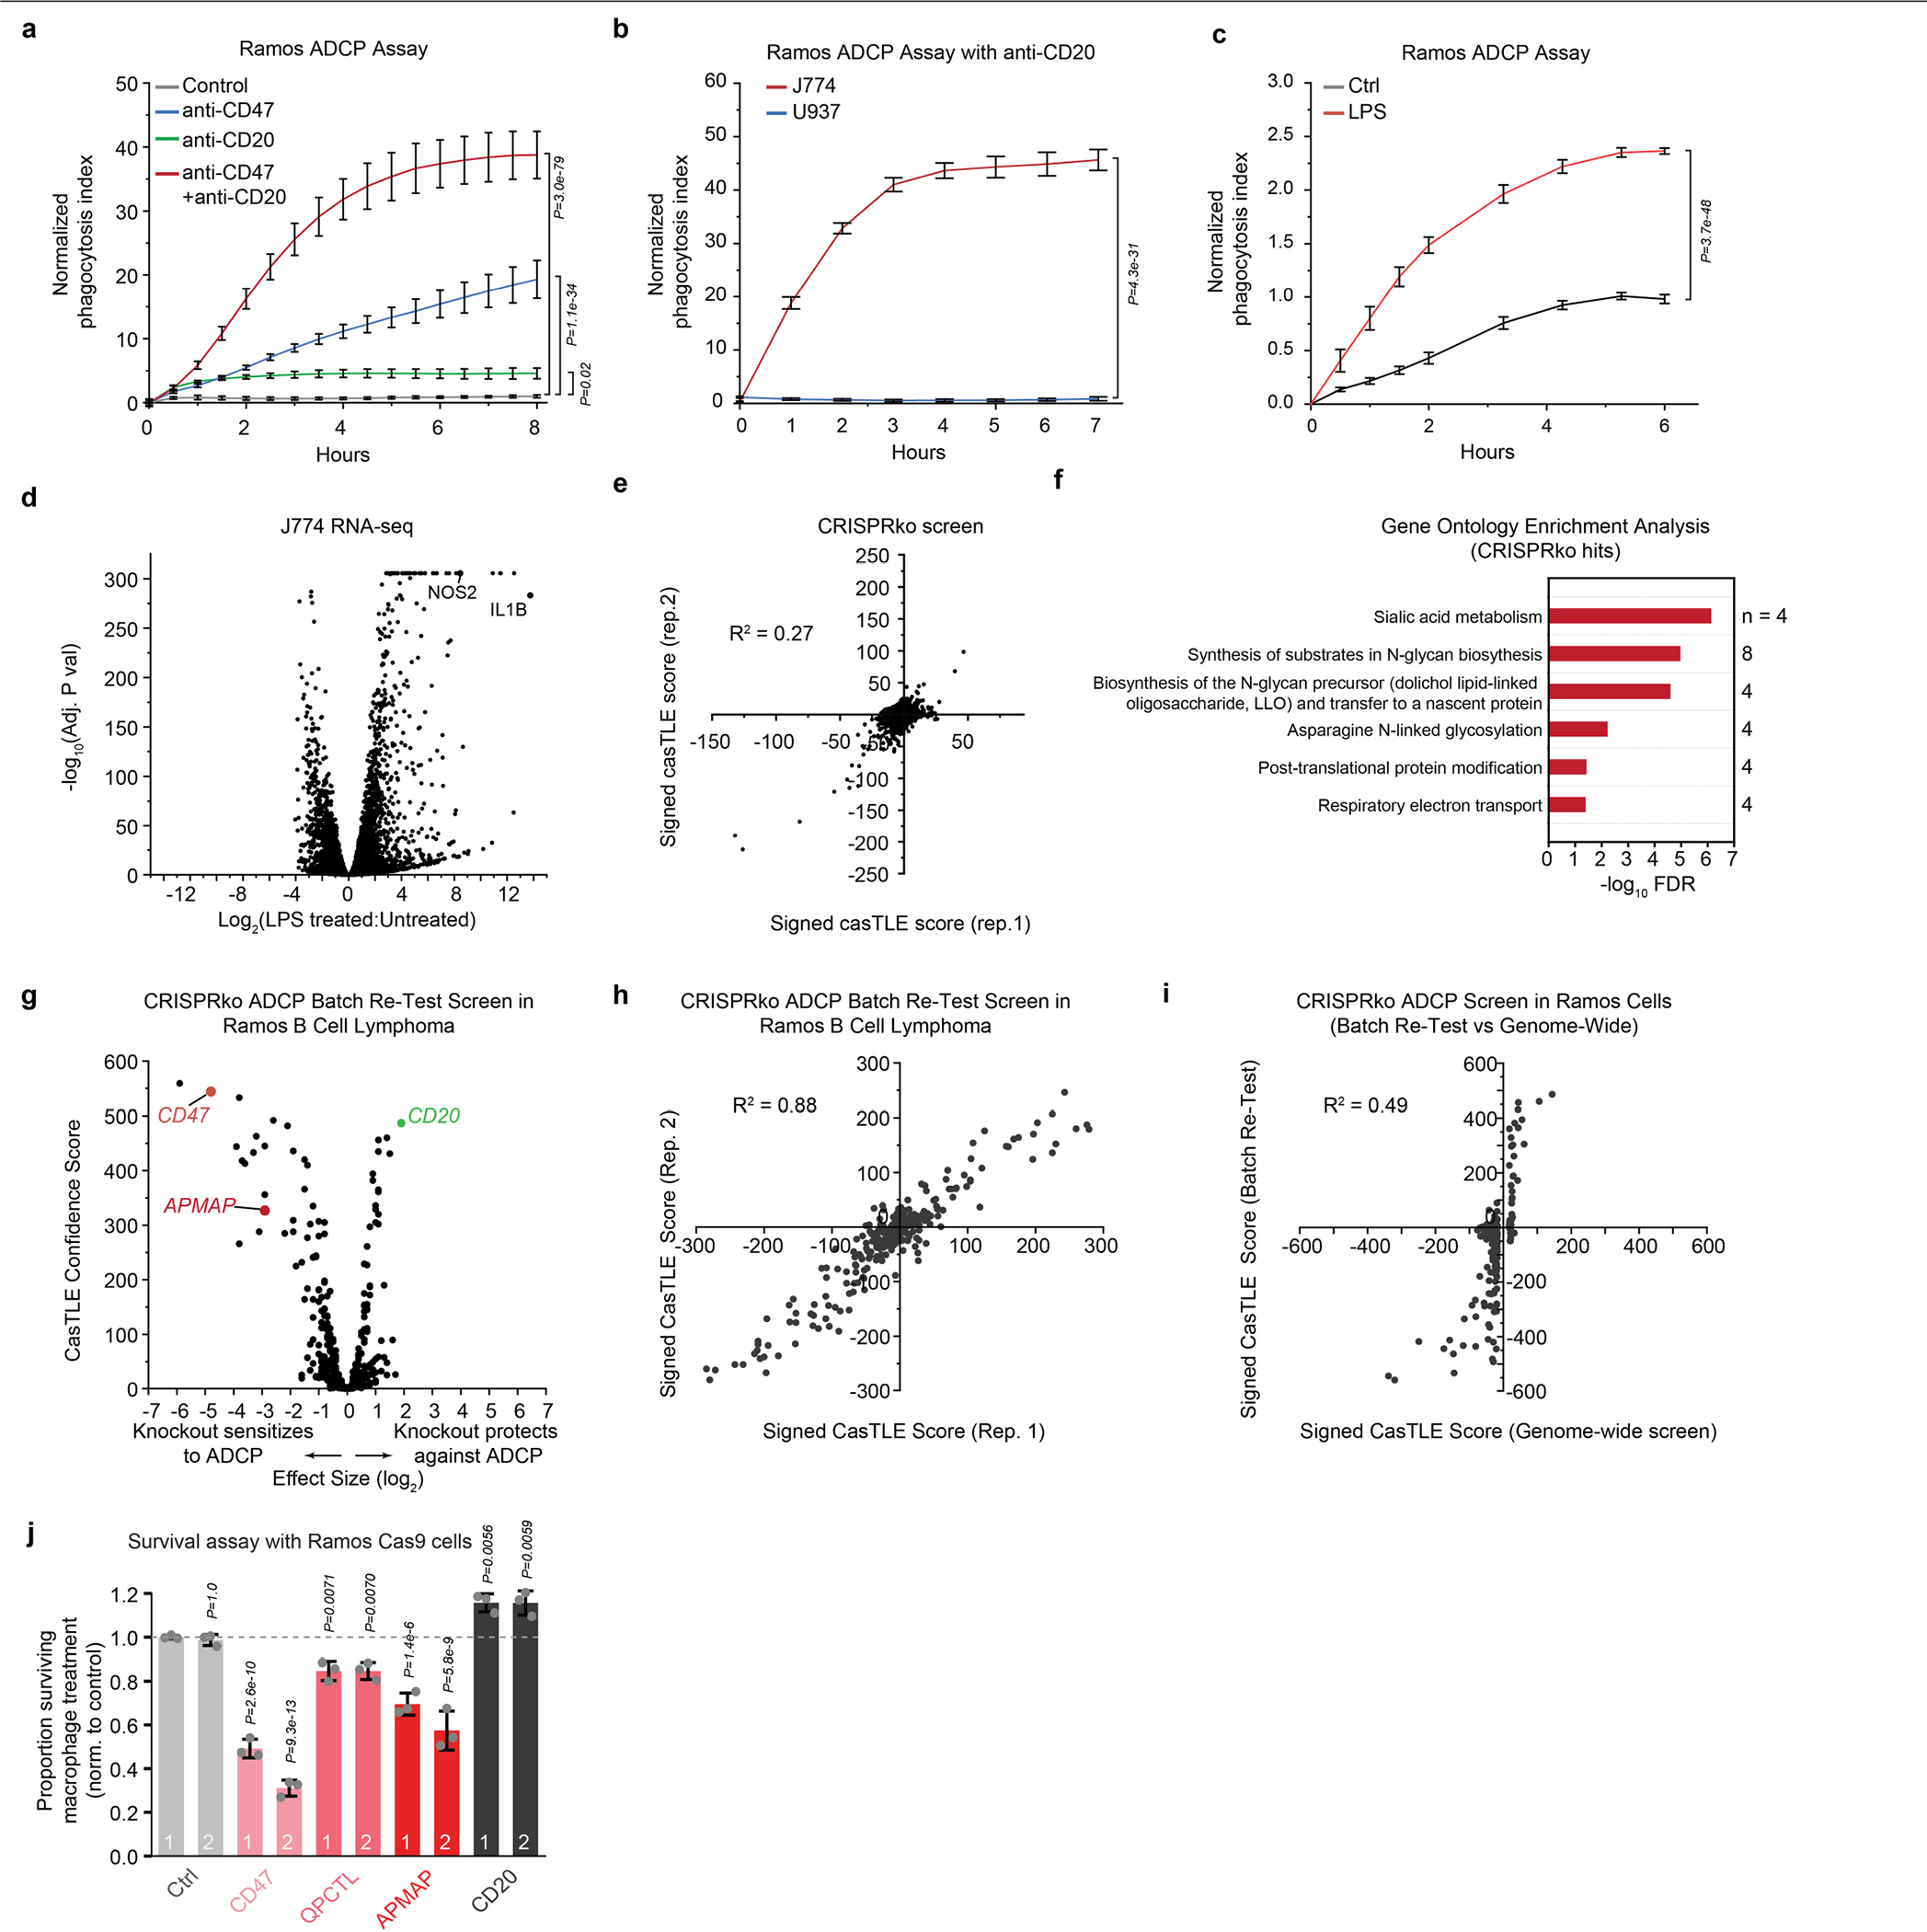
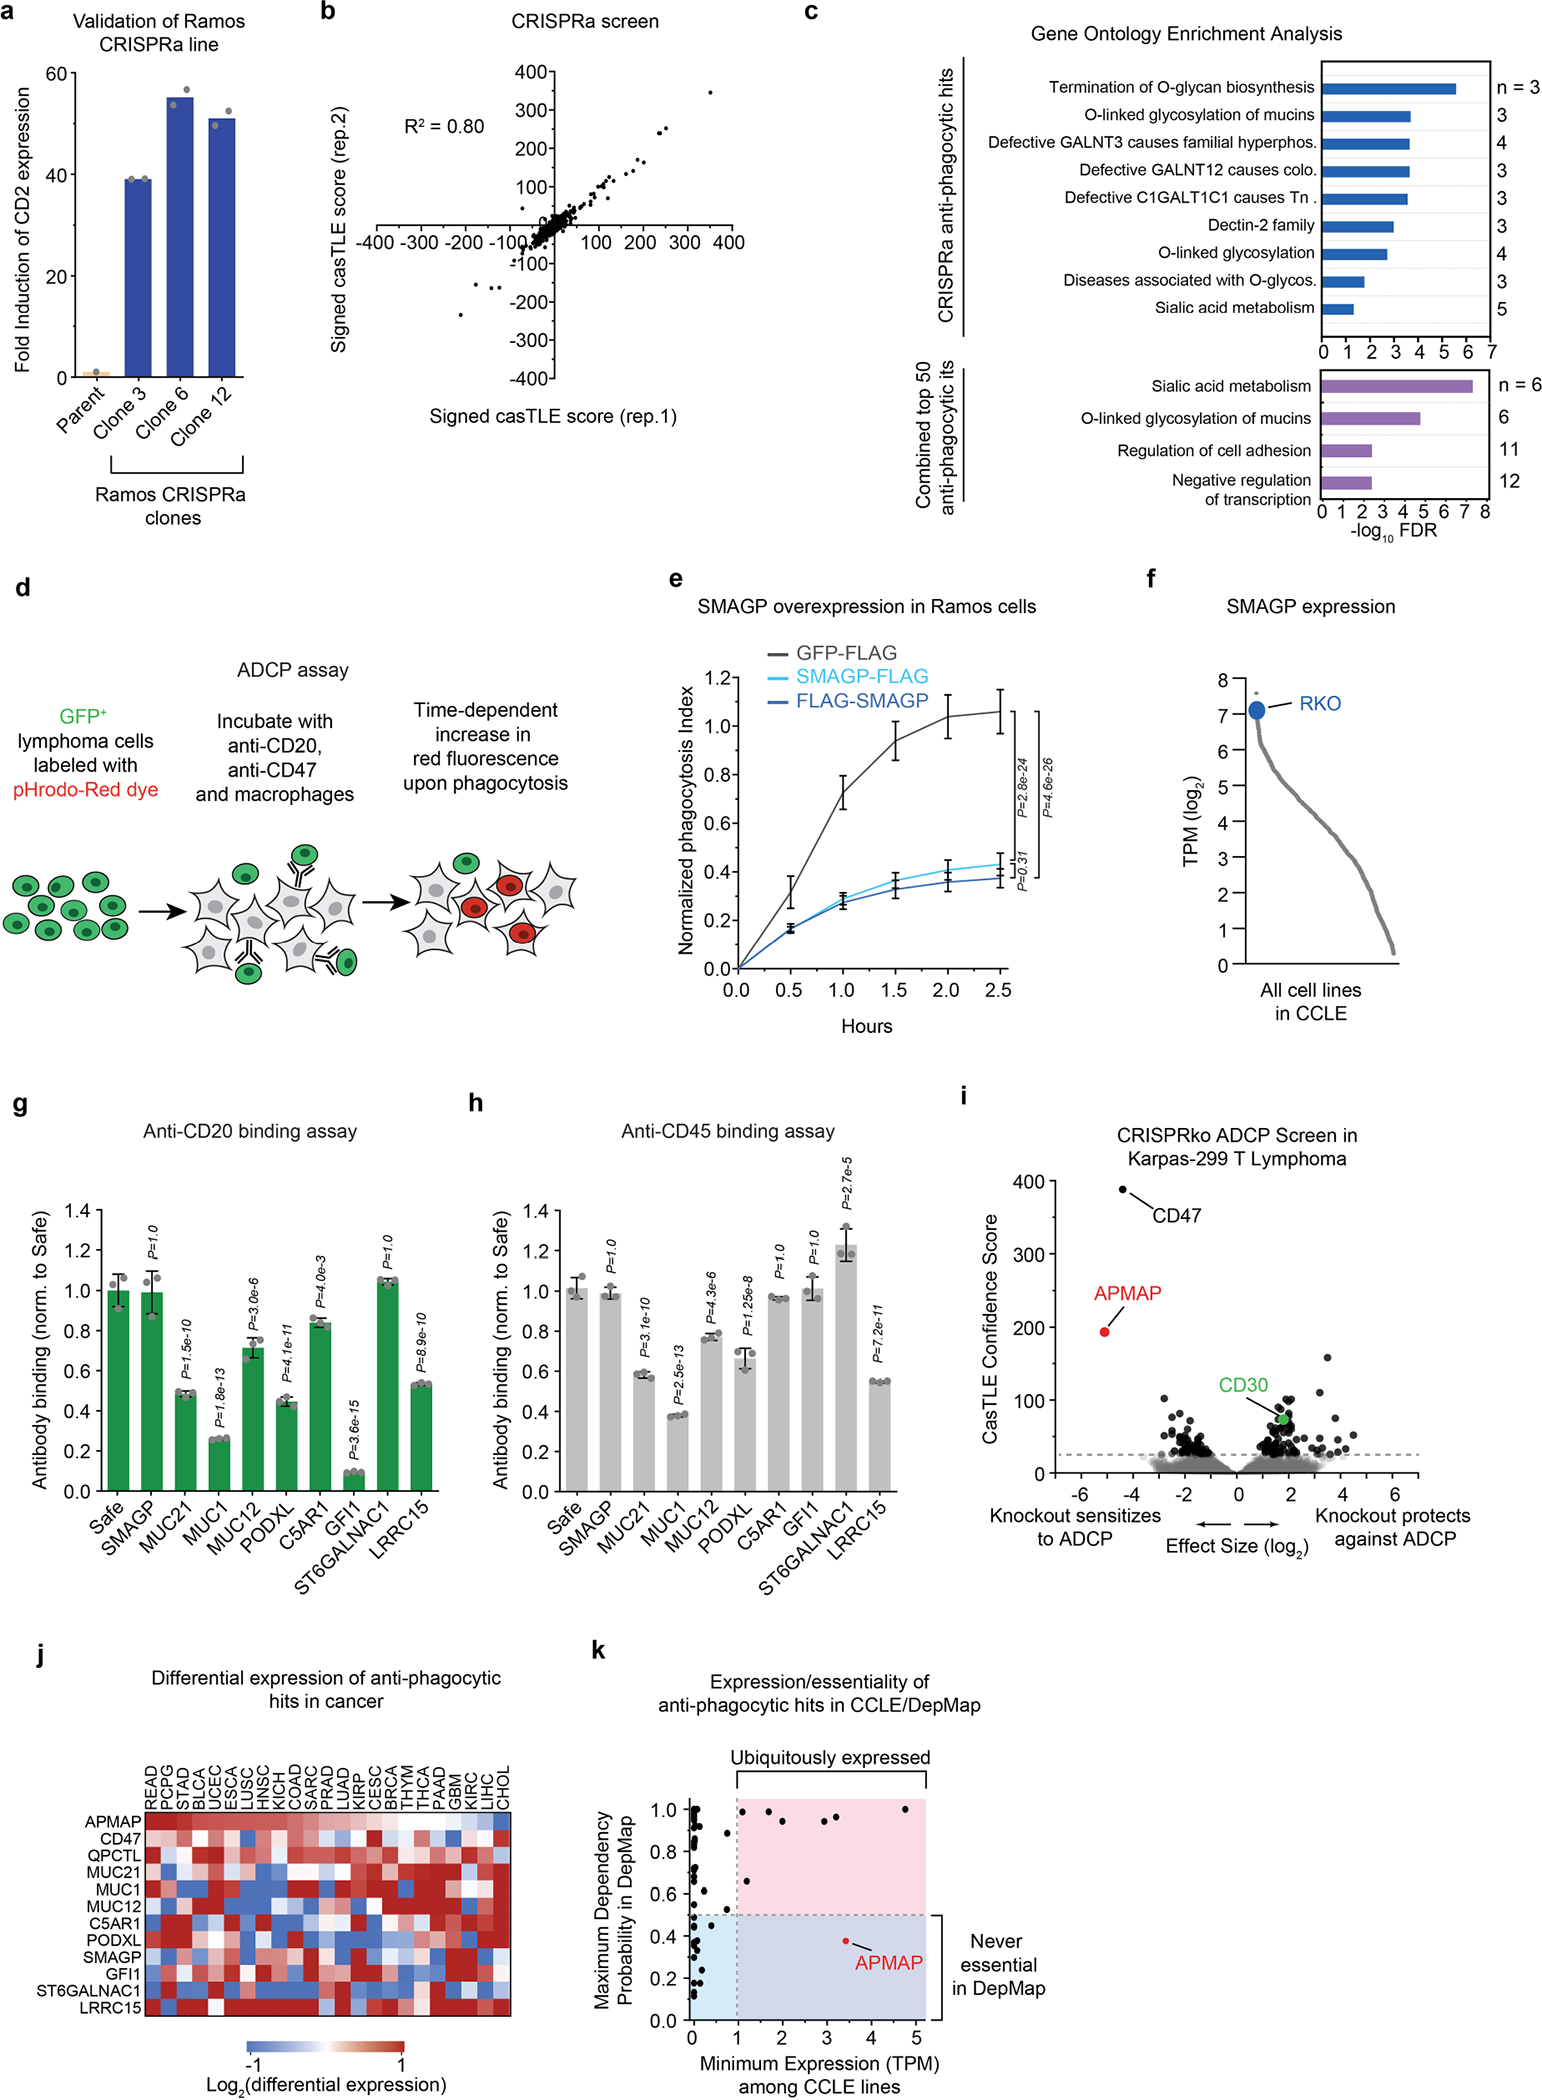
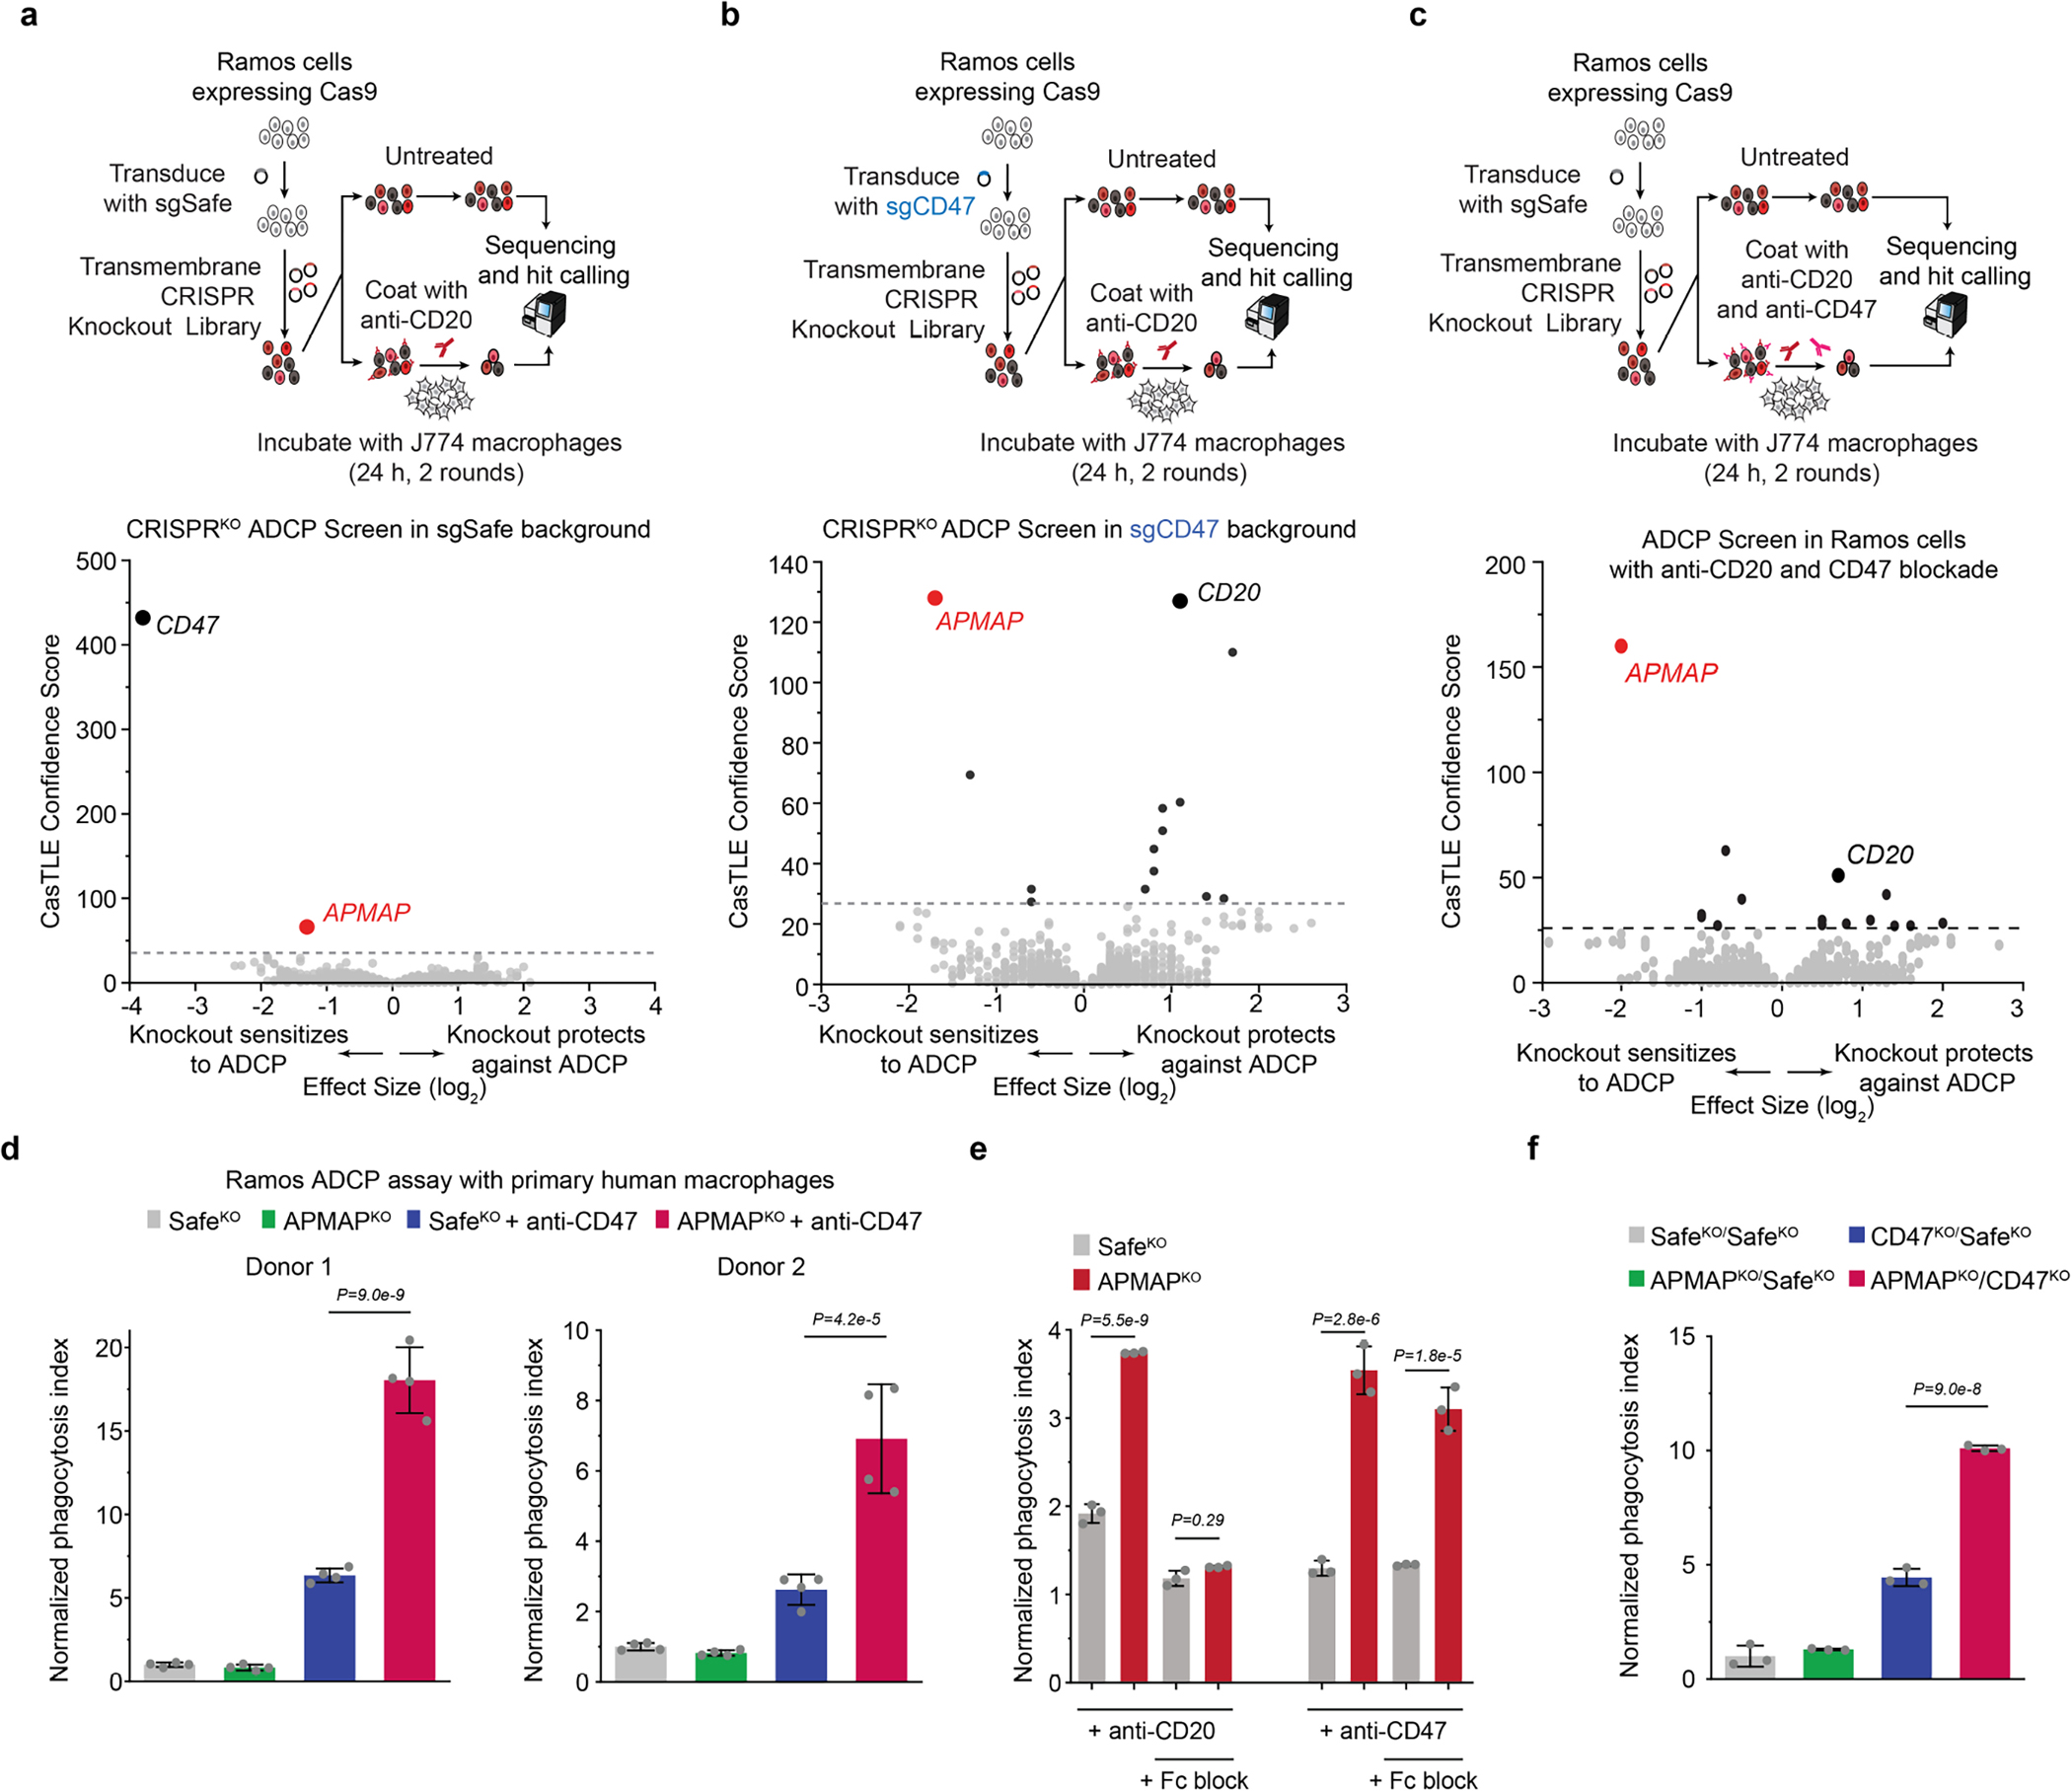
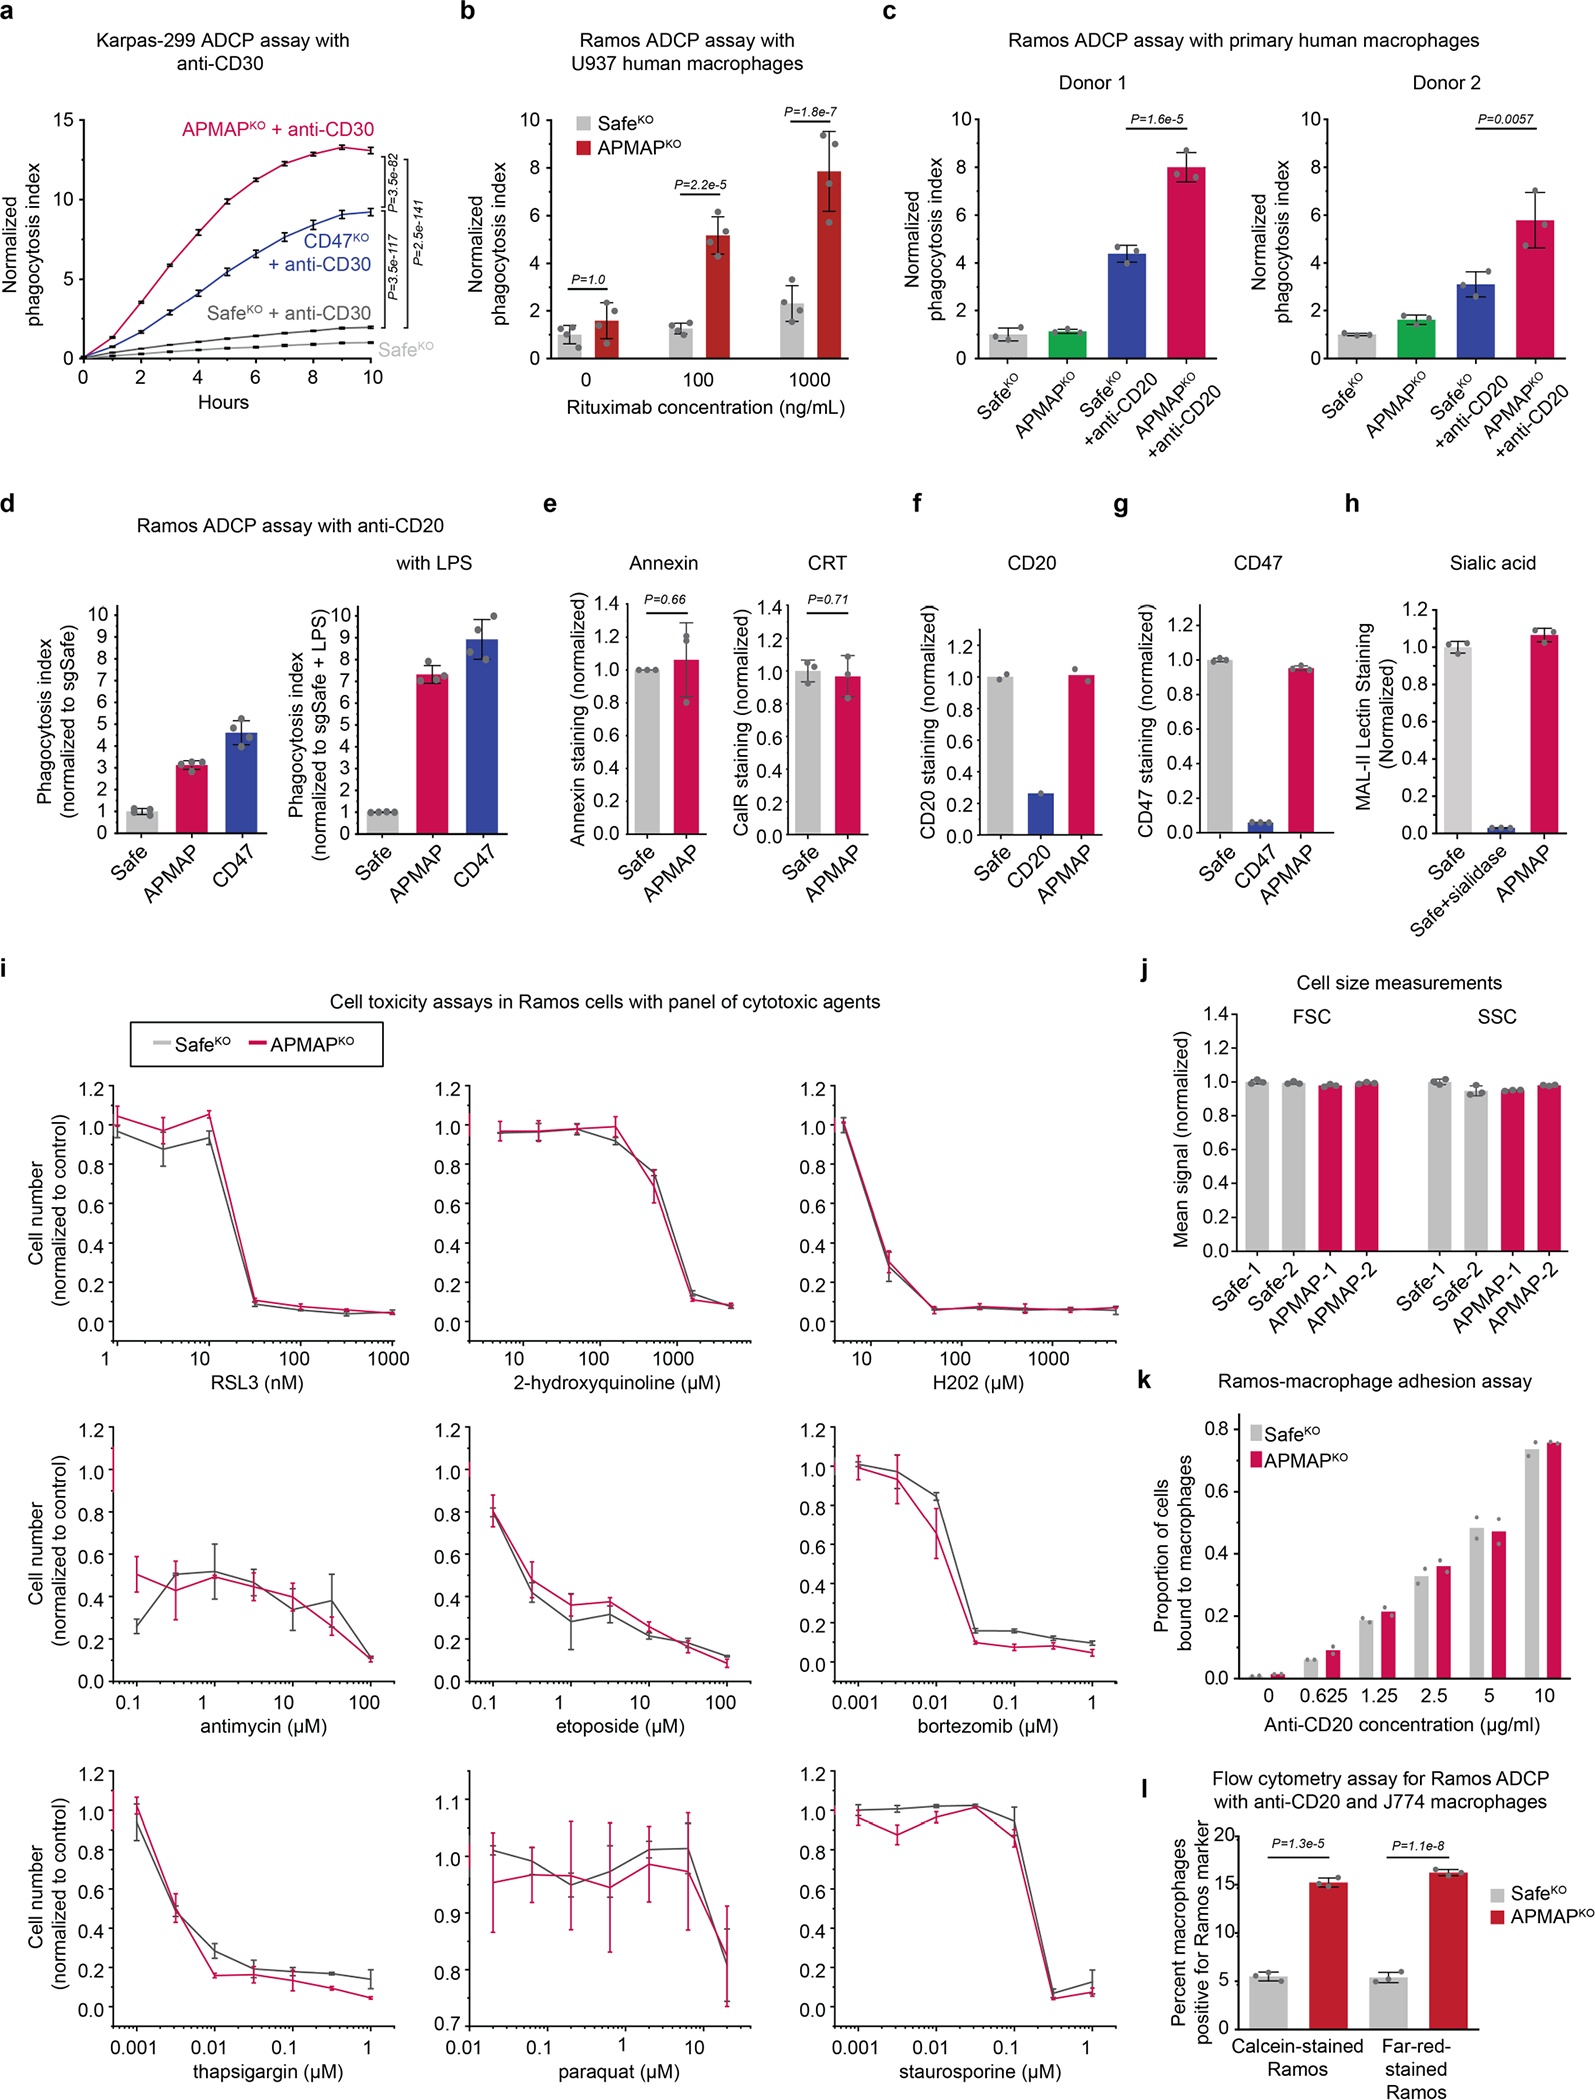
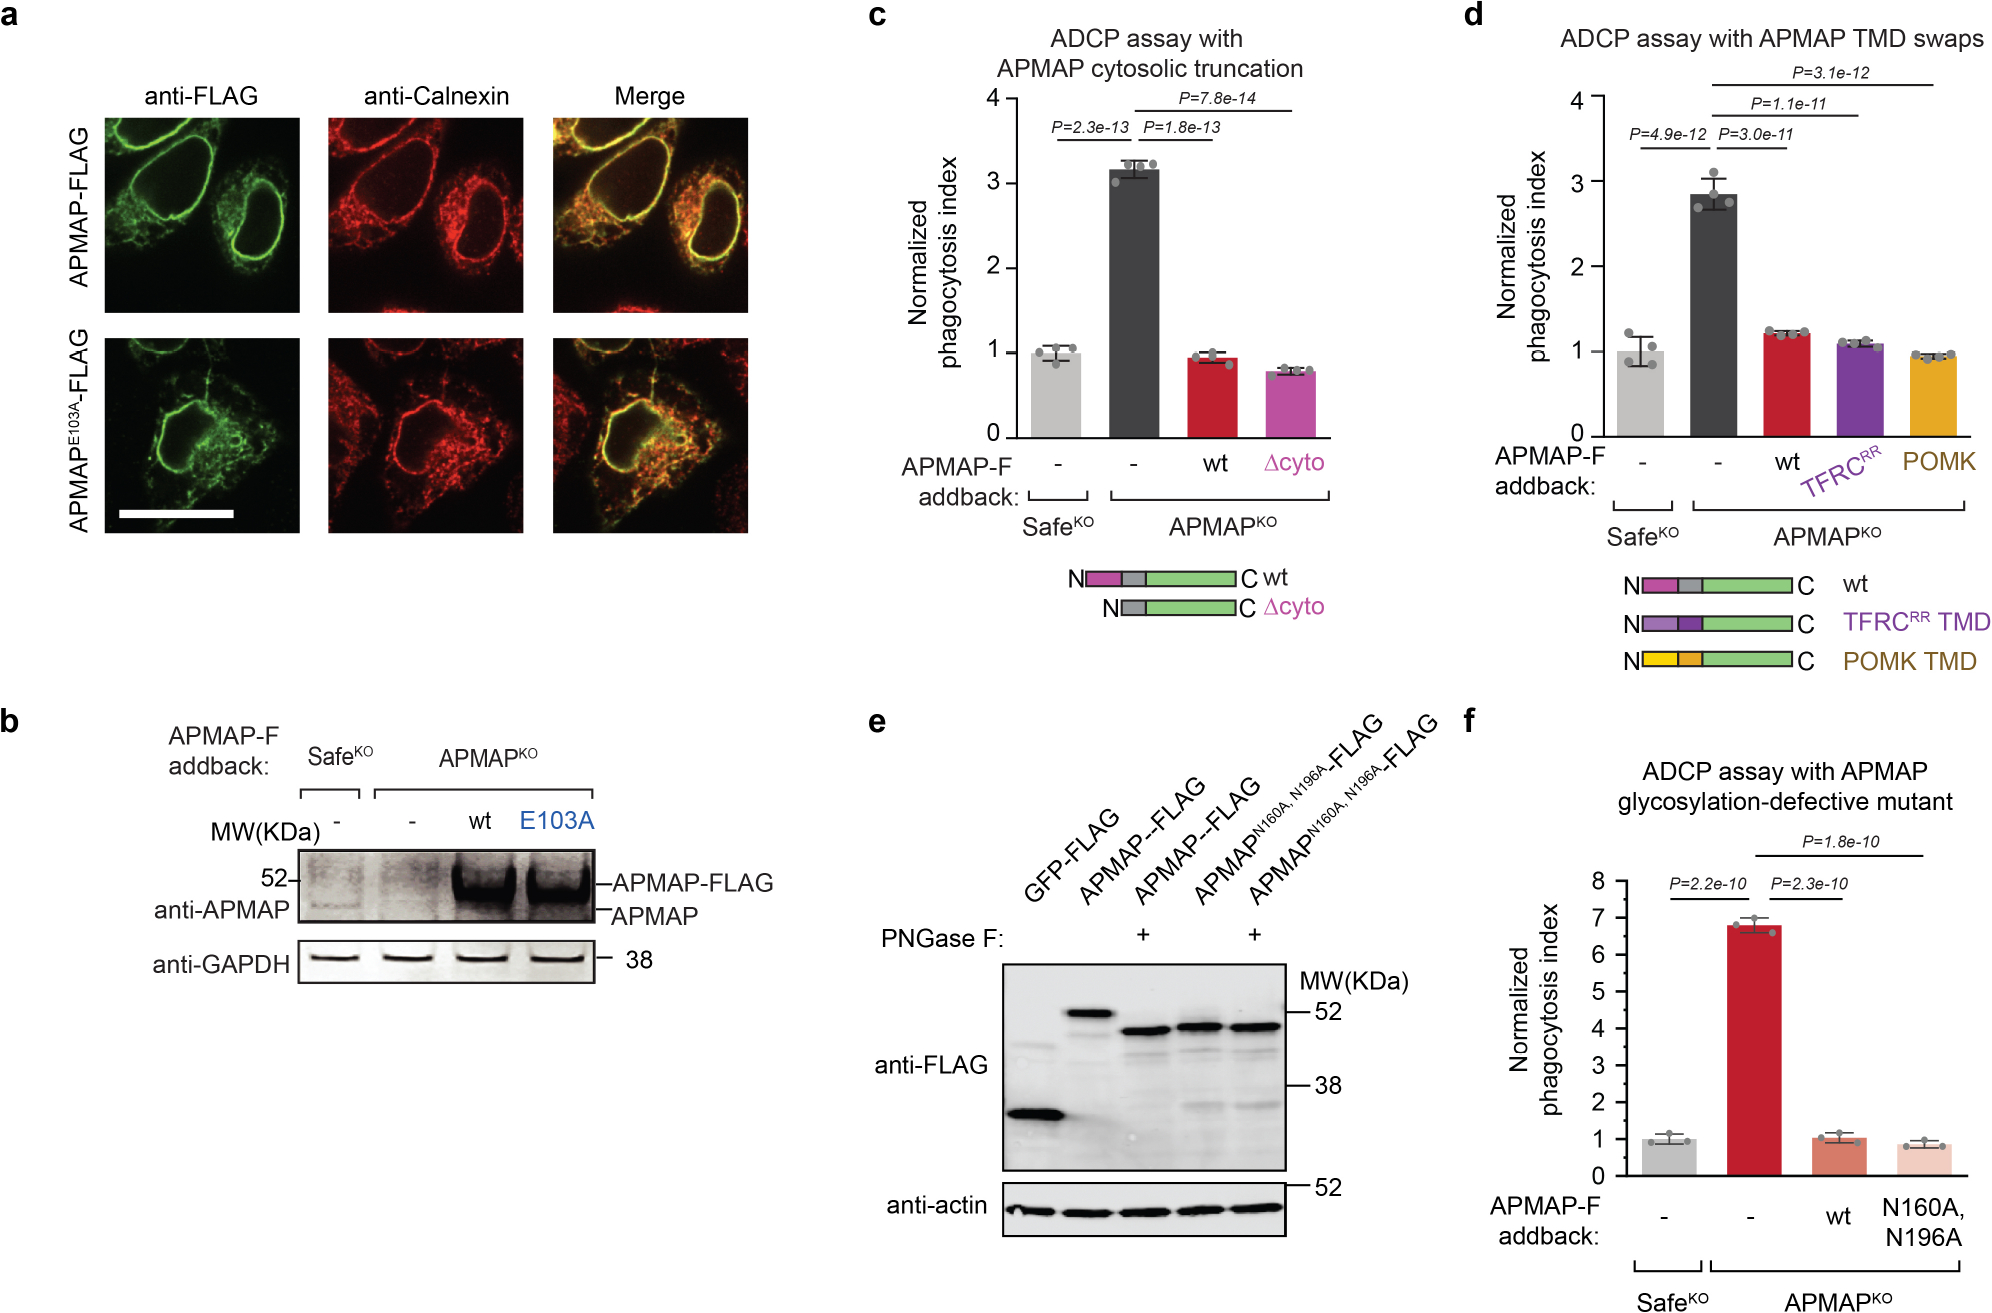
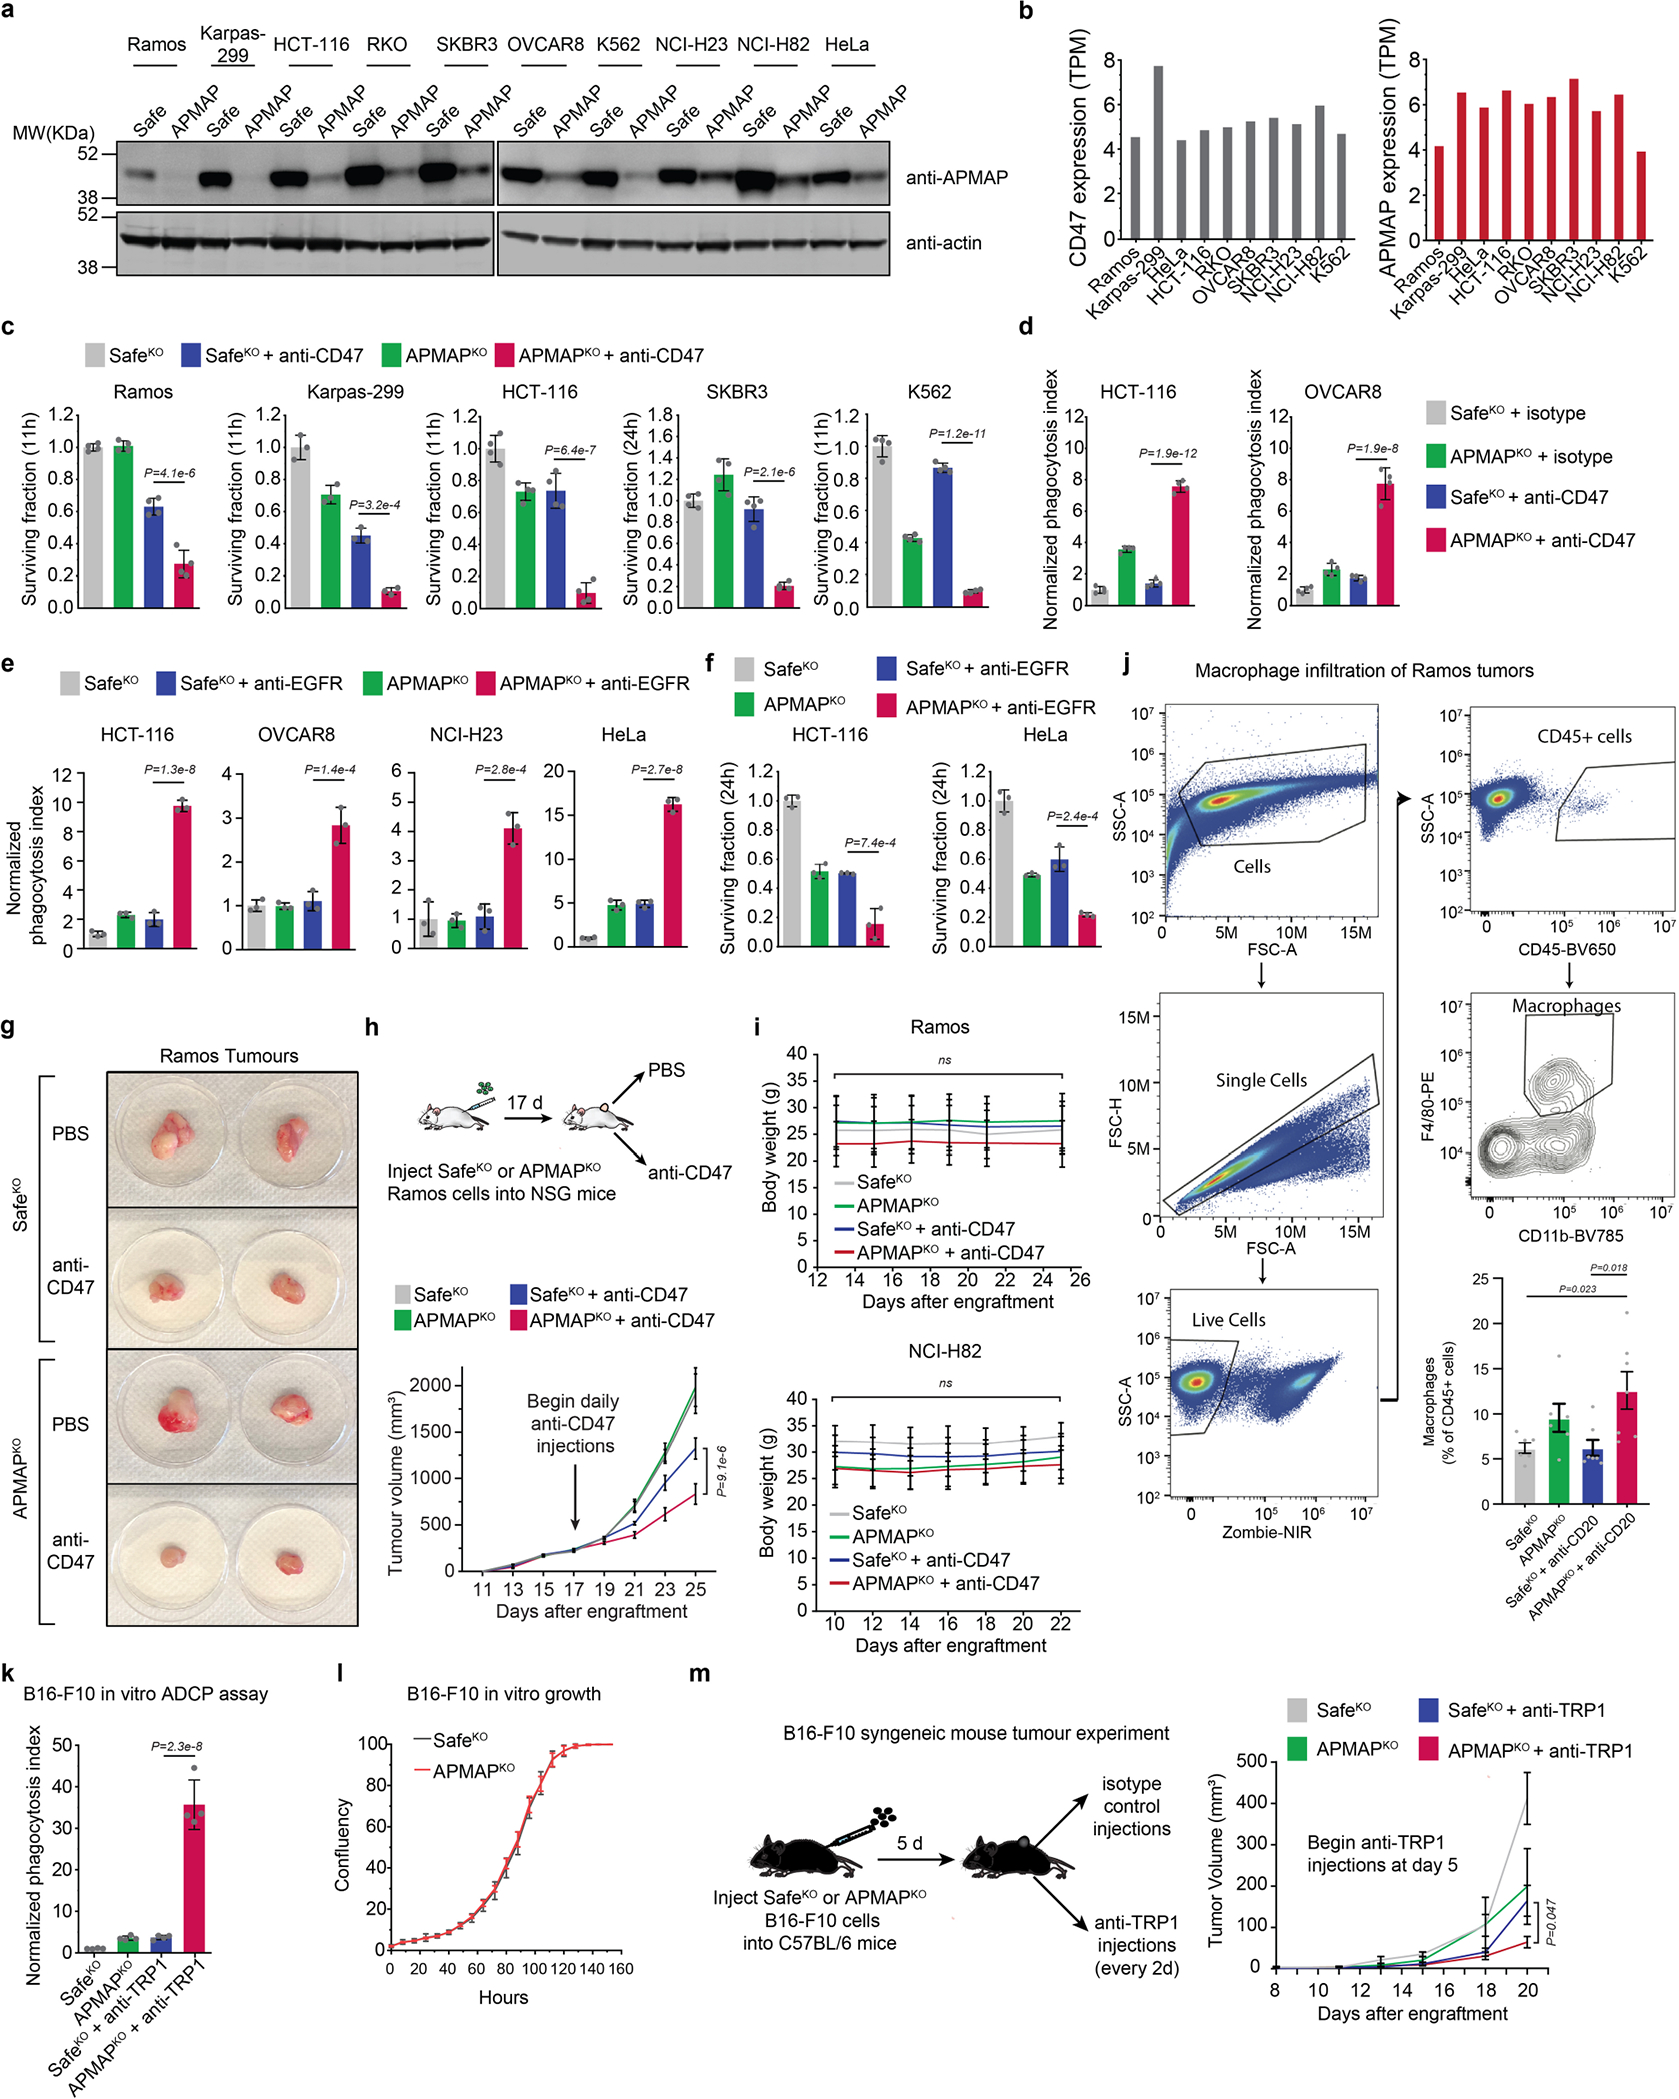
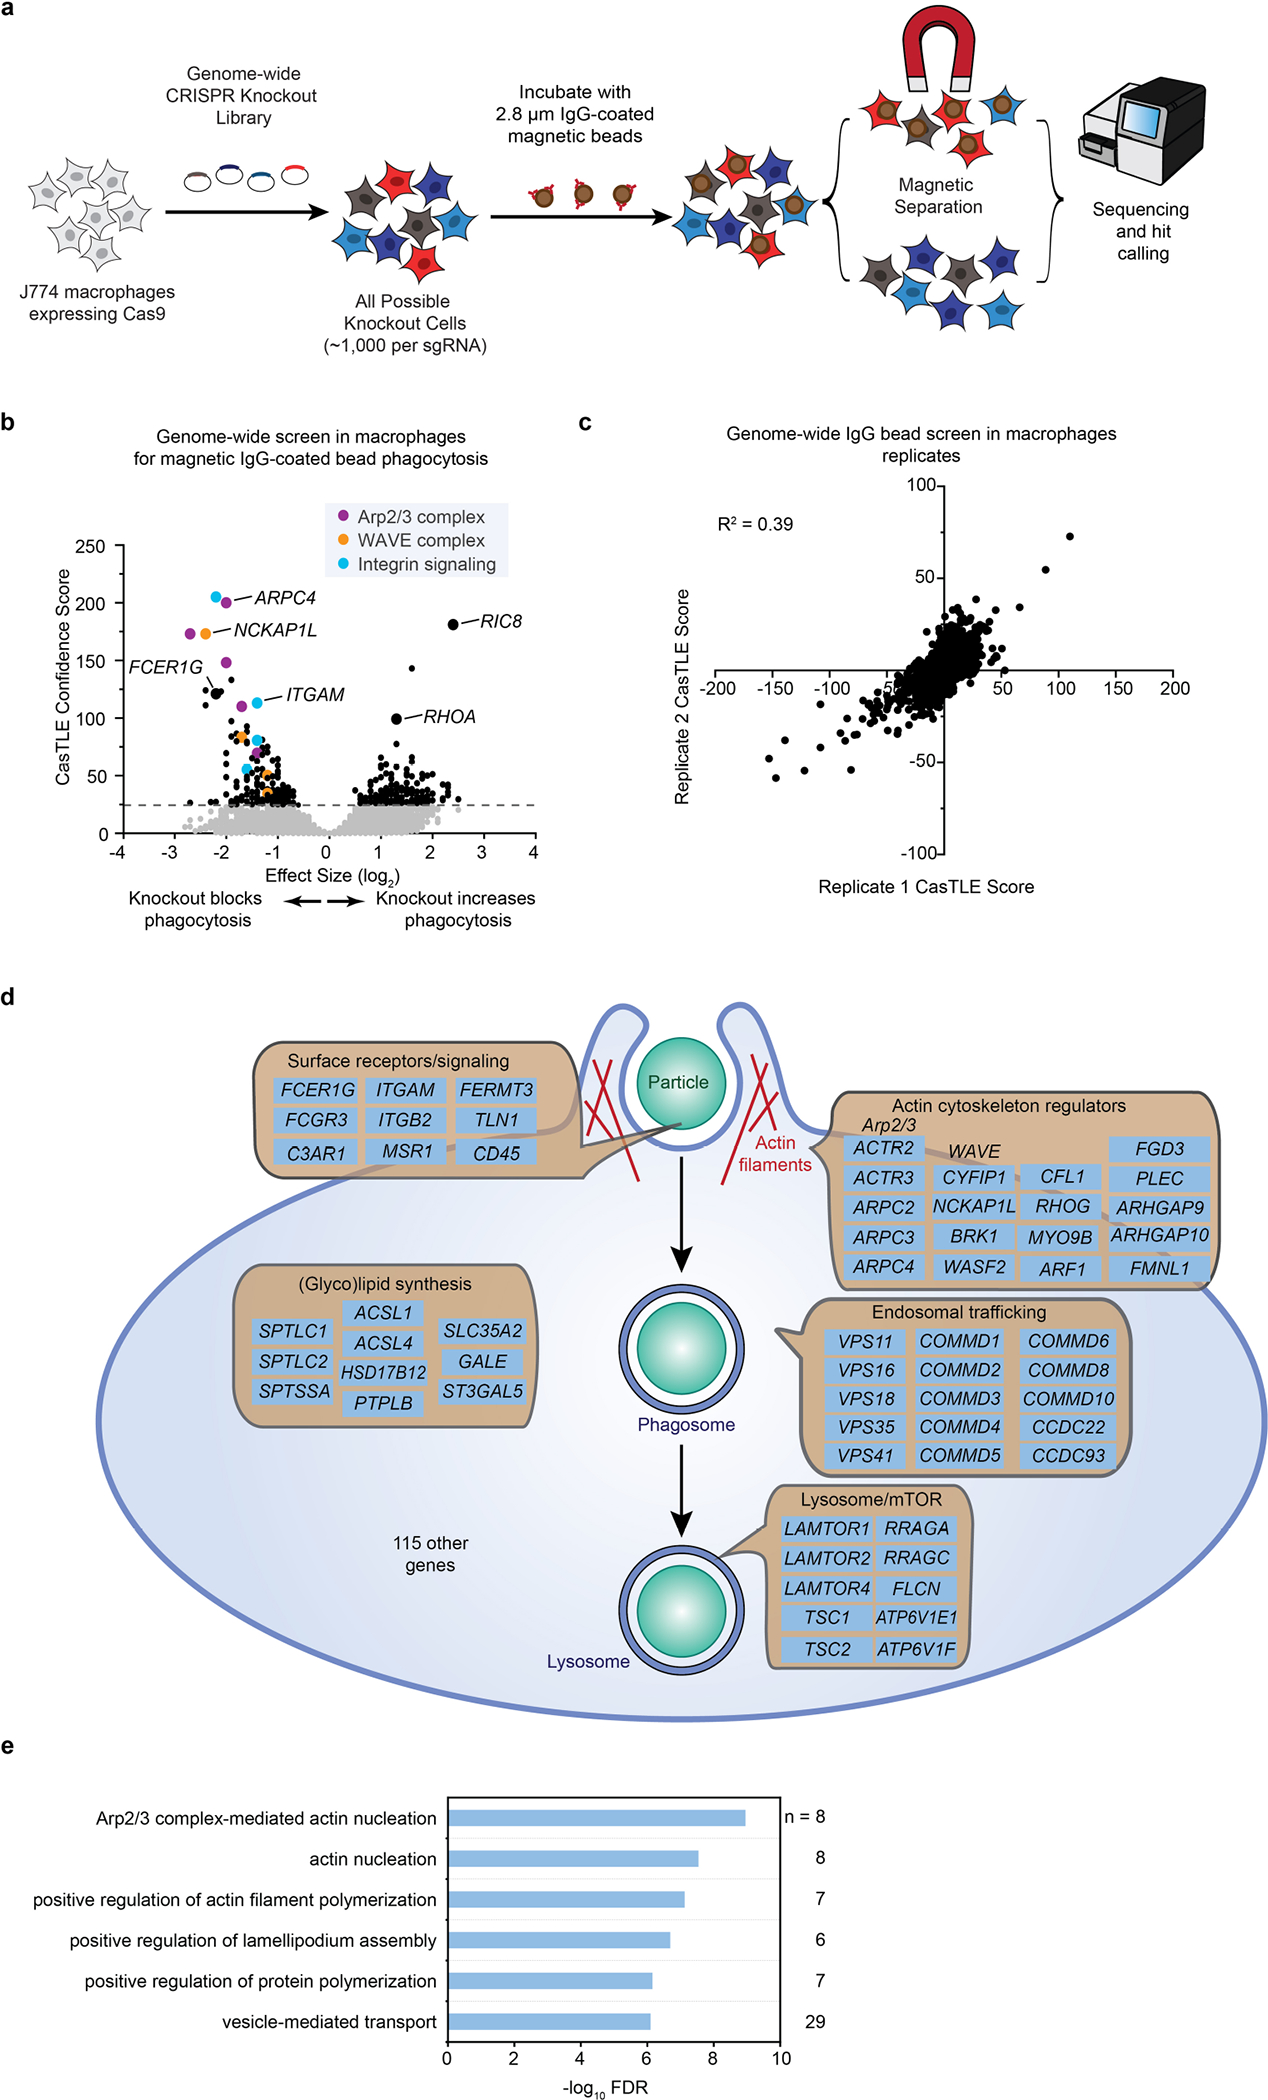
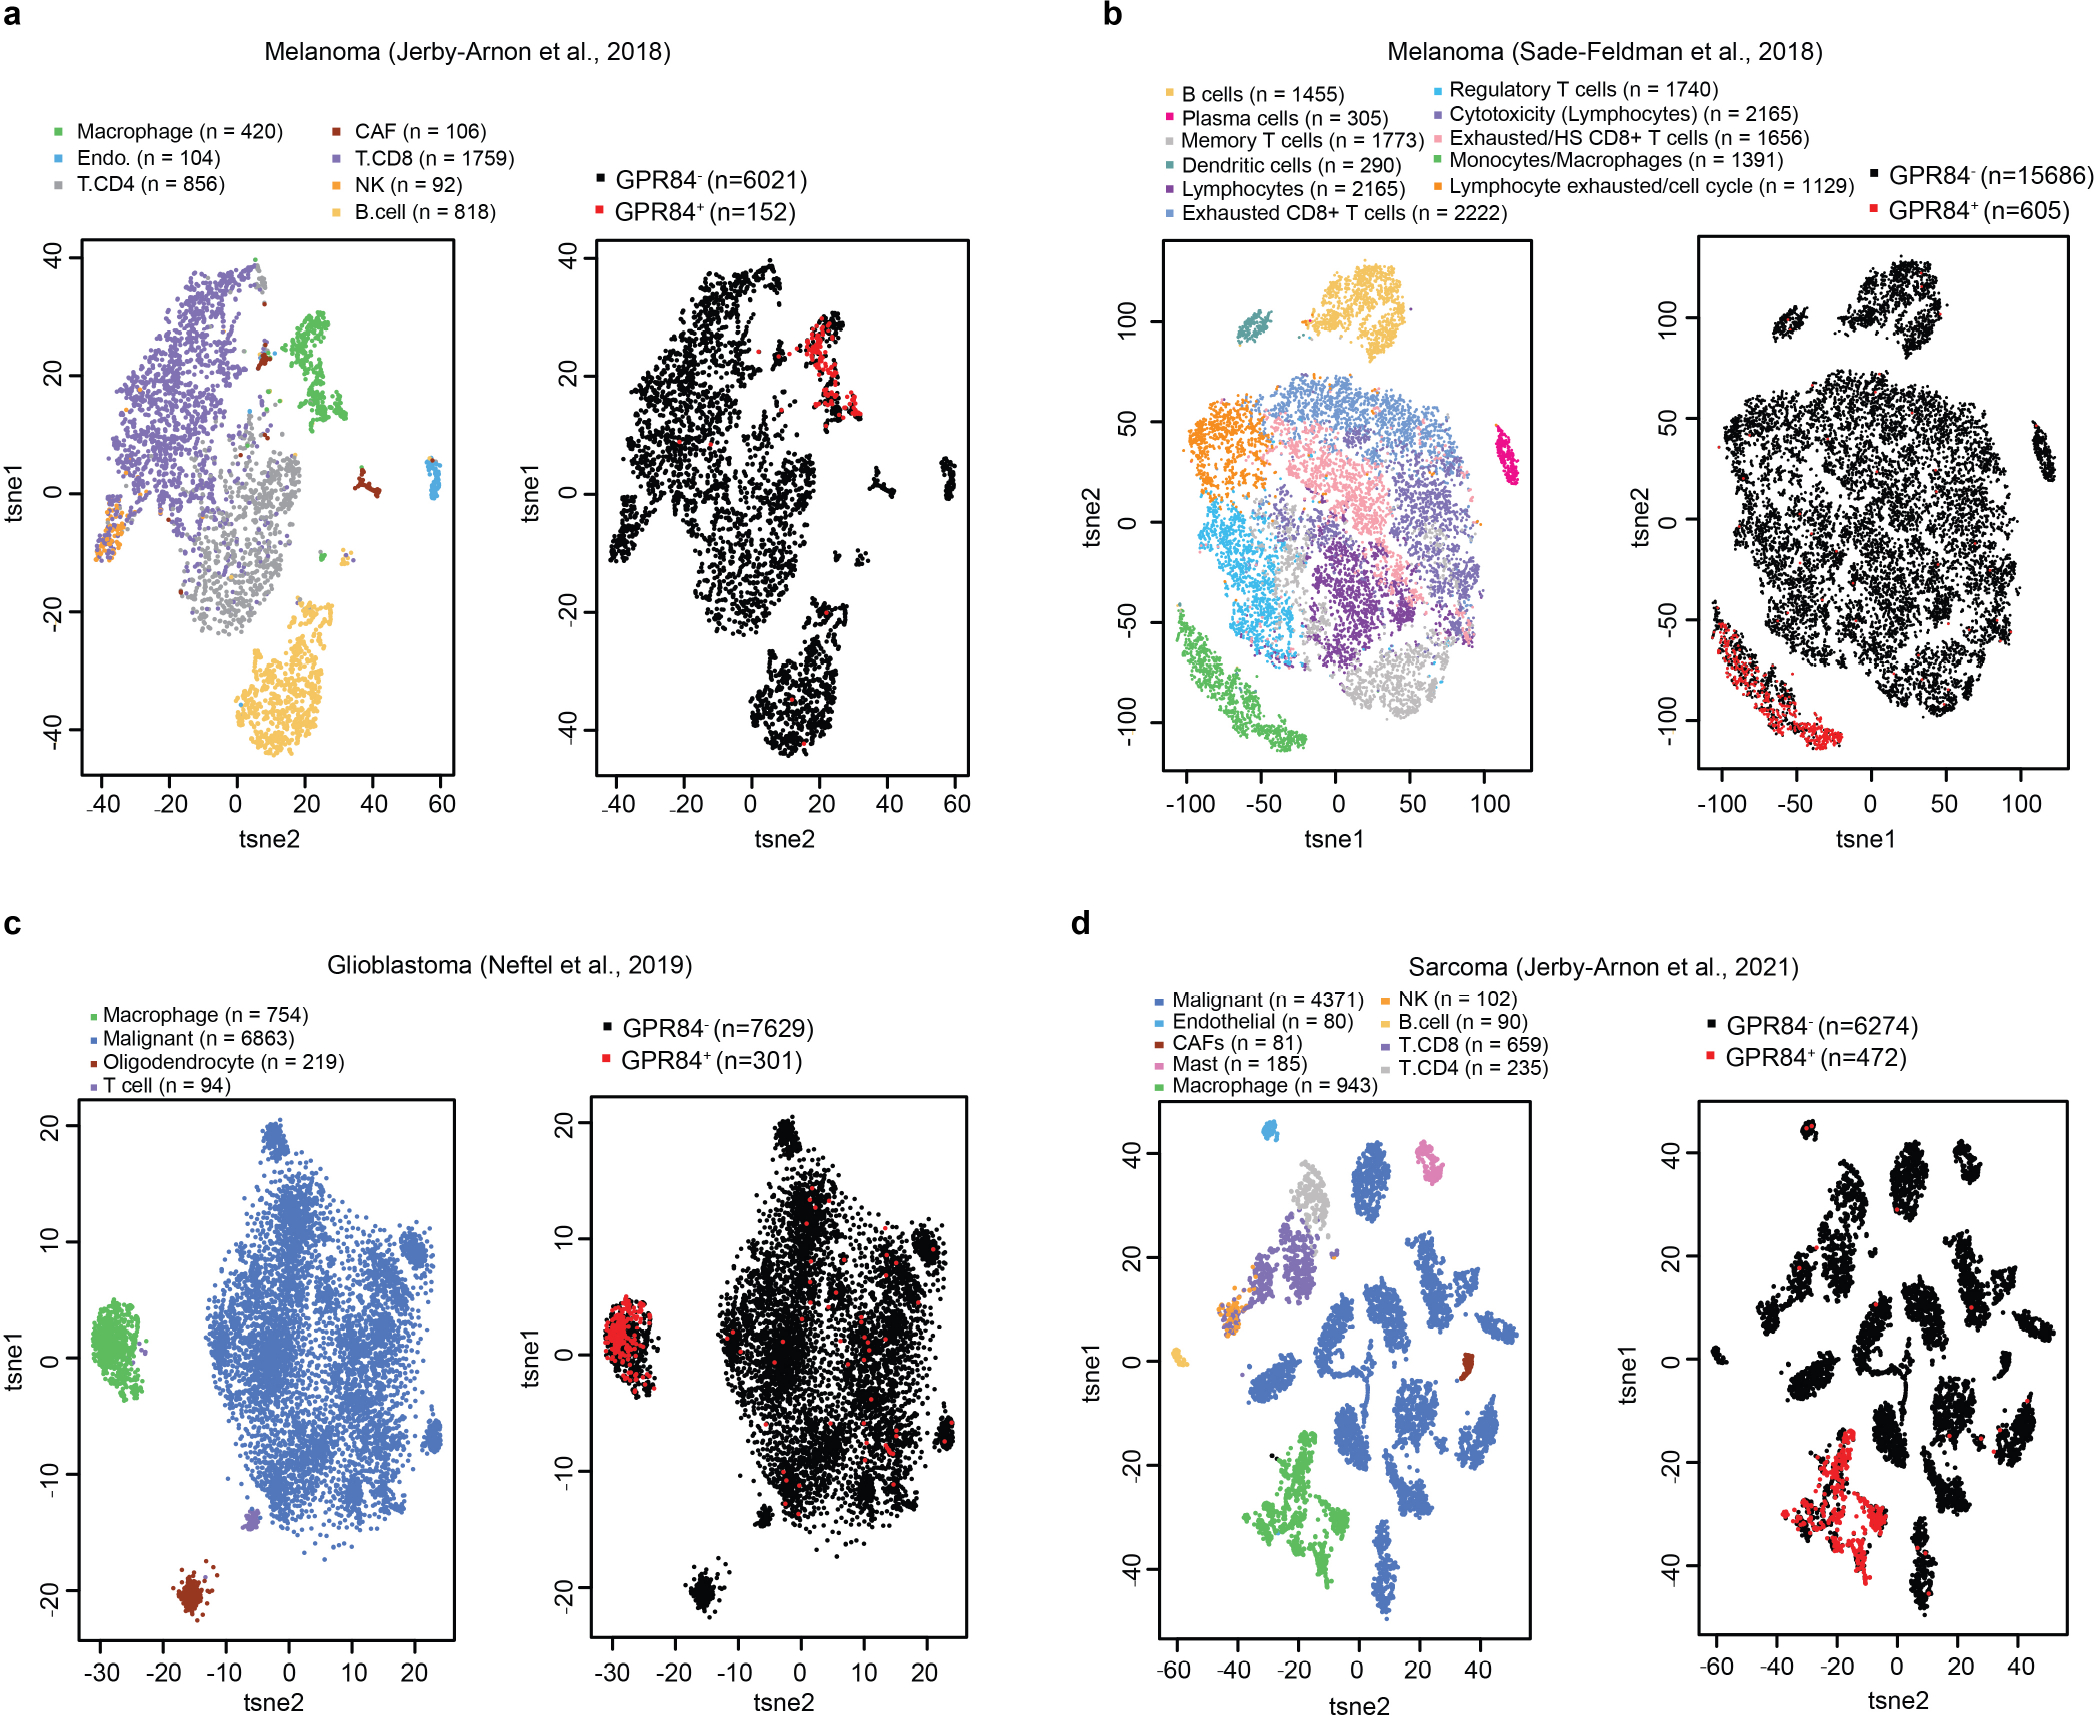
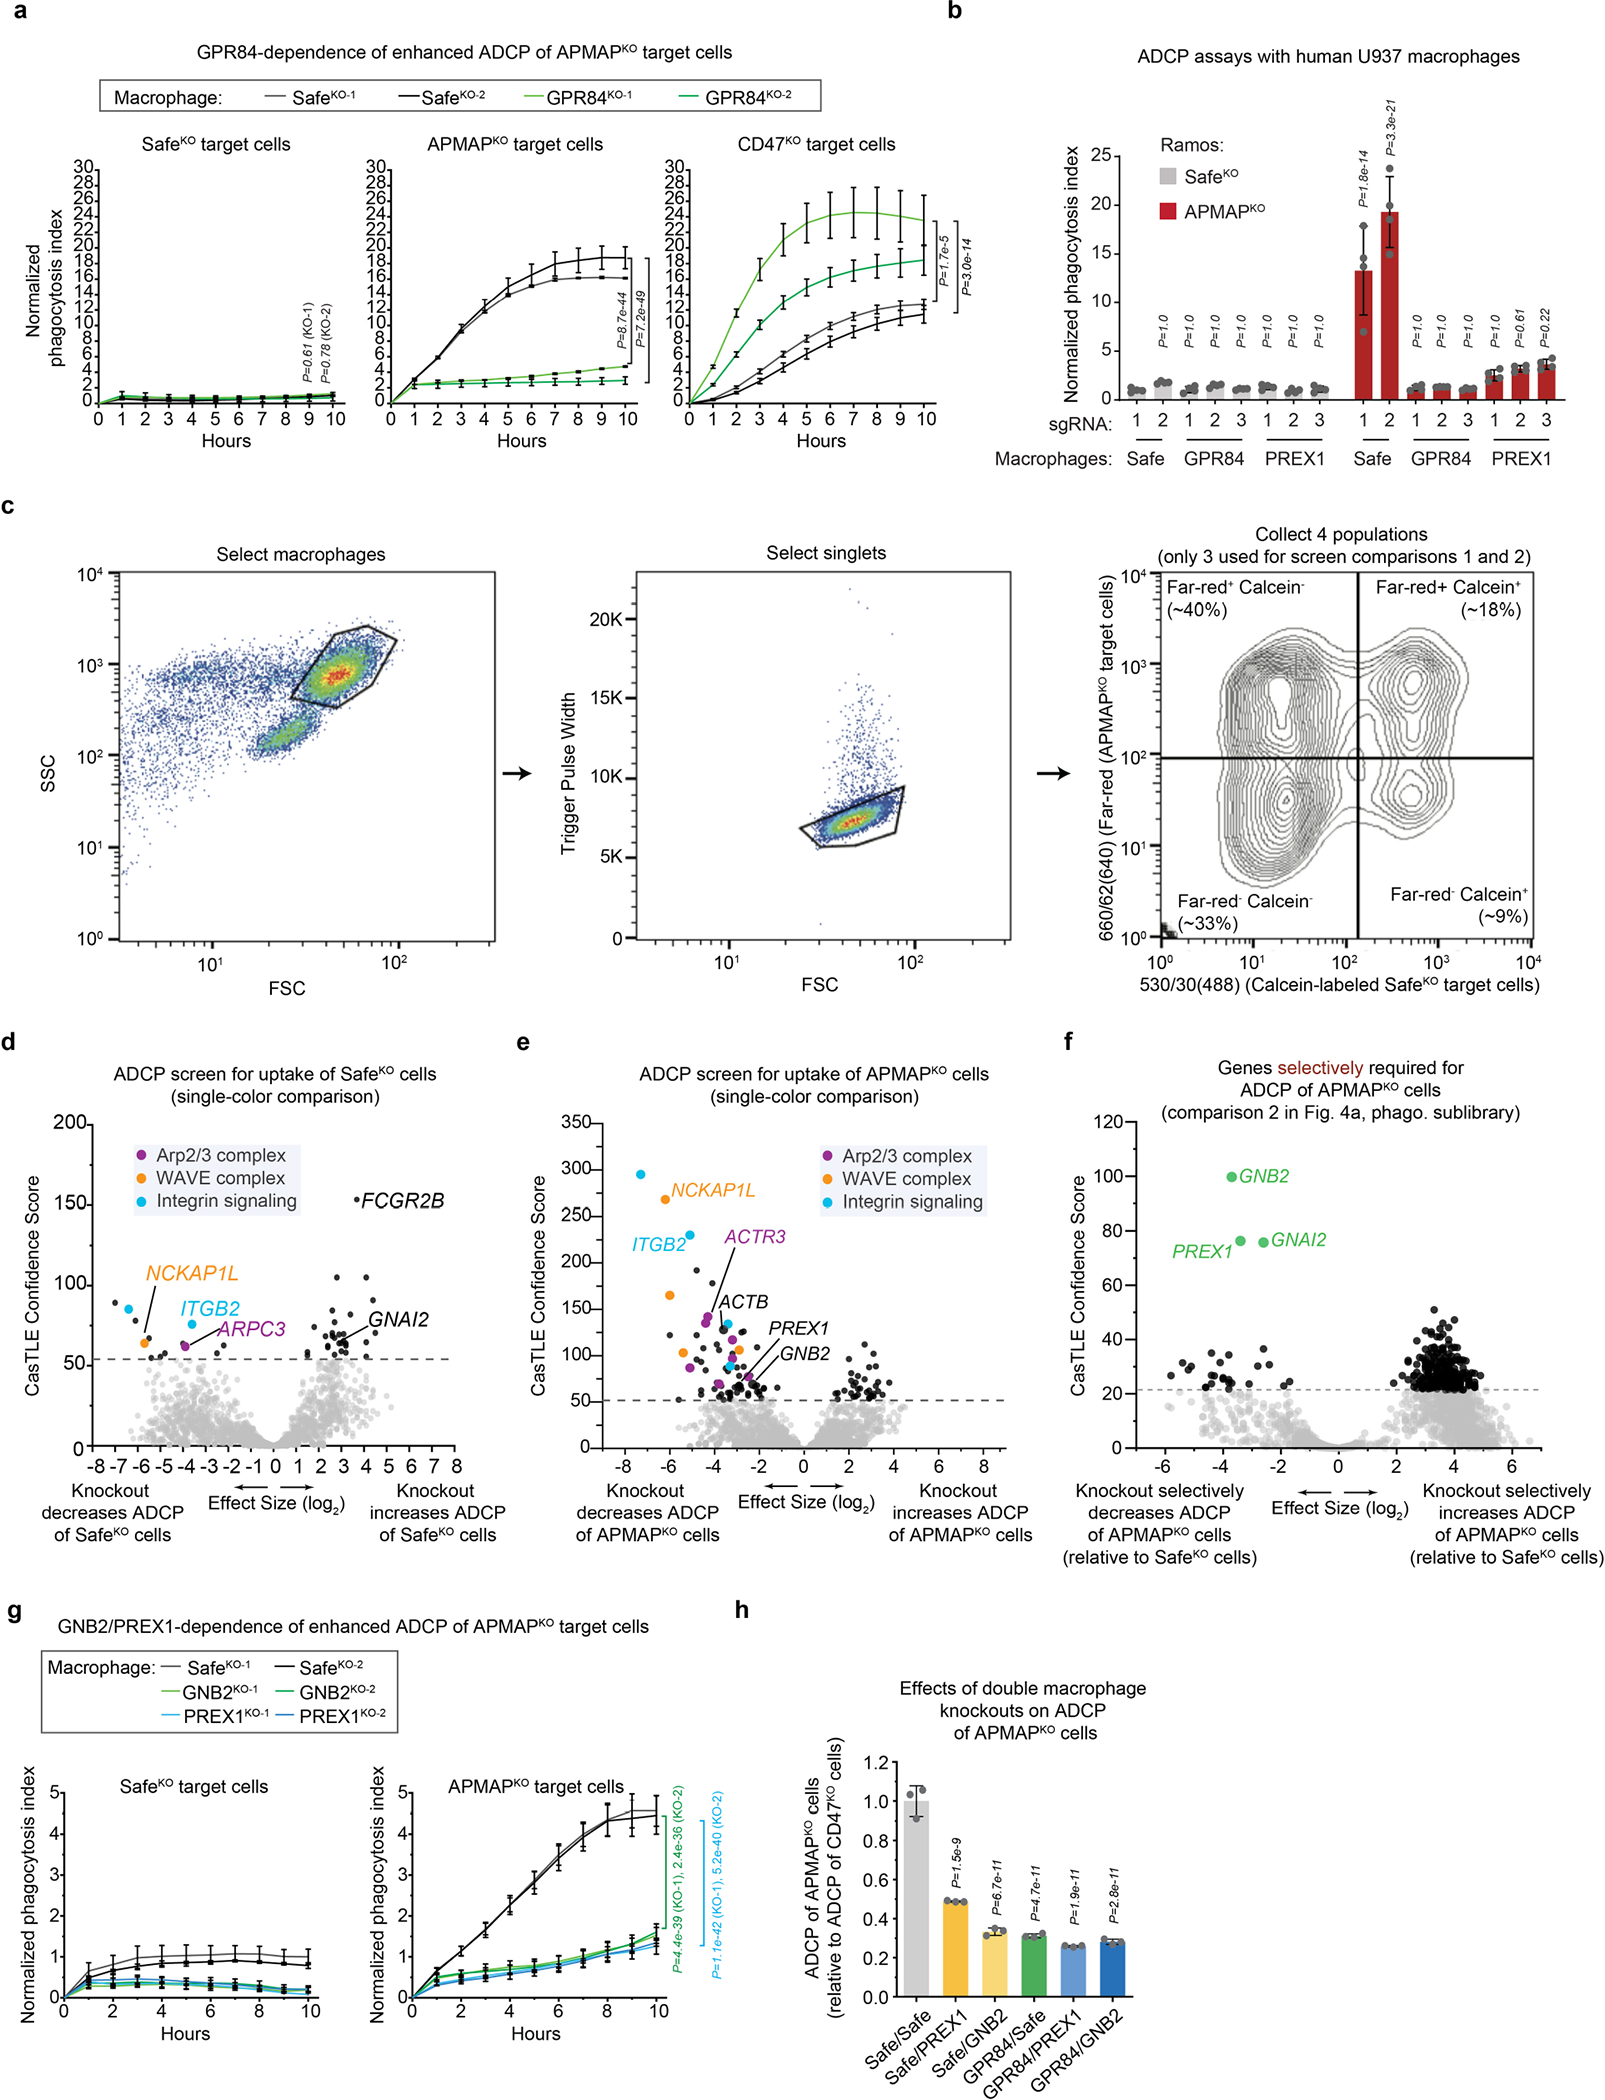
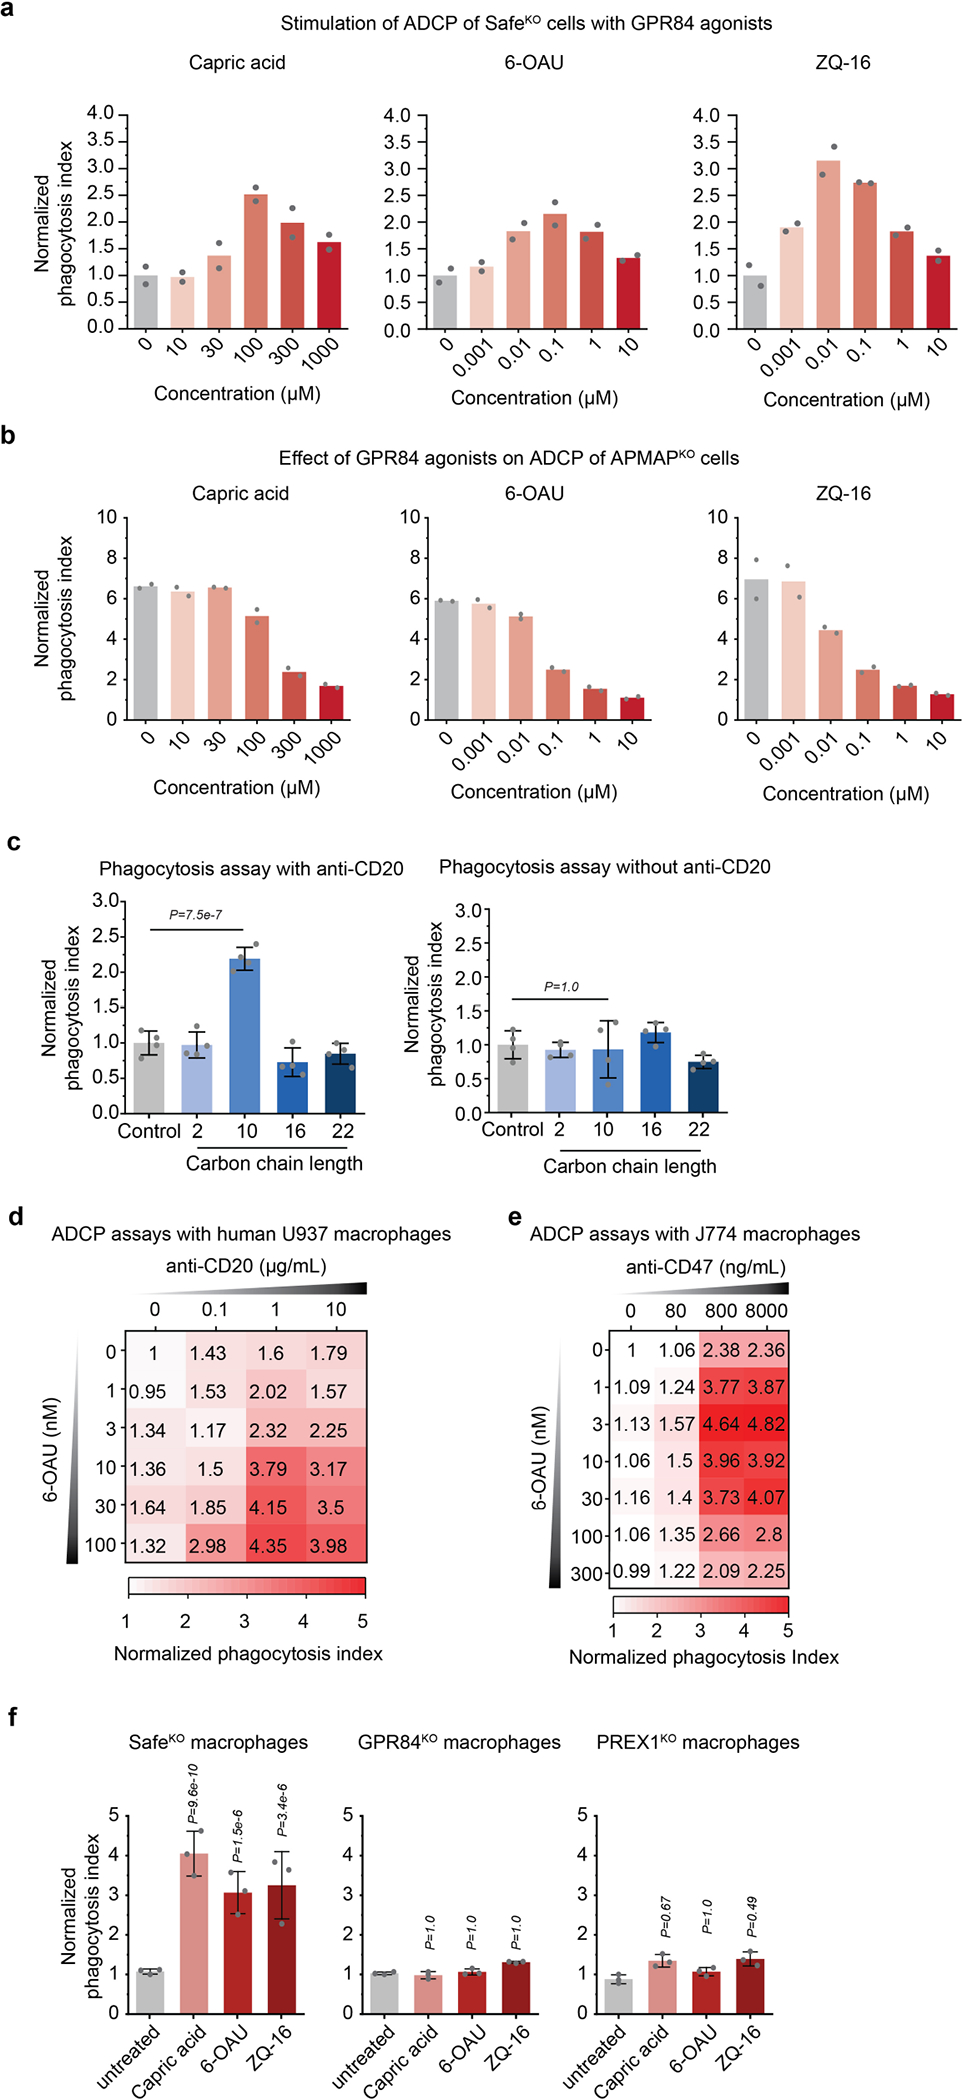
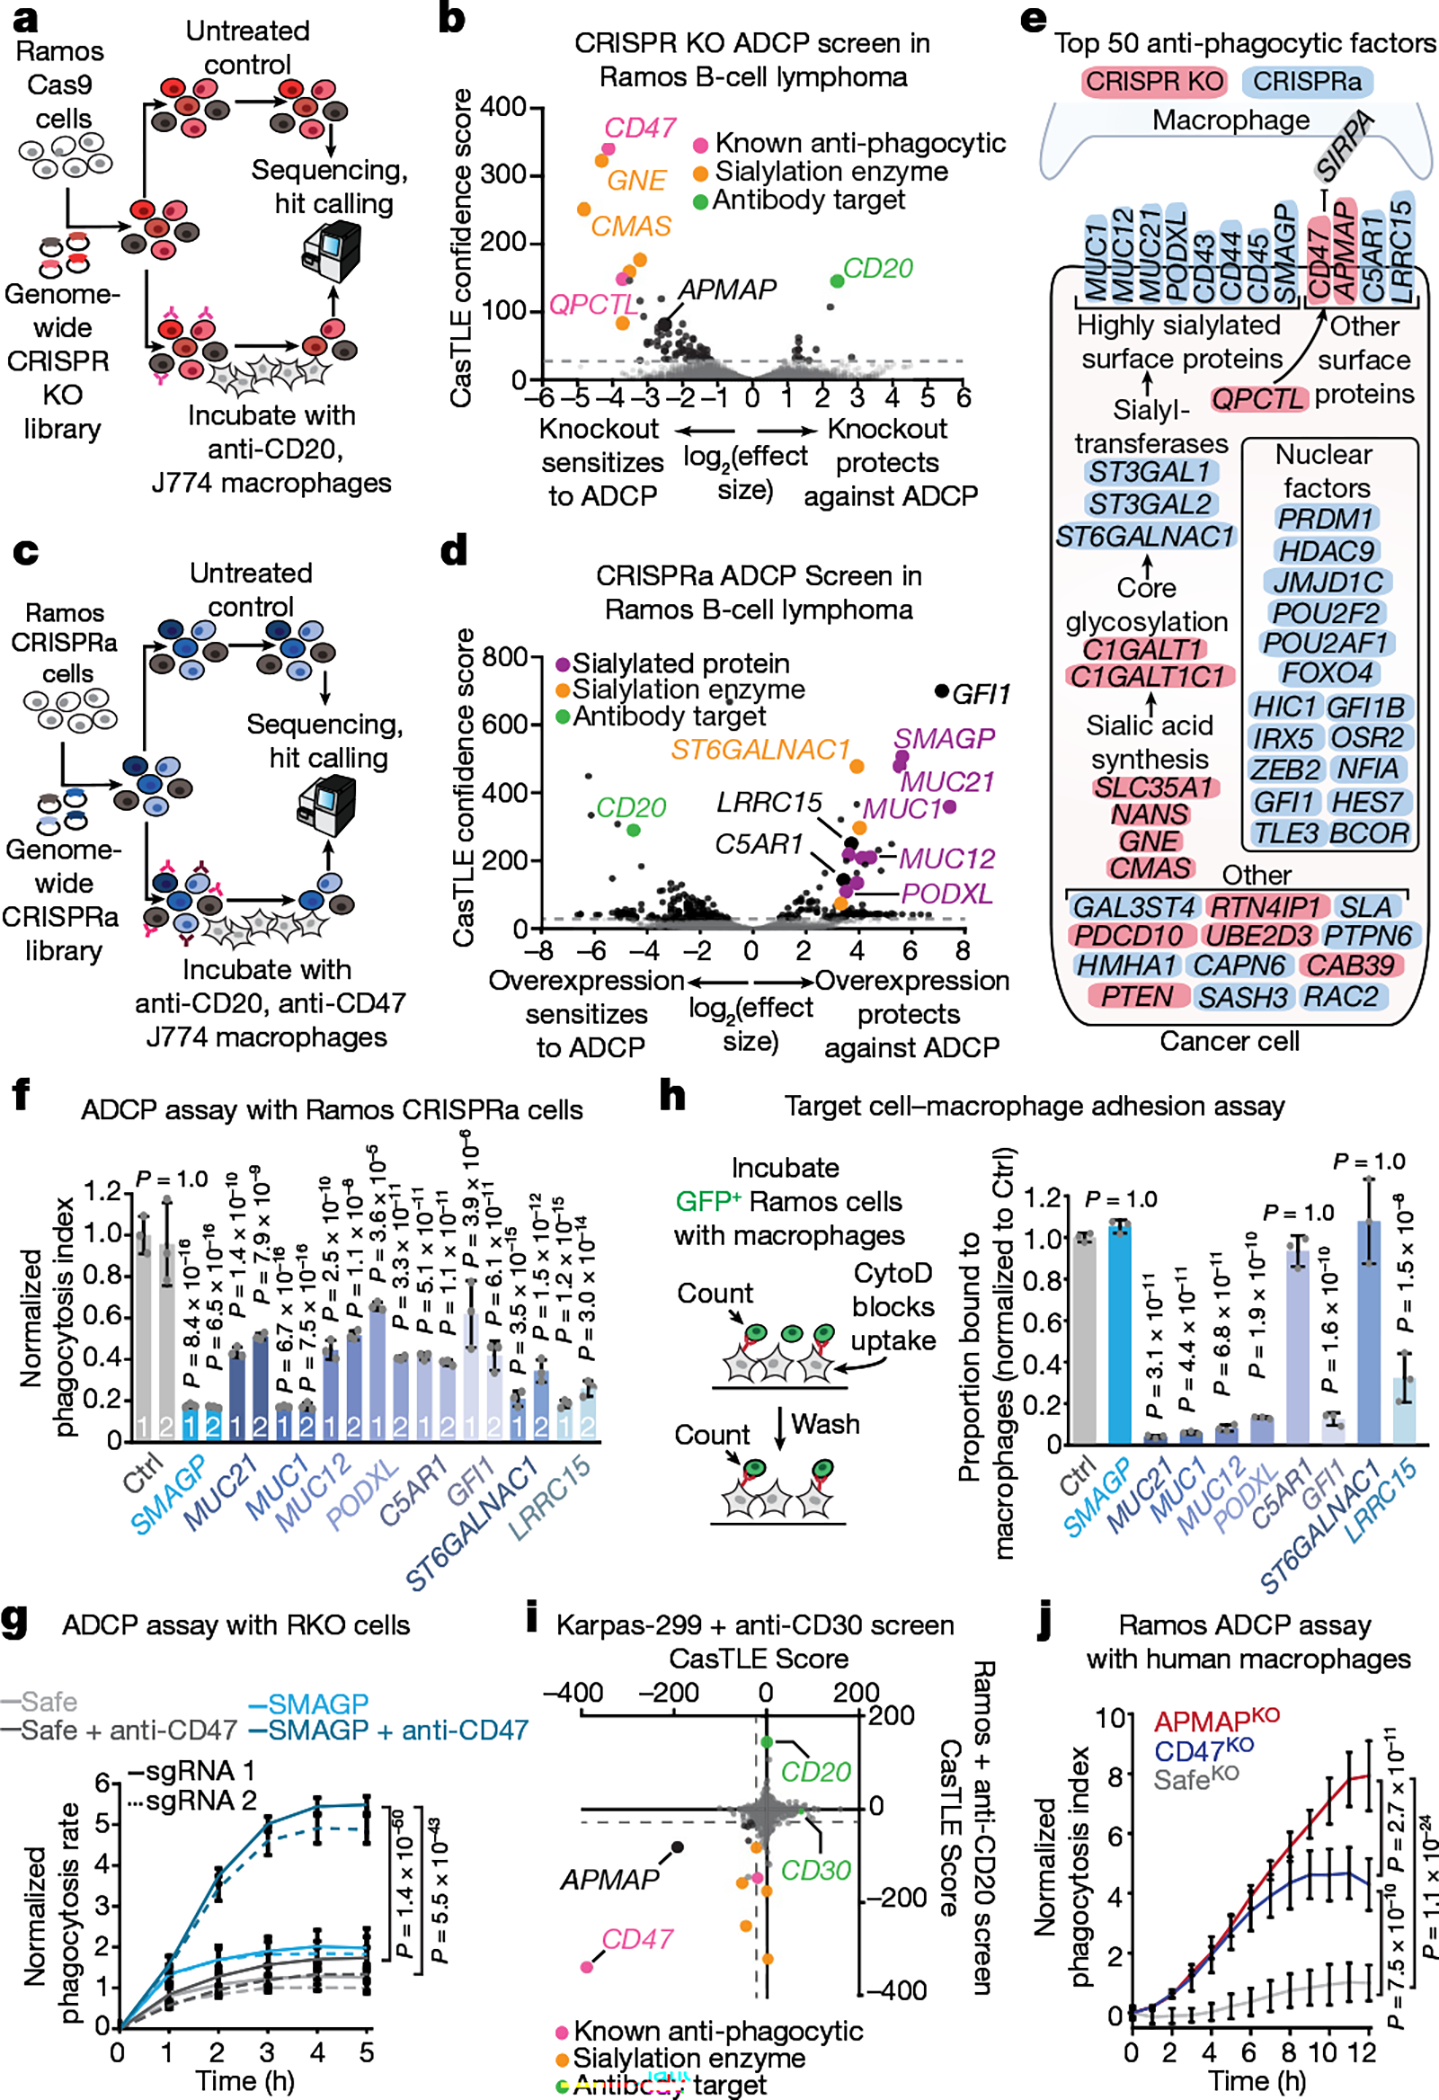
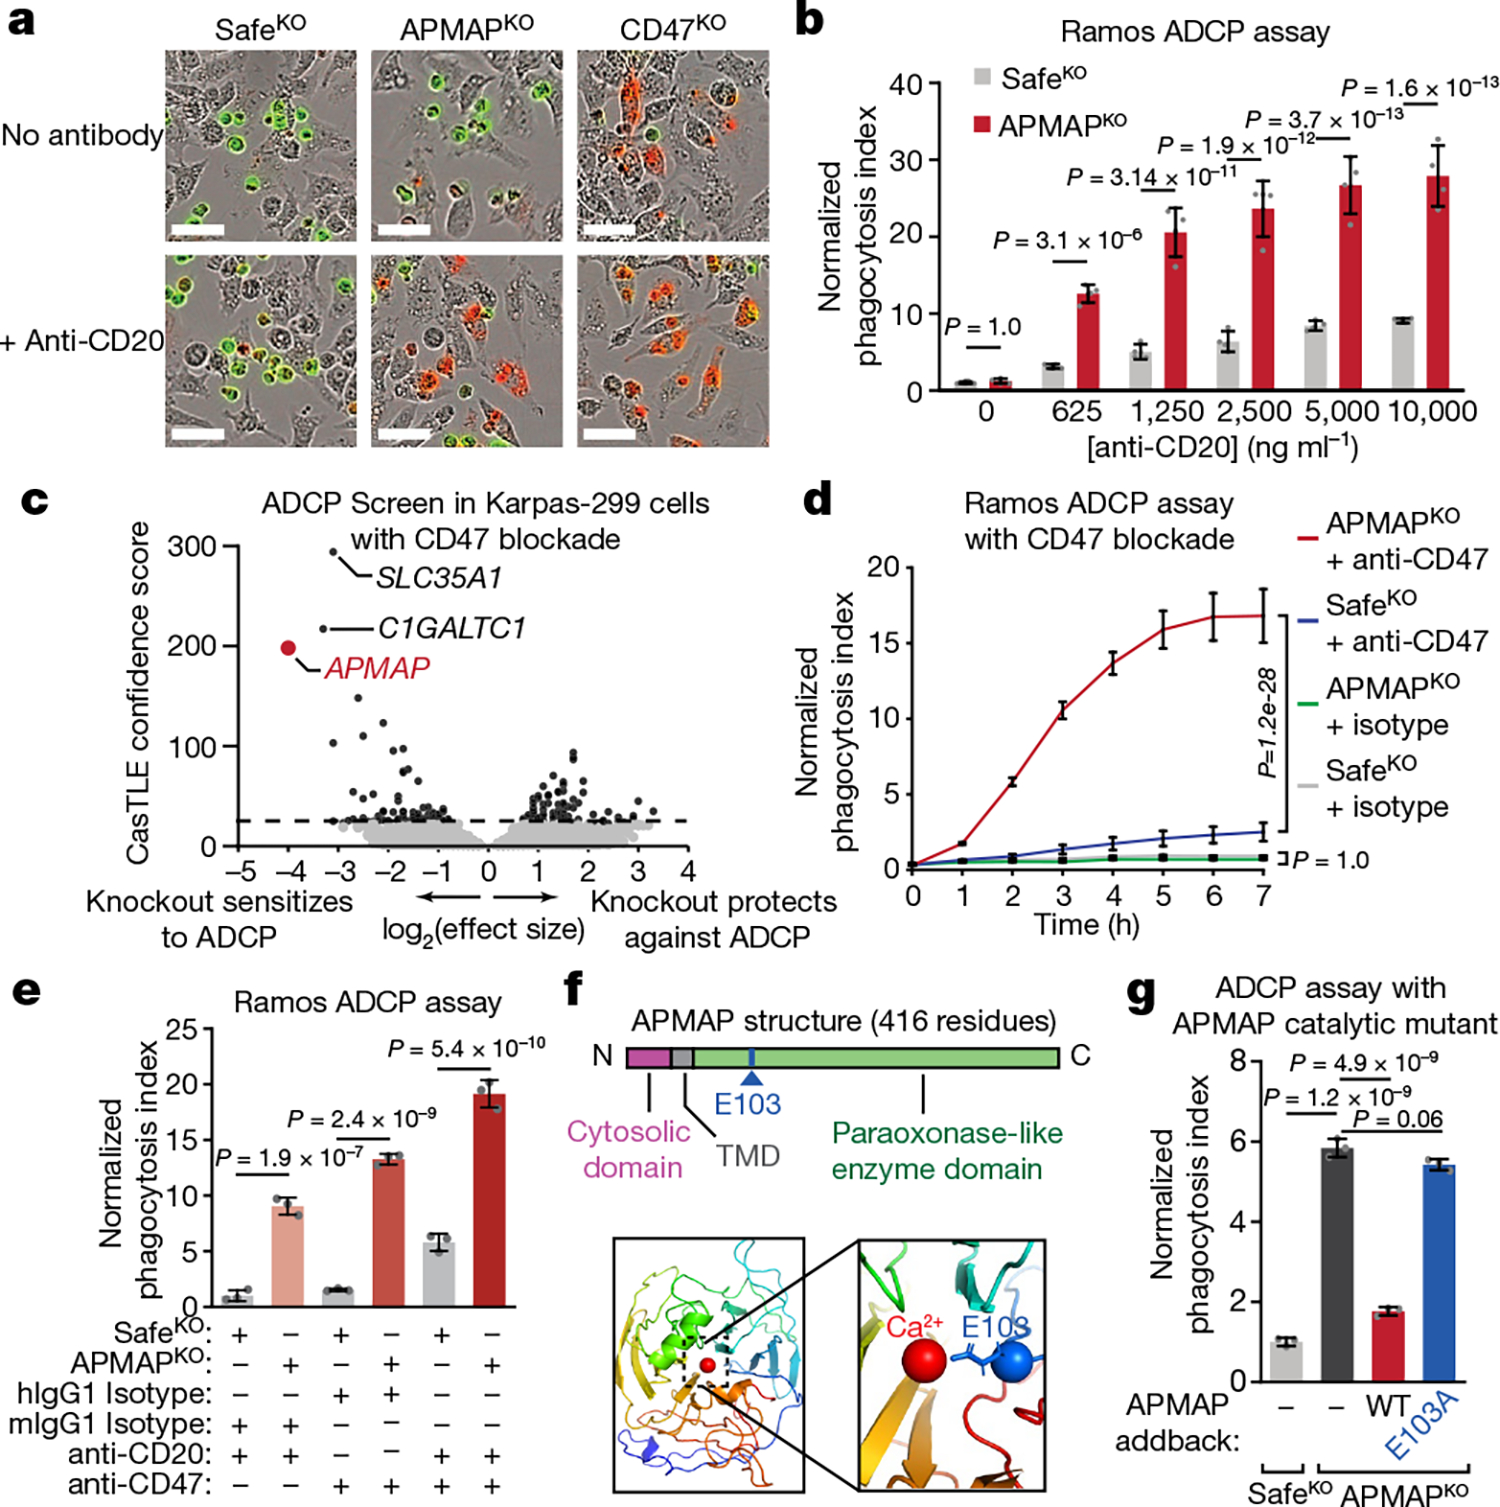
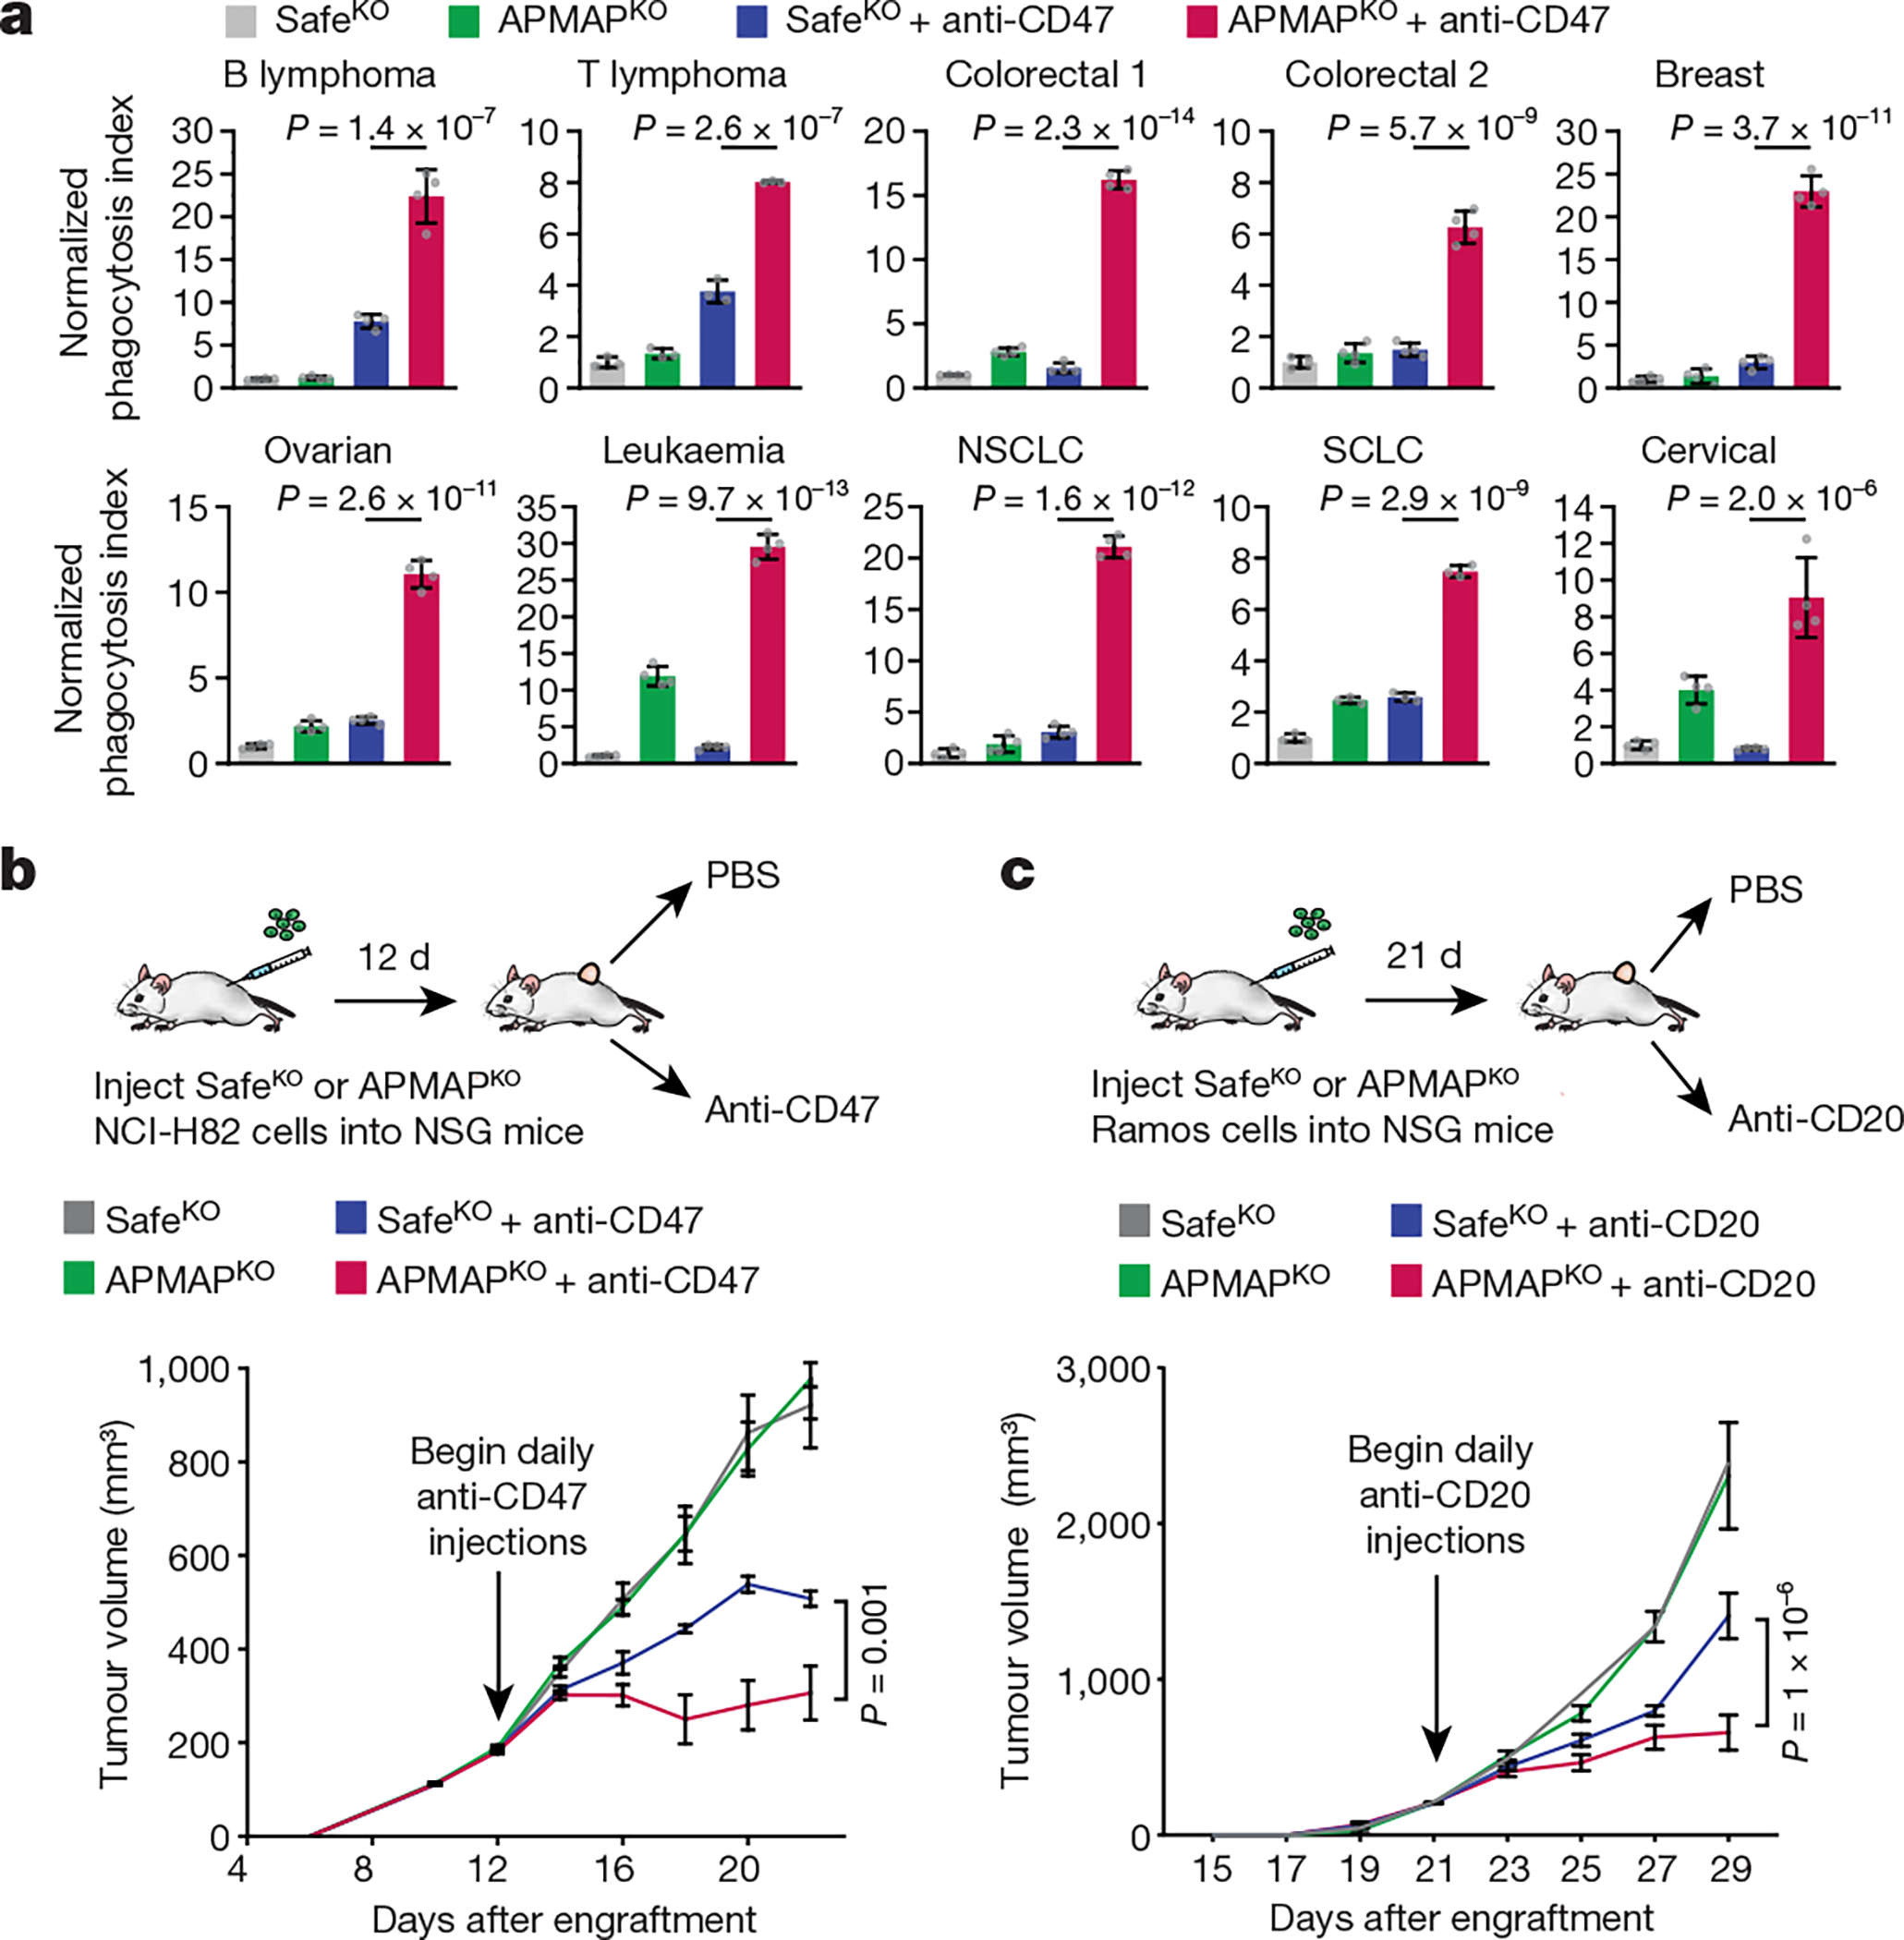
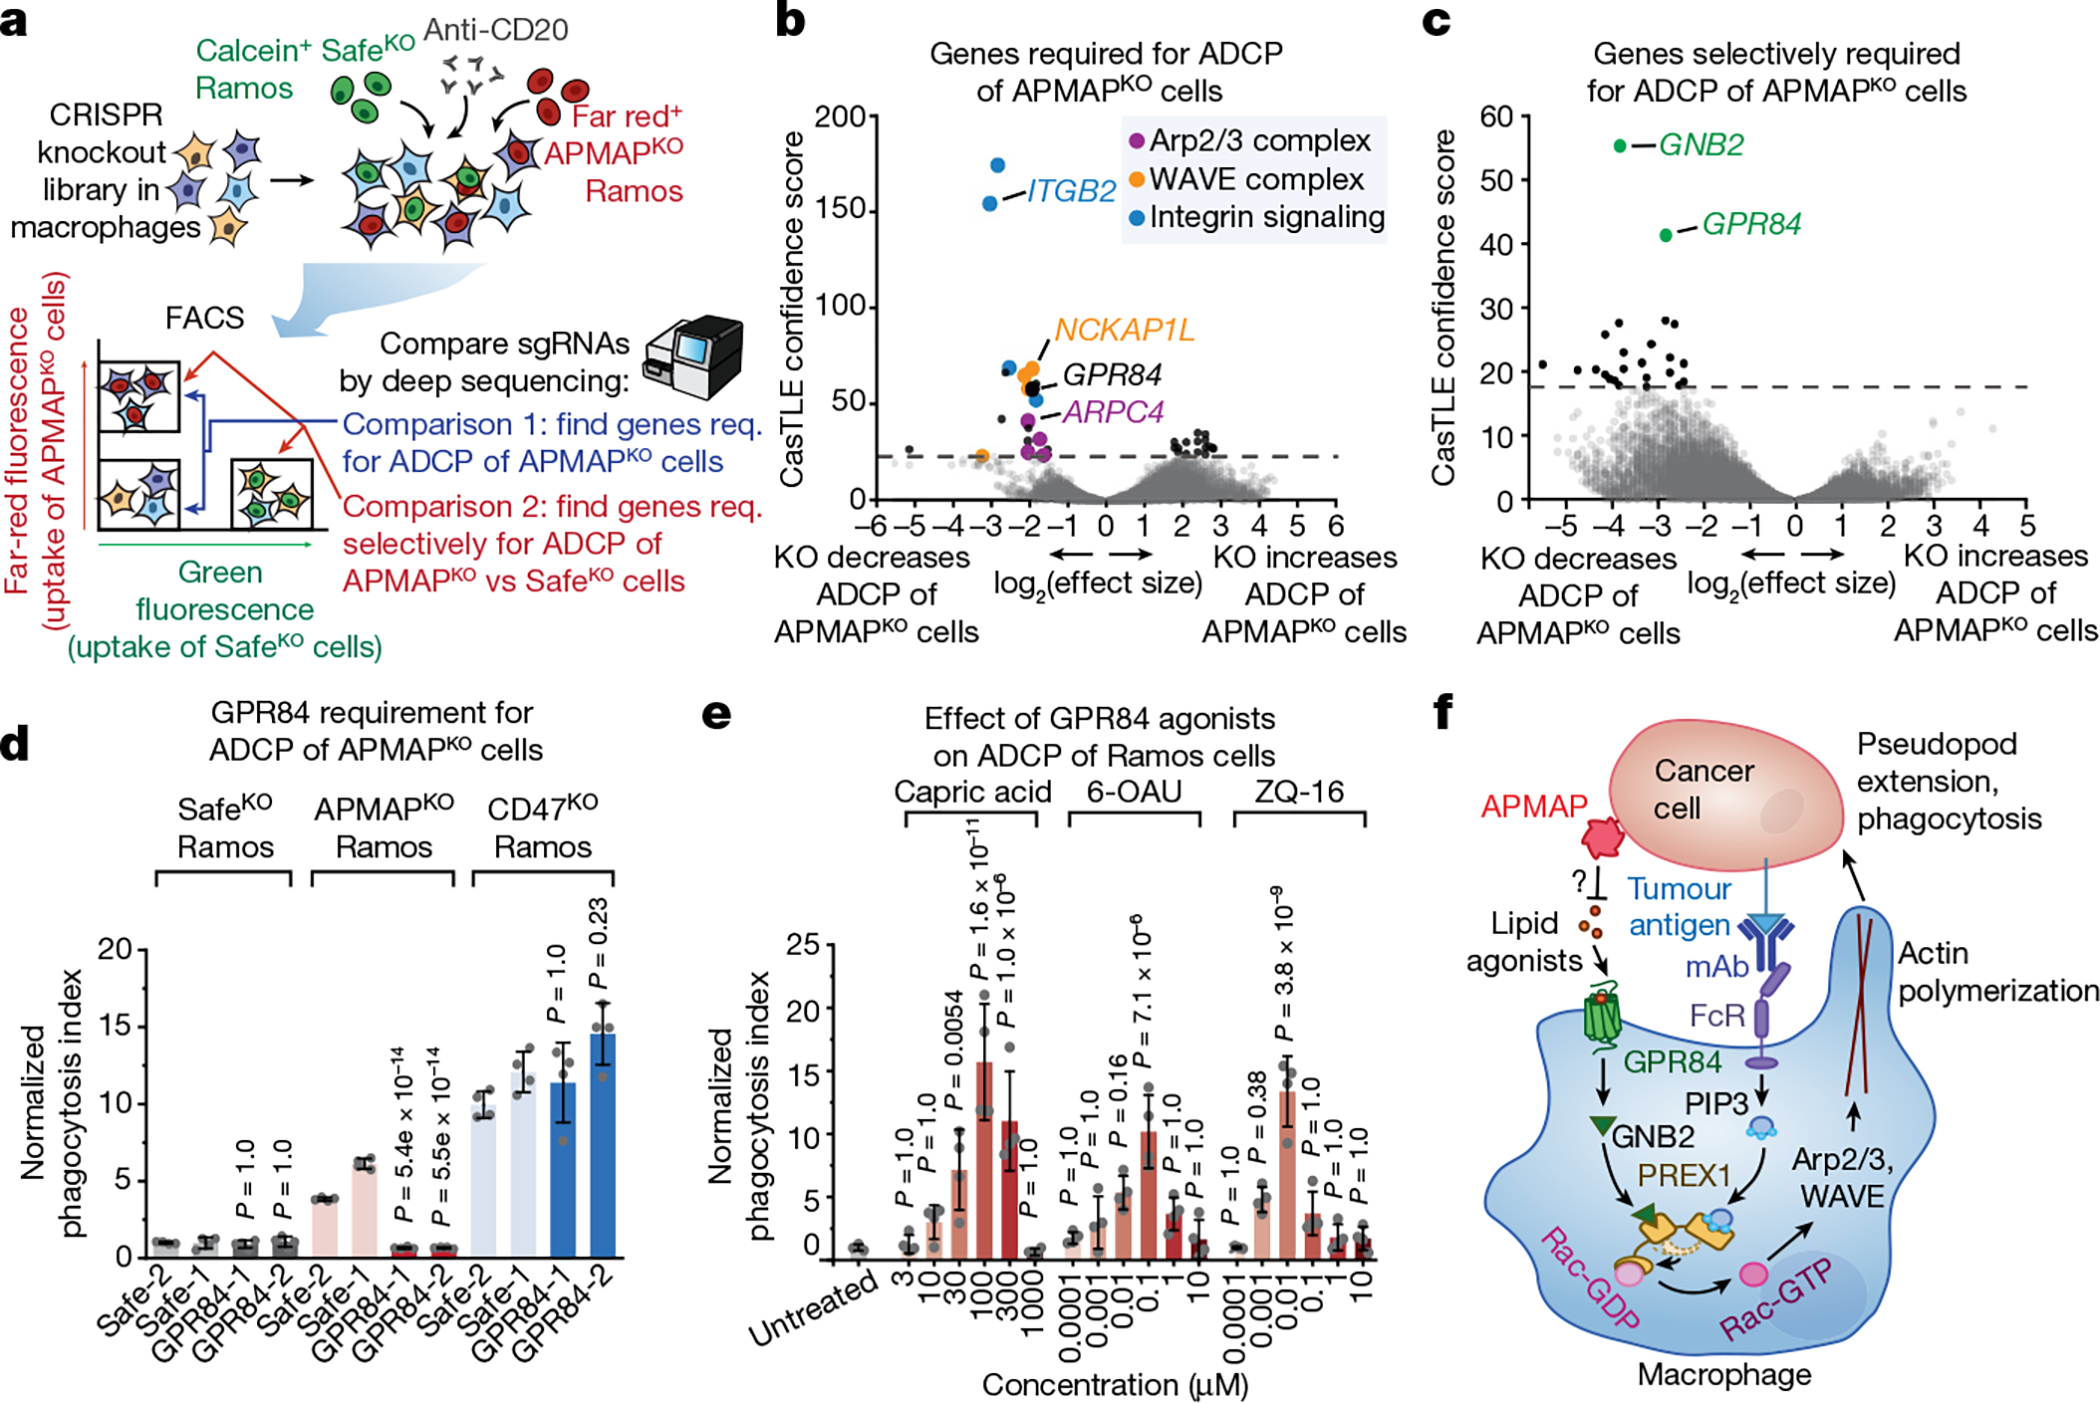
Monoclonal antibody therapies targeting tumour antigens drive cancer cell elimination in large part by triggering macrophage phagocytosis of cancer cells1-7. However, cancer cells evade phagocytosis using mechanisms that are incompletely understood. Here we develop a platform for unbiased identification of factors that impede antibody-dependent cellular phagocytosis (ADCP) using complementary genome-wide CRISPR knockout and overexpression screens in both cancer cells and macrophages. In cancer cells, beyond known factors such as CD47, we identify many regulators of susceptibility to ADCP, including the poorly characterized enzyme adipocyte plasma membrane-associated protein (APMAP). We find that loss of APMAP synergizes with tumour antigen-targeting monoclonal antibodies and/or CD47-blocking monoclonal antibodies to drive markedly increased phagocytosis across a wide range of cancer cell types, including those that are otherwise resistant to ADCP. Additionally, we show that APMAP loss synergizes with several different tumour-targeting monoclonal antibodies to inhibit tumour growth in mice. Using genome-wide counterscreens in macrophages, we find that the G-protein-coupled receptor GPR84 mediates enhanced phagocytosis of APMAP-deficient cancer cells. This work reveals a cancer-intrinsic regulator of susceptibility to antibody-driven phagocytosis and, more broadly, expands our knowledge of the mechanisms governing cancer resistance to macrophage phagocytosis.


Figures

Extended Data Fig. 1 |
Extended Data Fig. 1 |. CRISPR knockout screening platform for regulators of ADCP in cancer cells and batch retest validation screen results.
a, Phagocytosis assay for uptake of pHrodo-labelled Ramos cells by J774 macrophages in the presence or absence of anti-CD20 and/or anti-CD47 antibodies. Normalized phagocytosis index was calculated as average total pHrodo Red signal per well, normalized to signal in untreated control condition at final timepoint. Data represent mean +/− s.d. (n = 4). Two-way ANOVA with Bonferroni correction. b, Phagocytosis assay for uptake of pHrodo-labelled Ramos cells by J774 or U937 macrophages in the presence of anti-CD20. Normalized phagocytosis index was calculated as average total pHrodo Red signal per well, normalized to signal in U937 cells at final timepoint. Data represent mean +/− s.d. (n = 3). Two-way ANOVA with Bonferroni correction. c, Phagocytosis assay for uptake of pHrodo-labelled Ramos cells by J774 macrophages with or without 24 h pre-treatment with 100 ng ml-1 LPS. Normalized phagocytosis index was calculated as average total pHrodo Red signal per well, normalized to signal in untreated control condition at final timepoint. Data represent mean +/− s.d. (n = 4). Two-way ANOVA with Bonferroni correction. d, Differential expression analysis of J774 macrophages before and after treatment (24 h) with 100 ng ml-1 LPS, showing induction of classic LPS-activated M1 macrophage markers NOS2 and IL1B. e, Replicates for CRISPRko screen in Ramos cells for susceptibility to ADCP driven by anti-CD20 antibodies. f, Gene ontology enrichment analysis for negative Ramos CRISPRko ADCP hits (cutoff of CasTLE score > 50). n indicates number of genes among query gene list annotated with indicated term. g, Batch re-test screen for ADCP sensitivity in Ramos Cas9 cells. Library comprised top 250 hits (both positive and negative effect sizes) from genome-wide CRISPRko screen and top 480 anti-phagocytic hits from CRISPRa screen. Hits were defined based on 95% confidence interval of CasTLE effect size (see Supplementary Table 3). h, Replicates of Batch re-test screen in Ramos Cas9 cells. i, Comparison of Ramos batch re-test and genome-wide ADCP CRISPRko screens for genes that were hits in the CRISPRko screen. j, Survival assay for Ramos Cas9 cells subjected to treatment with macrophages and anti-CD20, expressing indicated sgRNAs (2 distinct sgRNAs per gene). GFP+ Ramos Cas9 cells expressing negative control sgRNA were mixed with an equal number of mCherry+ cells expressing indicated sgRNAs and cultured in the presence of J774 macrophages and anti-CD20 antibodies. Plotted is the mean percentage of surviving Ramos cells that were mCherry+ after 2 d, normalized to control (Ctrl) Ramos cells that expressed an empty vector) (n = 3 cell culture wells, data represent mean +/− s.d.). One-way ANOVA with Bonferroni correction.
Extended Data Fig. 2 |
Extended Data Fig. 2 |. CRISPR activation screening platform development and analysis of anti-phagocytic hits.
a, Validation of Ramos CRISPRa clones. Single-cell derived CRISPRa clones were constructed as described in the Methods and transduced with sgRNAs targeting CD2 (using a lentiviral vector co-expressing GFP). Indicated clones and parent Ramos cells were stained with anti-CD2-APC antibodies. Mean APC signal in the GFP+ population is plotted (n = 2 technical replicates, mean is shown). Clone #6 was used for screening. b, Replicates for CRISPRa screen in Ramos cells for susceptibility to ADCP driven by anti-CD20 and anti-CD47 antibodies. c, Gene ontology enrichment analysis for positive Ramos CRISPRa ADCP hits (cutoff of CasTLE score > 50) (top) and top 50 anti-phagocytic factors (bottom). n indicates number of genes among query gene list annotated with that term. d, Schematic of time-lapse imaging assay for ADCP. pHrodo-Red fluorescence intensity increases in low-pH conditions, such as in the lysosome following internalization of the target cell. e, Phagocytosis assay for uptake of pHrodo-labelled Ramos cells, stably expressing indicated constructs, by J774 macrophages in the presence of anti-CD20 and anti-CD47 antibodies. Normalized phagocytosis index was calculated as average total pHrodo Red signal per well, normalized to signal in GFP-FLAG cells at final timepoint. Data represent mean +/− s.d. (n = 4 cell culture wells). Two-way ANOVA with Bonferroni correction. f, Expression (TPM) of SMAGP in 1304 cell lines in CCLE. g, h, Flow cytometry assays for anti-CD20 and anti-CD45 binding to Ramos CRISPRa cells expressing indicated sgRNAs. Data represent mean +/− s.d. (n = 3 independently stained samples). One-way ANOVA with Bonferroni correction. i, Volcano plot of screen in Karpas-299 cells conducted in presence of anti-CD30 antibodies. Dotted line indicates 5% FDR. j, Heatmap of differential expression for 12 selected anti-phagocytic genes in 23 tumour types compared to normal tissue. Tumour type abbreviations are listed here: https://gdc.cancer.gov/resources-tcga-users/tcga-code-tables/tcga-study-abbreviations. k, Minimum expression (TPM) across all cell lines in CCLE is plotted against maximum probability of essentiality in all cell lines profiled in DepMap for 50 top anti-phagocytic hits shown in Fig. 1e.
Extended Data Fig. 3 |
Extended Data Fig. 3 |. Screens for cancer cell regulators of ADCP in the presence or absence of CD47 and evaluation of importance of antibodies and Fc receptor for APMAP effect.
a, Schematic and volcano plot of CRISPR screen in Ramos Cas9 cells for sensitivity to macrophage phagocytosis in the presence of anti-CD20 in cells expressing an sgRNA targeting a Safe locus. Dotted line indicates 5% FDR. A transmembrane gene-enriched sublibrary containing 3,124 genes was used. b, Schematic and volcano plot of CRISPR screen in Ramos Cas9 cells for sensitivity to macrophage phagocytosis in the presence of anti-CD20 in cells expressing an sgRNA targeting the CD47 locus. Dotted line indicates 5% FDR. A transmembrane gene-enriched sublibrary containing 3,124 genes was used. c, Schematic and volcano plot of CRISPRko screen in Ramos Cas9 cells for sensitivity to macrophage phagocytosis in the presence of anti-CD20 and anti-CD47 in cells expressing an sgRNA targeting a Safe locus. Dotted line indicates 5% FDR. A transmembrane gene-enriched sublibrary containing 3,124 genes was used. d, Phagocytosis assay for uptake of pHrodo-labelled Ramos cells with indicated genotypes by human primary peripheral blood-derived macrophages, from two independent healthy de-identified human donors, in the presence or absence of anti-CD47 antibodies. Phagocytosis index normalized to control (SafeKO) cells without anti-CD47. Data represent mean +/− s.d. (n = 4 cell culture wells). One-way ANOVA with Bonferroni correction. e, Phagocytosis assay for uptake of pHrodo-labelled Ramos cells with indicated genotypes by J774 macrophages in the presence of anti-CD20 or anti-CD47 antibodies. Where indicated, J774 macrophages were pre-incubated with Fc-blocking antibodies for 45 min on ice. Phagocytosis index normalized to control (SafeKO) cells without antibody analysed in parallel (condition not shown). Data represent mean +/− s.d. (n = 3 cell culture wells). Two-way ANOVA with Bonferroni correction. f, Phagocytosis assay for uptake of pHrodo-labelled Ramos cells with indicated genotypes by J774 macrophages in the absence of antibodies. Phagocytosis index normalized to control (SafeKO/SafeKO) cells. Data represent mean +/− s.d. (n = 3 cell culture wells). One-way ANOVA with Bonferroni correction.
Extended Data Fig. 4 |
Extended Data Fig. 4 |. APMAP loss sensitizes cells to ADCP in a highly specific manner and without affecting surface levels of other pro- and anti-phagocytic factors.
a, Phagocytosis assay for uptake of pHrodo-labelled Karpas-299 Cas9 cells expressing indicated sgRNAs by J774 macrophages in the presence or absence of anti-CD30 antibodies. Normalized phagocytosis index was calculated as average total pHrodo Red signal per well, normalized to signal in untreated control condition at final timepoint. Data represent mean +/− s.d. (n = 4 cell culture wells). Two-way ANOVA with Bonferroni correction. b, Phagocytosis assay for uptake of pHrodo-labelled Ramos cells with indicated genotypes by human U937 macrophages in the presence or absence of anti-CD20 (rituximab) antibodies at indicated concentrations. Phagocytosis index normalized to control (SafeKO) Ramos cells without anti-CD20. Data represent mean +/− s.d. (n = 4 cell culture wells). Two-way ANOVA with Bonferroni correction. c, Phagocytosis assay for uptake of pHrodo-labelled Ramos cells with indicated genotypes by human primary peripheral blood-derived macrophages, from two independent healthy de-identified human donors, in the presence or absence of 10 ng ml−1 anti-CD20 antibodies. Phagocytosis index normalized to control (SafeKO) Ramos cells without anti-CD20. Data represent mean +/− s.d. (n = 3 cell culture wells). One-way ANOVA with Bonferroni correction. d, Phagocytosis assay for uptake of pHrodo-labelled Ramos Cas9 cells expressing indicated sgRNAs by J774 macrophages with or without 24 h pre-treatment with 100 ng ml-1 LPS. Normalized phagocytosis index was calculated as average total pHrodo Red signal per well, normalized to signal in untreated control condition at final timepoint. Data represent mean +/− s.d. (n = 4 cell culture wells). e, Ramos Cas9 cells expressing indicated sgRNAs were incubated with Annexin V-FITC or anti-Calreticulin-DyLight-488 and analysed by flow cytometry. CRT, calreticulin. Data represent mean +/− s.d. (n = 3 independently stained samples). P-values were from two-tailed t-tests. f, Flow-cytometry based measurement of cell surface levels of CD20 in Ramos Cas9 cells expressing indicated sgRNAs. Data represent mean (n = 2 independently stained samples, except cells expressing CD20 sgRNA (n = 1)). g, Flow-cytometry based measurement of cell surface levels of CD47 in Ramos Cas9 cells expressing indicated sgRNAs. Data represent mean +/− s.d. (n = 3 independently stained samples). h, Flow-cytometry based measurement of cell surface levels of sialic acid in Ramos Cas9 cells expressing indicated sgRNAs. Where indicated, cells were treated with sialidase as a positive control. Data represent mean +/− s.d. (n = 3 independently stained samples). i, Viability assays (measured as cell confluence after 72 h on Incucyte, normalized to untreated SafeKO control cells) of indicated Ramos cells in the presence of indicated concentrations of 9 drugs. Data represent mean +/− s.d. (n = 3 cell culture wells). j, Flow-cytometry based measurement of forward scatter (FSC) and side scatter (SSC) in Ramos Cas9 cells expressing indicated sgRNAs. Data represent mean +/− s.d. (n = 3 independently analysed samples). k, Ramos-J774 adhesion assay in the presence of indicated antibody concentrations, using indicated GFP+ Ramos Cas9 knockout cells. Data represent mean +/− s.d. (n = 2 cell culture wells). l, Flow-cytometry based measurement of ADCP of Ramos Cas9 cells expressing indicated sgRNAs and stained with either calcein or CellTrace-Far-Red dye before incubation with J774 macrophages and anti-CD20 for 24h. Data represent mean +/− s.d. (n = 3 cell culture wells). Two-tailed t-tests were used to compare SafeKO and APMAPKO cells within each labeling condition.
Extended Data Fig. 5 |
Extended Data Fig. 5 |. APMAP localizes to the endoplasmic reticulum and its cytosolic domain, transmembrane domain, and N-glycosylation are not required for its function in ADCP.
a, Localization of APMAP-FLAG and APMAPE103A-FLAG to the endoplasmic reticulum in HeLa cells. Scale bar, 20 μm. Calnexin is used as a marker of the endoplasmic reticulum. FLAG staining was representative of two independent experiments. b, Immunoblotting of cell extracts derived from Ramos cells of indicated genotypes expressing indicated APMAP-FLAG constructs. GAPDH served as loading control. Experiment was performed twice. c, d, Phagocytosis assay for uptake of pHrodo-labelled Ramos-Cas9 cells with indicated genotypes by J774 macrophages in the presence of anti-CD20 antibodies. APMAP-F, APMAP-FLAG. TFRCRR, mutant allele of TFRC that localizes primarily to the endoplasmic reticulum. Phagocytosis index normalized to control (SafeKO) cells. Data represent mean +/− s.d. (n = 4 cell culture wells). One-way ANOVA with Bonferroni correction. e, Immunoblotting of cell extracts that were treated, where indicated, with PNGase F to remove N-glycosylation. Actin served as loading control. Experiment was performed once. f, Phagocytosis assay for uptake of pHrodo-labelled Ramos Cas9 cells expressing indicated sgRNAs and indicated addback constructs by J774 macrophages in the presence of anti-CD20 antibodies. Normalized phagocytosis index was calculated as average total pHrodo Red signal at 5 h for each well, normalized to signal in SafeKO cells at 5 h timepoint. Data represent mean +/− s.d. (n = 3 cell culture wells). One-way ANOVA with Bonferroni correction. For gel source data, see Supplementary Figure 1.
Extended Data Fig. 6 |
Extended Data Fig. 6 |. Evaluation of APMAP role in ADCP across diverse cancer cell lines and in syngeneic mice.
a, Levels of APMAP in ten cell lines measured by Western blot. All cell lines stably express Cas9 and were transduced with indicated sgRNAs. Actin served as loading control. Western blot to confirm knockout across all ten cell lines on one gel was performed once. For gel source data, see Supplementary Figure 1. b, Expression levels (TPM) of CD47 and APMAP in ten cell lines (data from CCLE). c, Survival measurements of selected (GFP+) cell lines in Fig. 3a, measured as percentage of GFP remaining after indicated number of hours of incubation with J774 macrophages in presence or absence of anti-CD47. Data represent mean +/− s.d. (n = 4 cell culture wells, except Karpas-299 (n = 3)). One-way ANOVA with multiple comparisons correction. d, Phagocytosis assays as in Fig. 3a, but with isotype control antibodies. Data represent mean +/− s.d. (n = 4 cell culture wells). One-way ANOVA with Bonferroni correction. e, Phagocytosis assay for uptake of pHrodo-labelled cells for indicated Cas9-expressing cell lines expressing indicated sgRNAs by J774 macrophages in the presence or absence of anti-EGFR/cetuximab antibodies. Phagocytosis index normalized to control (SafeKO) cells without anti-EGFR. Data represent mean +/− s.d. (n = 3 cell culture wells). One-way ANOVA with Bonferroni correction. f, Survival measurements of selected (GFP+) cell lines in Extended Data Fig. 6e, measured as percentage of GFP remaining after indicated number of hours of incubation with J774 macrophages in presence or absence of anti-EGFR. Data represent mean +/− s.d. (n = 3 cell culture wells). One-way ANOVA with Bonferroni correction. g, Representative photographs depicting Ramos tumours of indicated genotype extracted from NSG mice at 25 d following transplantation. h, SafeKO or APMAPKO Ramos cells were transplanted into NSG mice and allowed to form tumours. Mice were treated with anti-CD47 (B6H12, BioXCell) or PBS daily starting 17 d following transplantation, and tumour size was measured every 2 d. Data represent mean +/− s.e.m. (n = 5 (SafeKO groups) and 6 (APMAPKO groups)). Two-way ANOVA with Tukey correction (comparison between SafeKO/anti-CD47 and APMAPKO/anti-CD47 for final timepoint is shown). I, Mouse weights in Ramos (top) and NCI-H82 (bottom) xenograft experiments (Extended Data Fig. 6h, Fig. 3b). Data represent mean +/− s.d. Two-way ANOVA with Bonferroni correction (n = 5 (all NCI-H82 groups and Ramos SafeKO groups) and 6 (Ramos APMAPKO groups)). P-values are reported for the interaction between treatment groups. j, Single-cell suspensions were prepared from SafeKO or APMAPKO Ramos tumours treated with PBS or anti-CD20 (from experiment in Fig. 3c) and analysed for the presence of macrophages (CD45+/F4–80+/Cd11b+) as a percentage of all CD45+ cells. Gating strategy is shown (top/left). Data (bottom right) represent mean +/− s.e.m. (n = 6 (PBS groups) and 7 (antibody-treated groups)). One-way ANOVA with Tukey correction. k, Phagocytosis assay for uptake of pHrodo-labelled B16-F10 cells with indicated genotypes by J774 macrophages in the presence or absence of anti-TRP1 antibodies. Phagocytosis index normalized to control (SafeKO) cells without antibody. Data represent mean +/− s.d. (n = 4 cell culture wells). One-way ANOVA with Bonferroni correction. l, In vitro growth of B16-F10 cells of indicated genotypes, measured using time-lapse microscopy as total confluence per well over 6 d. Data represent mean +/− s.d. (n = 4 cell culture wells). m, SafeKO or APMAPKO B16-F10 cells were transplanted into syngeneic C57BL/6 mice and allowed to form tumours. Mice were treated with anti-TRP1 or mouse IgG2a isotype control antibody daily starting 5 d following transplantation, and tumour size was measured every 2 d. Data represent mean +/− s.e.m. (n = 7 for SafeKO groups, n = 6 for both APMAPKO groups). Two-way ANOVA with Tukey correction (comparison between SafeKO/anti-TRP1 and APMAPKO/anti-TRP1 for final timepoint is shown).
Extended Data Fig. 7 |
Extended Data Fig. 7 |. Genome-wide magnetic screen in J774 macrophages for phagocytosis of IgG-coated beads.
a, Schematic of genome-wide screen in J774 macrophages for phagocytosis of 2.8 micron IgG-coated magnetic beads. b, Volcano plot of screen diagrammed in a. Dotted line indicates 5% FDR. c. Replicates of screen diagrammed in a. d, Diagram of hits with negative effect size (i.e. required for phagocytosis) from genome-wide screen for IgG bead phagocytosis in J774 macrophages. e, Gene ontology enrichment analysis for macrophage IgG bead screen hits with negative effect size (required for phagocytosis) (5% FDR). Selected terms shown. n indicates number of genes among hits annotated with indicated term.
Extended Data Fig. 8 |
Extended Data Fig. 8 |. GPR84 is expressed in tumour associated macrophages.
ad, Single-cell RNA-seq analyses of human tumours from patients with melanoma, (a, b), patients with glioblastoma (c) and patients with sarcoma (d), showing cell type annotations (left) and detection of GPR84 (right). GPR84+ and GPR84− denote TPM > 0 and = 0, respectively; n denotes the number of cells shown.
Extended Data Fig. 9 |
Extended Data Fig. 9 |. Macrophage screens for genes required for enhanced uptake of APMAPKO cancer cells.
a, Phagocytosis assay for uptake of pHrodo-labelled Karpas-299-Cas9 cells expressing indicated sgRNAs, incubated with J774 macrophages expressing indicated sgRNAs, in the presence of anti-CD30 antibodies. Phagocytosis index (arbitrary units) corresponds to the total pHrodo Red signal per well, normalized to SafeKO Karpas-299 cells fed to SafeKO macrophages. Data represent mean +/− s.d. (n = 4 cell culture wells). Two-way ANOVA with Bonferroni correction. b, Phagocytosis assay for uptake of pHrodo-labelled Ramos cells expressing indicated sgRNAs, incubated with U937 macrophages expressing indicated sgRNAs (three independent sgRNAs per gene), in the presence of anti-CD20 antibodies. Phagocytosis index (arbitrary units) corresponds to the total pHrodo Red signal per well, normalized to SafeKO Ramos cells fed to SafeKO−1 macrophages. Data represent mean +/− s.d. (n = 4 cell culture wells). Two-way ANOVA with Bonferroni correction, P values for comparisons to SafeKO Ramos/SafeKO−1 U937 macrophages shown. c, Gating strategy for collecting single-positive and double-negative macrophage populations, corresponding to macrophages that phagocytosed calcein+ SafeKO or Far-red+ APMAPKO cells. d, Volcano plot for macrophage screen for genes required for uptake of SafeKO Ramos cells, using 2,208-gene sublibrary (enriched for phagocytosis genes, but lacking GPR84), conducted in J774 macrophages. Dotted line indicates 5% FDR. e, Volcano plot for macrophage screen for genes required for uptake of APMAPKO Ramos cells, using 2,208-gene sublibrary (enriched for phagocytosis genes, but lacking GPR84) in J774 macrophages. Dotted line indicates 5% FDR. f, Volcano plot for macrophage screen for genes required selectively for uptake of APMAPKO cells, following screen design in Fig. 4a (comparison 2), but using 2,208-gene sublibrary (enriched for phagocytosis genes, but lacking GPR84) in J774 macrophages, for uptake of calcein+ SafeKO cells and far-red+ APMAPKO Ramos cells. Dotted line indicates 5% FDR. g, Phagocytosis assay for uptake of pHrodo-labelled Ramos cells expressing indicated sgRNAs, incubated with J774 macrophages expressing indicated sgRNAs, in the presence of anti-CD20 antibodies. Phagocytosis index (arbitrary units) corresponds to the total pHrodo Red signal per well, normalized to SafeKO Ramos cells fed to SafeKO macrophages. Data represent mean +/− s.d. (n = 3 cell culture wells). Two-way ANOVA with Bonferroni correction. P-values correspond to comparisons to SafeKO-1. h, FACS-based phagocytosis assay for uptake of CellTrace Far-Red-labelled APMAPKO cells and calcein-labelled CD47KO Ramos cells by J774-Cas9 macrophages expressing indicated sgRNAs. Ratio of macrophages that phagocytosed APMAPKO Ramos cells to macrophages that phagocytosed CD47KO Ramos cells, normalized to SafeKO/SafeKO J774 macrophages, following 24 h co-incubation with anti-CD20 antibodies is plotted. Data represent mean +/− s.d. (n = 3 cell culture wells). One-way ANOVA with Bonferroni correction, P-values for comparisons to SafeKO/SafeKO J774 macrophages shown.
Extended Data Fig. 10 |
Extended Data Fig. 10 |. GPR84 agonists stimulate uptake of antibody-opsonized cancer cells.
a, Phagocytosis assay for uptake of pHrodo-labelled Ramos Cas9 cells expressing Safe-targeting sgRNAs by J774 macrophages in the presence of anti-CD20 antibodies and indicated concentrations of GPR84 agonists. Data represent mean (n = 2 cell culture wells). b, Phagocytosis assay for uptake of pHrodo-labelled Ramos Cas9 cells expressing APMAP-targeting sgRNAs by J774 macrophages in the presence of anti-CD20 antibodies and indicated concentrations of GPR84 agonists. Data represent mean (n = 2 cell culture wells). c, Phagocytosis assay for uptake of pHrodo-labelled SafeKO Ramos Cas9 cells by J774 macrophages in the presence (left) or absence (right) of anti-CD20 antibodies and 100 μM saturated fatty acids of indicated carbon chain length (n = 2, acetic acid; n = 10, capric acid; n = 16, palmitic acid; n = 22, docosanoic acid). Data represent mean +/− s.d. (n = 4 cell culture wells). One-way ANOVA with Bonferroni correction. d, Heatmap of normalized phagocytosis index of Ramos cells incubated with U937 macrophages expressing indicated sgRNAs, in the presence of indicated concentrations of 6-OAU and anti-CD20. Data represent mean (n = 4 cell culture wells). e, Heatmap of normalized phagocytosis index of Ramos cells incubated with J774 macrophages expressing indicated sgRNAs, in the presence of indicated concentrations of 6-OAU and anti-CD47. Data represent mean (n = 4 cell culture wells). f, Phagocytosis assay for uptake of pHrodo-labelled Ramos Cas9 cells expressing Safe-targeting sgRNAs by J774 macrophages in the presence of anti-CD20 antibodies and GPR84 agonists (100 μM capric acid, 100 nM 6-OAU, 10 nM ZQ-16). Data represent mean +/− s.d. (n = 3 cell culture wells). One-way ANOVA with Bonferroni correction. P-values are for comparison to untreated condition for each macrophage genotype.
Fig. 1 |
Fig. 1 |. Genome-wide CRISPR screens reveal novel regulators of ADCP.
a, Schematic of the genome-wide CRISPR knockout (KO) screening strategy. b, Volcano plot of genome-wide screen in Ramos cells depicted in a. c, Schematic of the genome-wide CRISPR activation screening strategy. d, Volcano plot of genome-wide CRISPRa screen in Ramos cells depicted in c. e, Diagram of top 50 anti-phagocytic hits from CRISPR knockout (pink) and CRISPRa (blue) screens in Ramos cells. SIRPA, the macrophage receptor for CD47, is depicted in grey. f, Phagocytosis assay for uptake of pHrodo-Red-labelled Ramos CRISPRa cells expressing the indicated sgRNAs by J774 macrophages in the presence of anti-CD20 and anti-CD47 antibodies. The phagocytosis index was calculated as the total pHrodo Red signal (which increases in the low-pH environment of the lysosome) per well, normalized to signal in cells expressing a Safe-targeting control sgRNA (5 h timepoint) (n = 3 cell culture wells). Ctrl, control. g, Phagocytosis assay for uptake of pHrodo-labelled RKO Cas9 cells expressing indicated sgRNAs by J774 macrophages in the presence or absence of anti-CD47 antibodies, normalized to signal in control (SafeKO) cells at the 5 h timepoint (n = 4 cell culture wells). h, Left, schematic of target cell–macrophage adhesion assay. See Methods for details. The proportion of Ramos cells expressing indicated sgRNAs bound to macrophages is plotted, normalized to Ramos cells expressing Safe-targeting control sgRNA (n = 3 cell culture wells). CytoD, cytochalasin D. i, Comparison of Ramos–anti-CD20 and Karpas-299–anti-CD30 ADCP screens. j, Phagocytosis assay for uptake of pHrodo-labelled Ramos cells with indicated genotypes by human U937 macrophages in the presence of anti-CD20 antibodies, normalized to control (SafeKO) cells expressing an sgRNA targeting a non-functional genomic locus (n = 3 cell culture wells). In b, d, i, dotted lines indicate 5% false discovery rate (FDR). In fh, j, data are mean ± s.d. One-way analysis of variance (ANOVA) (f, h) or two-way ANOVA (g, j) with Bonferroni correction.
Fig. 2 |
Fig. 2 |. APMAP loss synergizes with monoclonal antibodies and CD47 blockade to increase cancer cell susceptibility to phagocytosis.
a, Images of pHrodo-labelled GFP+ Ramos cells of indicated genotypes after 12 h incubation with J774 macrophages with or without anti-CD20. Scale bars, 50 μm. Representative of three biologically independent experiments. b, Phagocytosis assay for uptake of pHrodo-labelled Ramos cells with indicated genotypes by J774 macrophages with indicated concentrations of anti-CD20, normalized to control (SafeKO) cells in absence of anti-CD20 (n = 4 replicate wells). c, Volcano plot of genome-wide CRISPR knockout screen in Karpas299-Cas9 cells for resistance to treatment with anti-CD47 and macrophages. Dotted line indicates 5% FDR. d, Phagocytosis assay for uptake of pHrodo-labelled Ramos cells with indicated genotypes following incubation with J774 macrophages and anti-CD47 antibodies or mouse isotype control (mIgG1) antibodies, normalized to control (SafeKO) cells with isotype control antibody (n = 3 cell culture wells). e, Phagocytosis assay for uptake of pHrodo-labelled Ramos cells expressing indicated sgRNAs, incubated for 2 h with J774 macrophages and anti-CD20, anti-CD47, or human (hIgG1) or mouse (mIgG1) isotype control antibodies, normalized to signal in control (SafeKO) cells in anti-CD20 or mIgG1-isotype condition (n = 3 cell culture wells). f, Top, schematic of APMAP structure. Bottom left, APMAP homology model (residues 61–407) (Methods). Bottom right, magnified view of catalytic site of APMAP homology model, showing predicted positioning of residue E103 near the catalytic calcium ion. TMD, transmembrane domain. g, Phagocytosis assay for uptake of pHrodo-labelled indicated Ramos-Cas9 cells by J774 macrophages in the presence of anti-CD20 antibodies, normalized to control (SafeKO) cells (n = 3 cell culture wells). In b, d, e, g, data are mean ± s.d. One-way ANOVA (g) or two-way ANOVA (b, d, e) with Bonferroni correction.
Fig. 3 |
Fig. 3 |. APMAP loss sensitizes diverse tumour types to monoclonal antibodies in vitro and in mice.
a, Phagocytosis assay for uptake of pHrodo-labelled cells for indicated Cas9-expressing cell lines—Ramos (B cell lymphoma), Karpas-299 (T cell lymphoma), HCT-116 (colorectal 1), RKO (colorectal 2), SKBR3 (breast), OVCAR8 (ovarian), K562 (leukaemia), NCI-H23 (non-small-cell lung carcinoma (NSCLC)), NCI-H82 (small-cell lung carcinoma (SCLC)) and HeLa (cervical)—expressing indicated sgRNAs by J774 macrophages in the presence or absence of anti-CD47 antibodies. Phagocytosis index normalized to control (SafeKO) cells without anti-CD47. Data are mean ± s.d. (n = 4 cell culture wells for all but Karpas-299 and NCI-H82, for which n = 3). One-way ANOVA with Bonferroni correction. b, SafeKO or APMAPKO NCI-H82 cells were transplanted into NSG mice and allowed to form tumours. Mice were treated with anti-CD47 or PBS daily starting 12 d after transplantation, and tumour size was measured every 2 d. Data are mean ± s.e.m. (n = 5). Two-way ANOVA with Tukey correction. c, SafeKO or APMAPKO Ramos cells were transplanted into NSG mice and allowed to form tumours. Mice were treated with anti-CD20 or PBS daily starting 21 d after transplantation, and tumour size was measured every 2 d. Data are mean ± s.e.m. (n = 6 (control groups) or 7 (antibody-treated groups)). Two-way ANOVA with Tukey correction.
Fig. 4 |
Fig. 4 |. GPR84 mediates enhanced uptake of APMAPKO cancer cells.
a, Schematic of macrophage screen, using a genome-wide CRISPR knockout library in J774 macrophages, for uptake of calcein+ SafeKO cells and far red+ APMAPKO Ramos cells. Req., required. b, Volcano plot of all genes required for uptake of APMAPKO cells (comparison 1 of screen depicted in a). c, Volcano plot of genes selectively required for uptake of APMAPKO cells relative to SafeKO cells (comparison 2 of screen depicted in a). d, Phagocytosis assay for uptake of pHrodo-labelled Ramos-Cas9 cells expressing indicated sgRNAs, incubated with J774 macrophages expressing indicated sgRNAs, in the presence of anti-CD20 antibodies, normalized to Safe-1 macrophages with SafeKO Ramos cells (n = 4 culture wells). P values are for comparisons with Safe-1 macrophages for each Ramos cell type. e, Phagocytosis assay for uptake of pHrodo-labelled SafeKO Ramos cells, incubated with U937 macrophages, anti-CD20 antibodies and indicated GPR84 agonists at indicated concentrations, normalized to untreated cells (n = 4 cell culture wells). P values are for comparisons with untreated cells. f, Model for APMAP-mediated regulation of macrophage phagocytosis through GPR84, GNB2 and PREX1. The role of PREX1 as a coincidence detector for Gβ and phosphatidylinositol-3,4,5-trisphosphate (PtdIns(3,4,5)P3) in Rac activation is indicated; the Rac-GEF domain of PREX1 is synergistically released from an autoinhibited state upon binding of these two ligands at distinct sites. The question mark indicates a putative role of APMAP enzymatic activity in preventing GPR84-dependent phagocytosis activation. FcR, Fc receptor; mAb, monoclonal antibody. Dotted lines in b, c indicate 5% FDR. In d, e, data are mean ± s.d. One-way ANOVA with Bonferroni correction.

References

    1. Scott AM, Wolchok JD & Old LJ Antibody therapy of cancer. Nat. Rev. Cancer 12, 278–287 (2012). - PubMed
    1. Sliwkowski MX & Mellman I Antibody therapeutics in cancer. Science 341, 1192–1198 (2013). - PubMed
    1. Weiskopf K & Weissman IL Macrophages are critical effectors of antibody therapies for cancer. mAbs 7, 303–310 (2015). - PMC - PubMed
    1. Tsao L-C et al. CD47 blockade augmentation of trastuzumab antitumor efficacy dependent on antibody-dependent cellular phagocytosis. JCI Insight 4, e131882 (2019). - PMC - PubMed
    1. Brodsky FM Monoclonal antibodies as magic bullets. Pharm. Res. 5, 1–9 (1988). - PubMed

Publication types

MeSH terms