. 2021 Sep;597(7878):709-714.
doi: 10.1038/s41586-021-03892-7. Epub 2021 Sep 8.

A lymphocyte-microglia-astrocyte axis in chronic active multiple sclerosis

Affiliations

A lymphocyte-microglia-astrocyte axis in chronic active multiple sclerosis

Martina Absinta et al. Nature. 2021 Sep.

Abstract

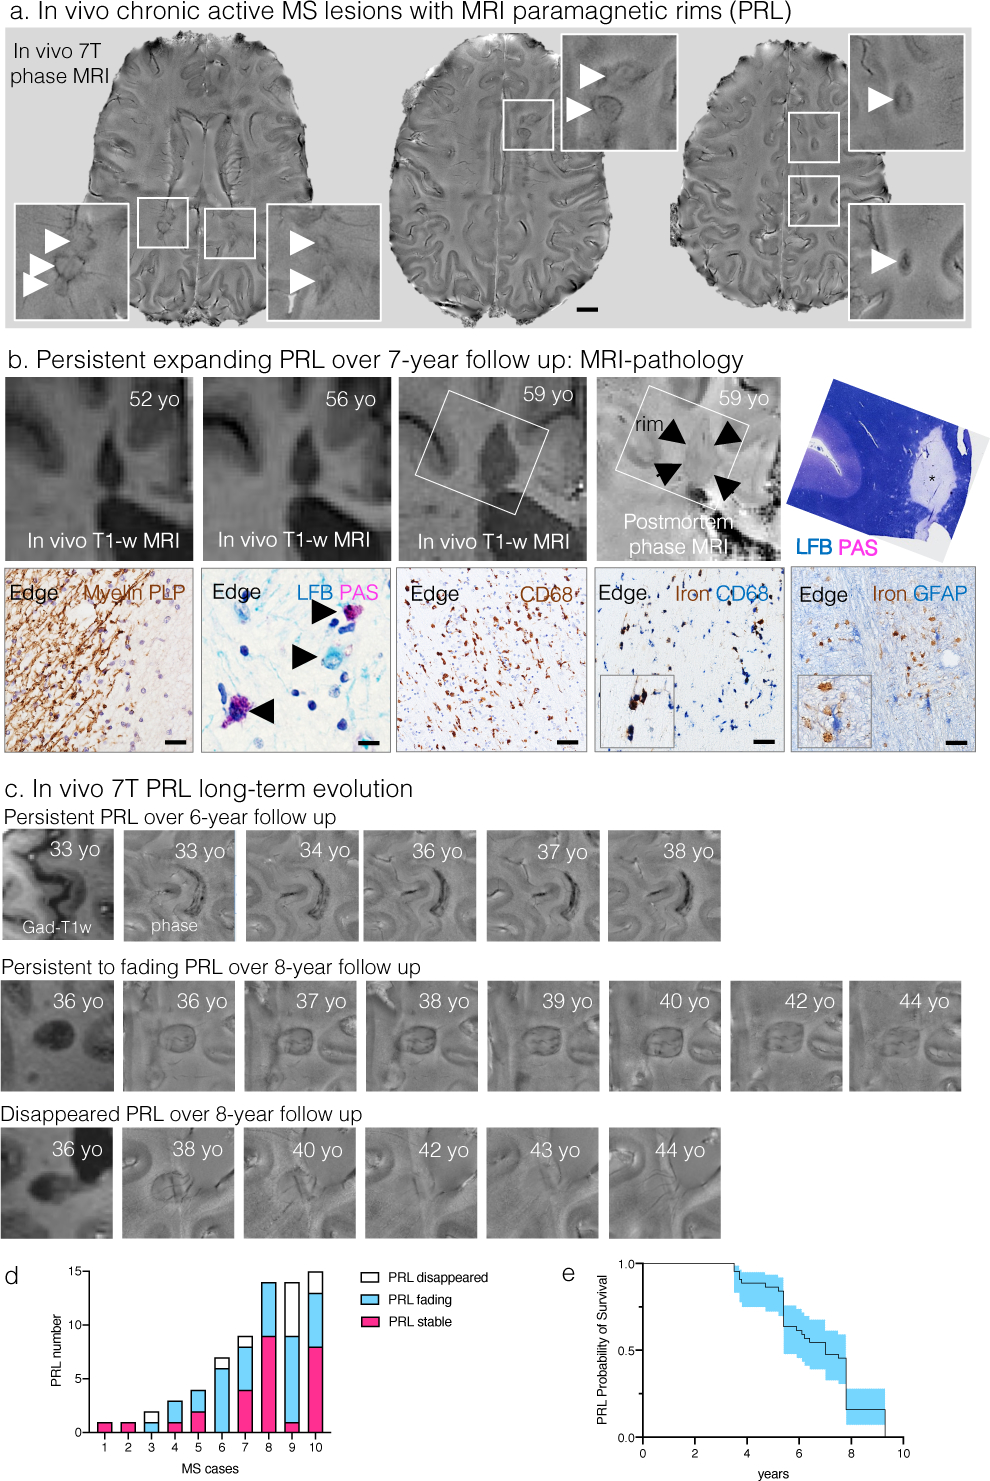
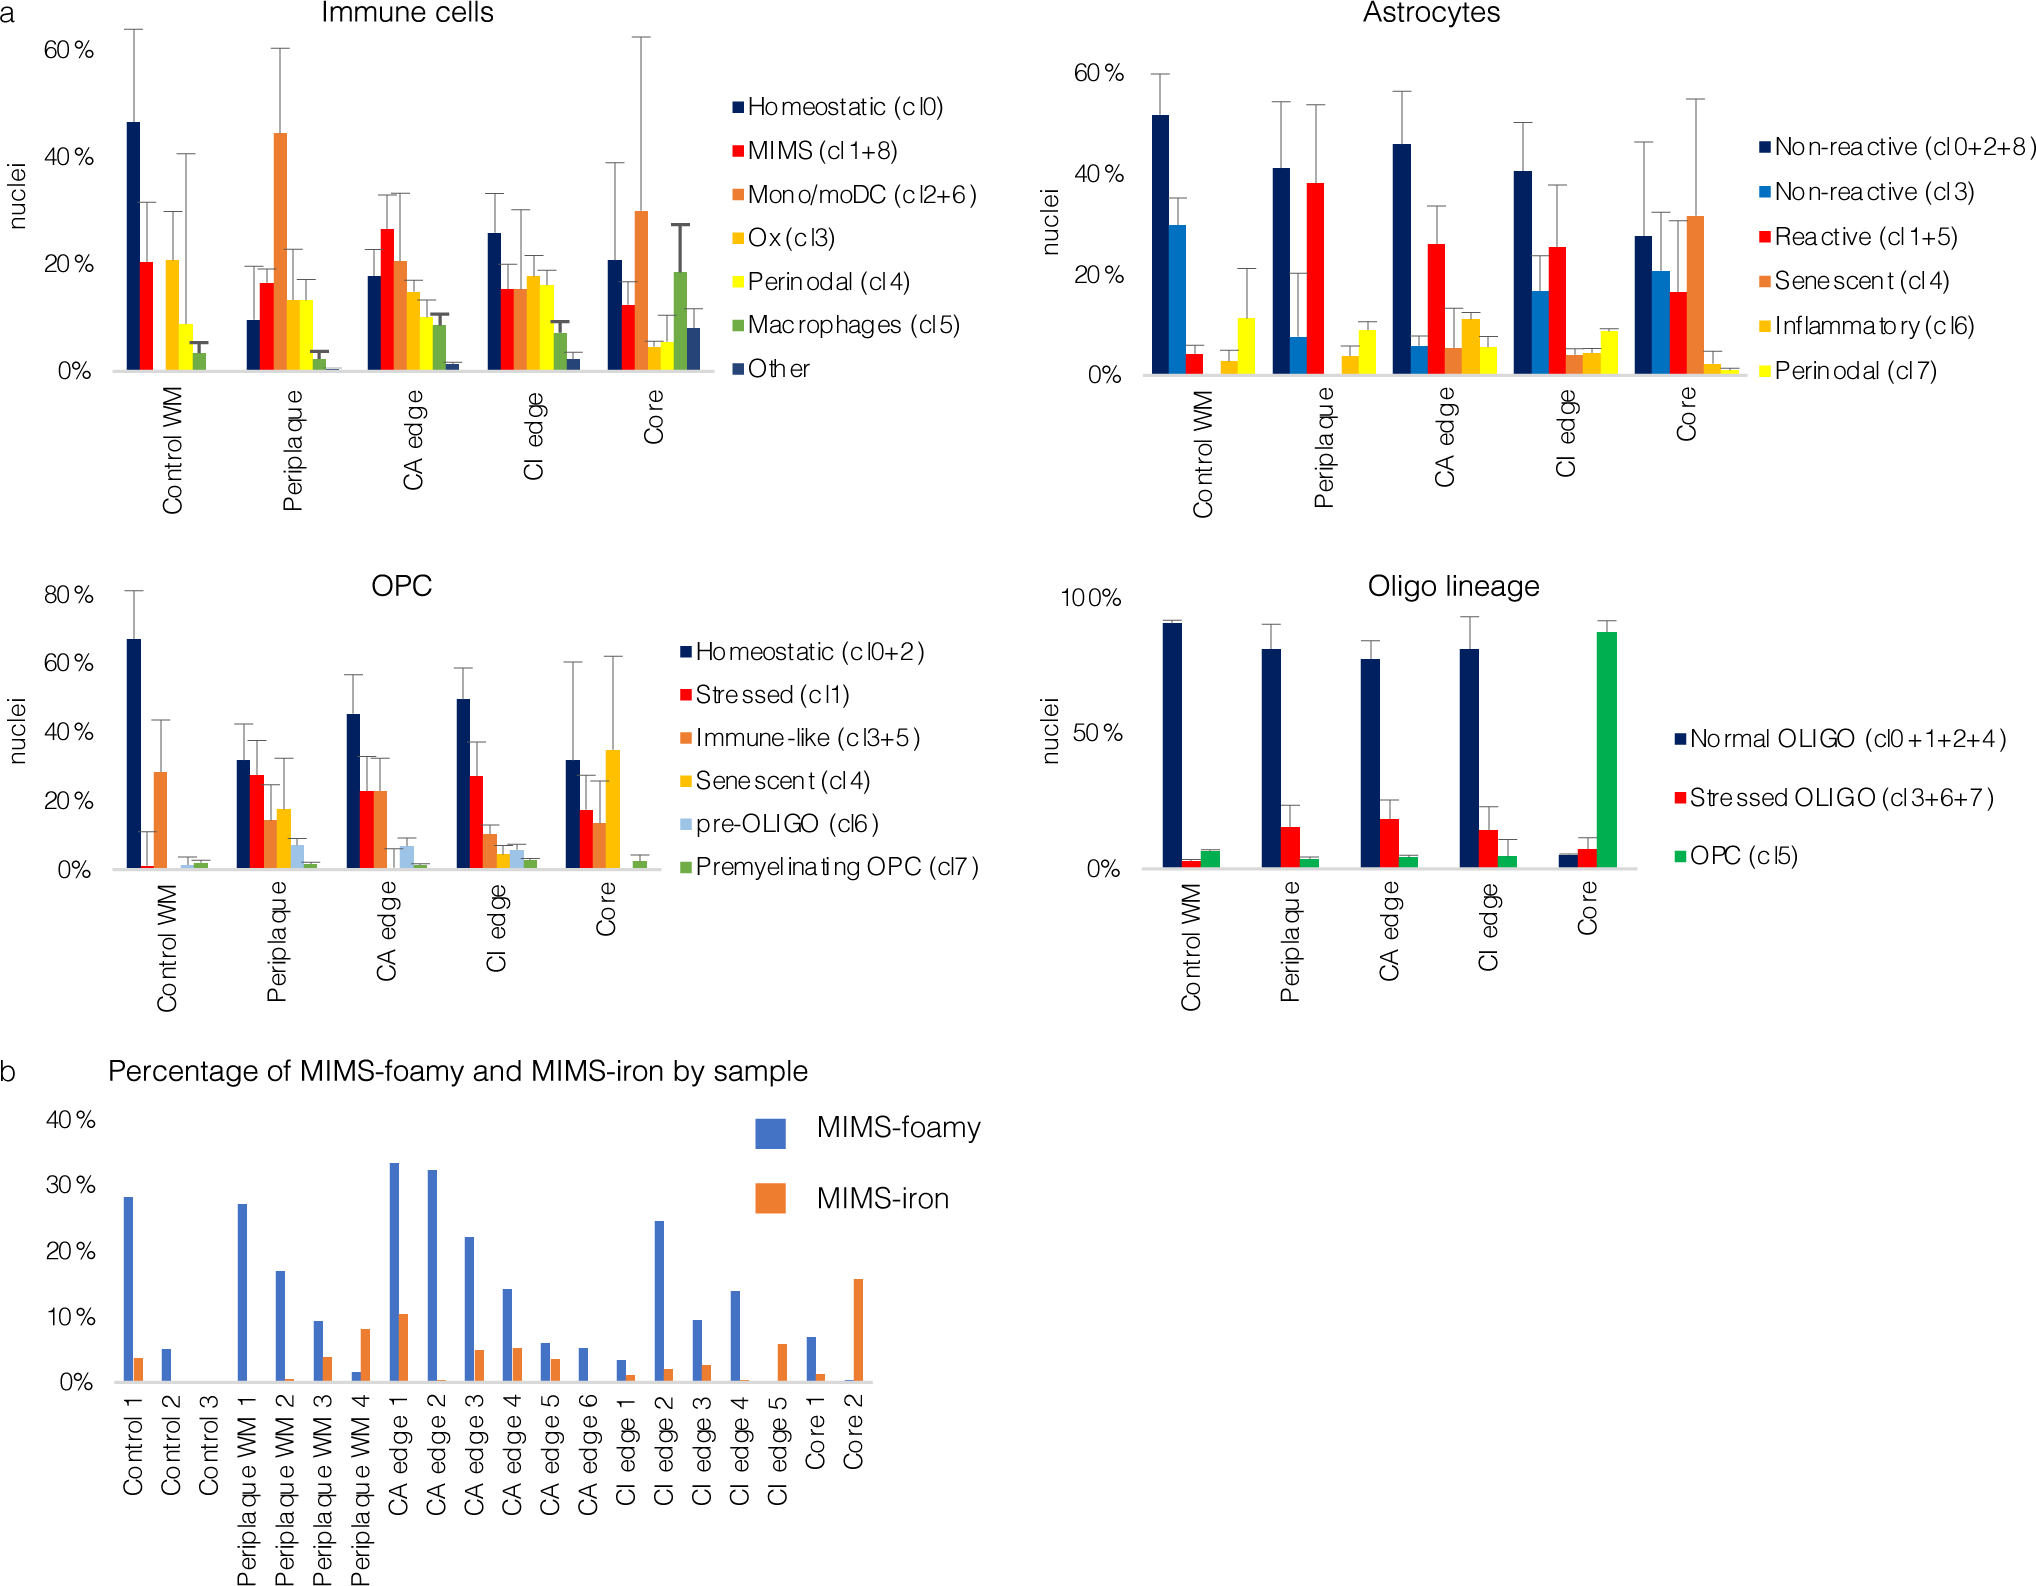
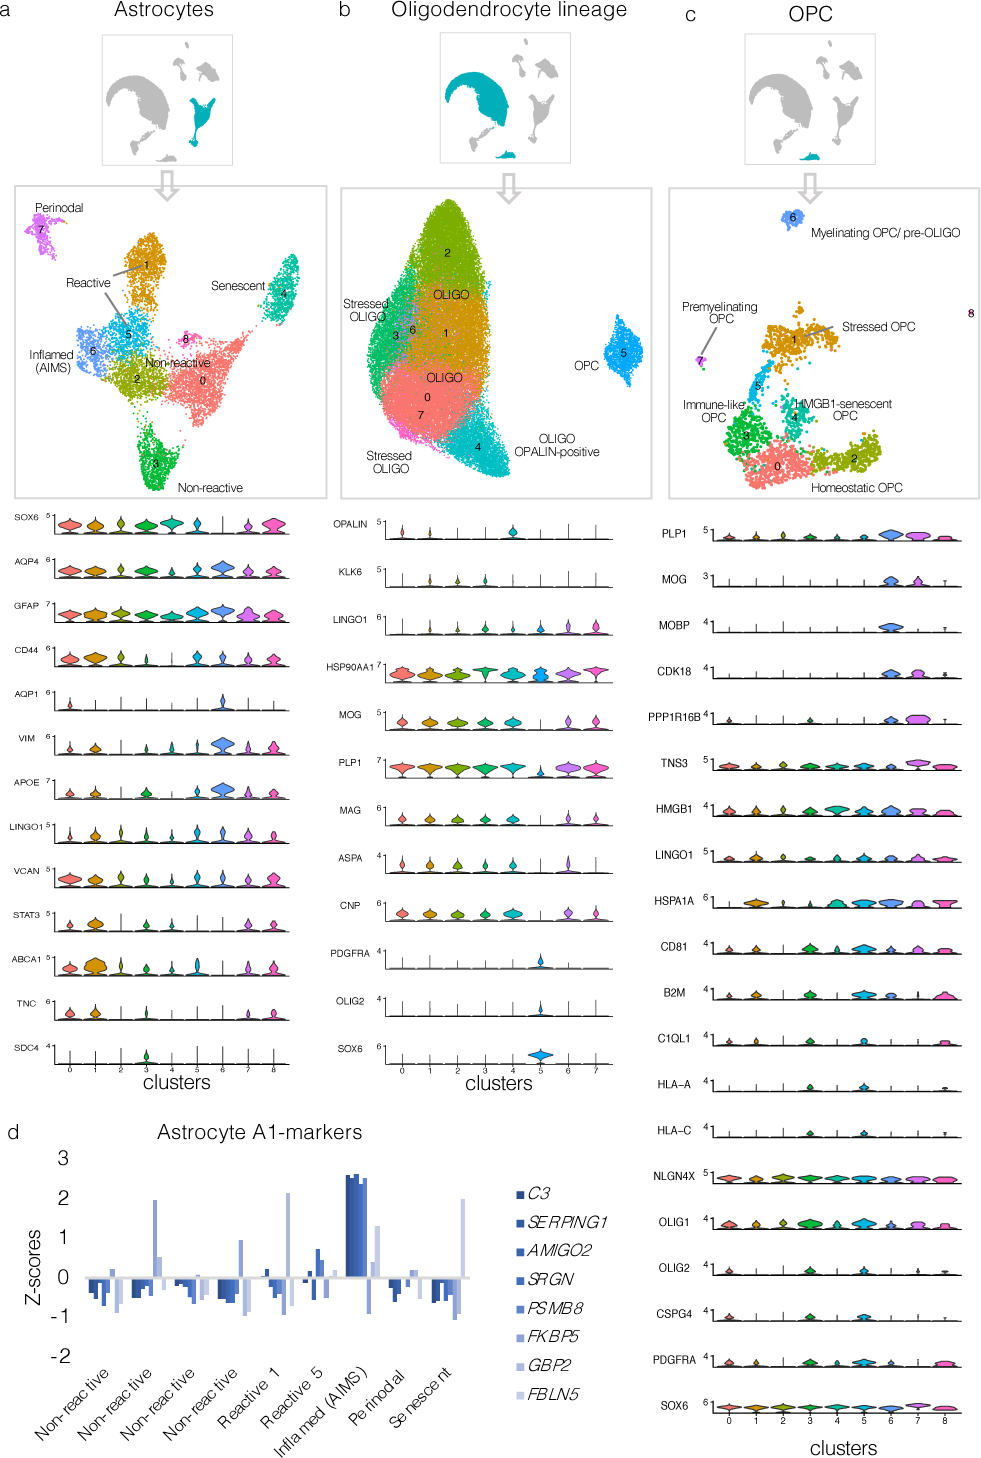
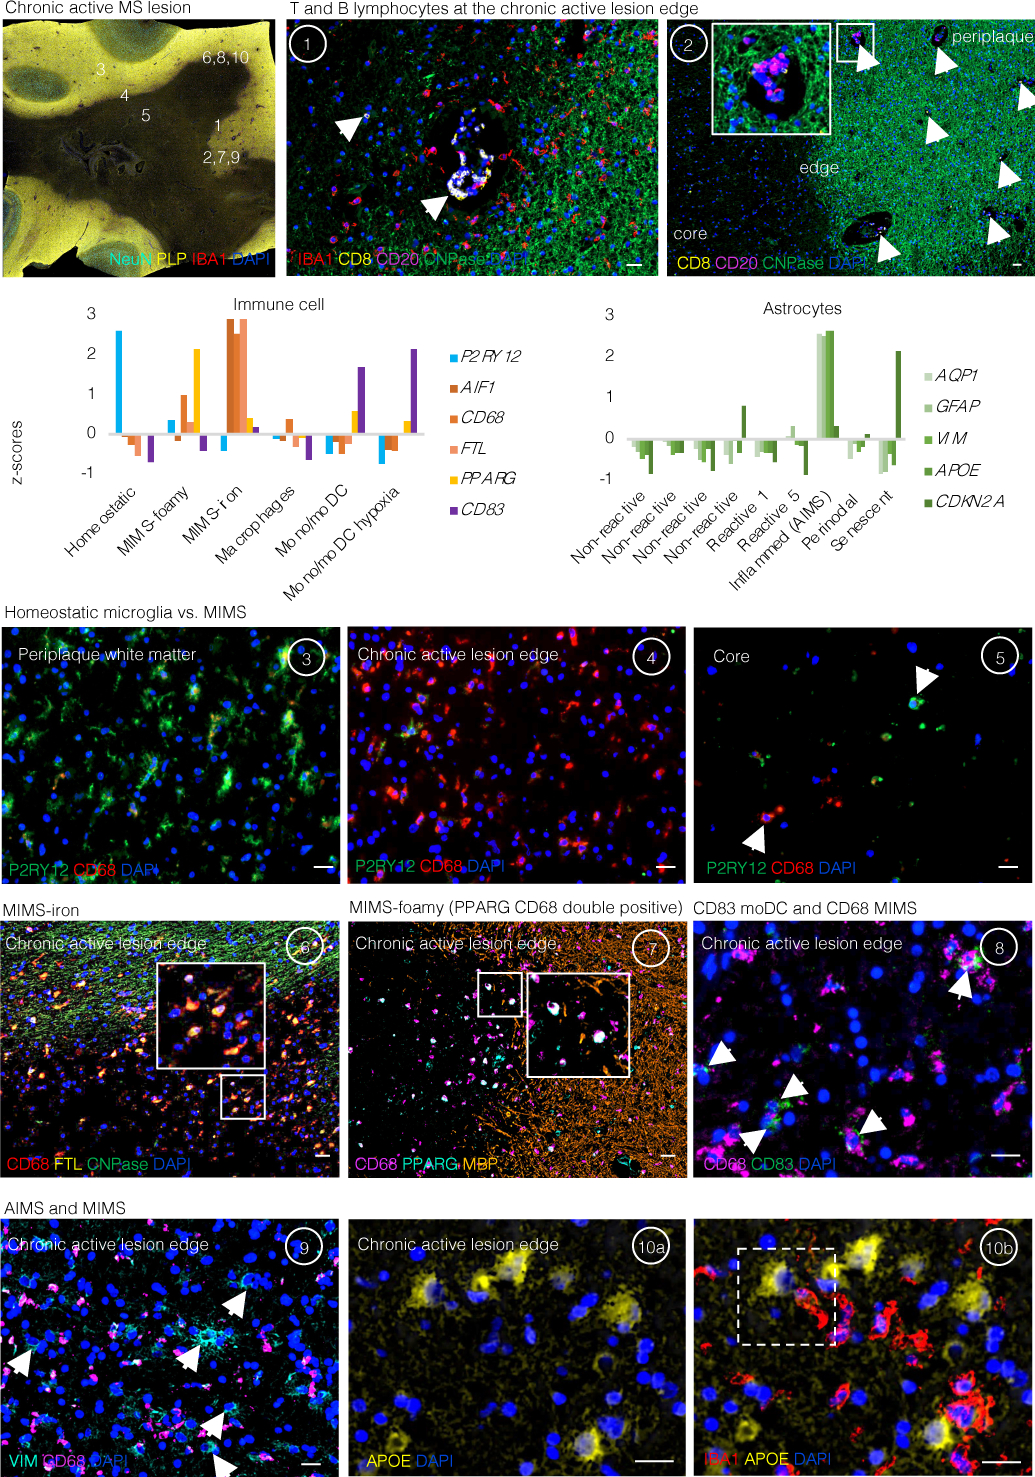
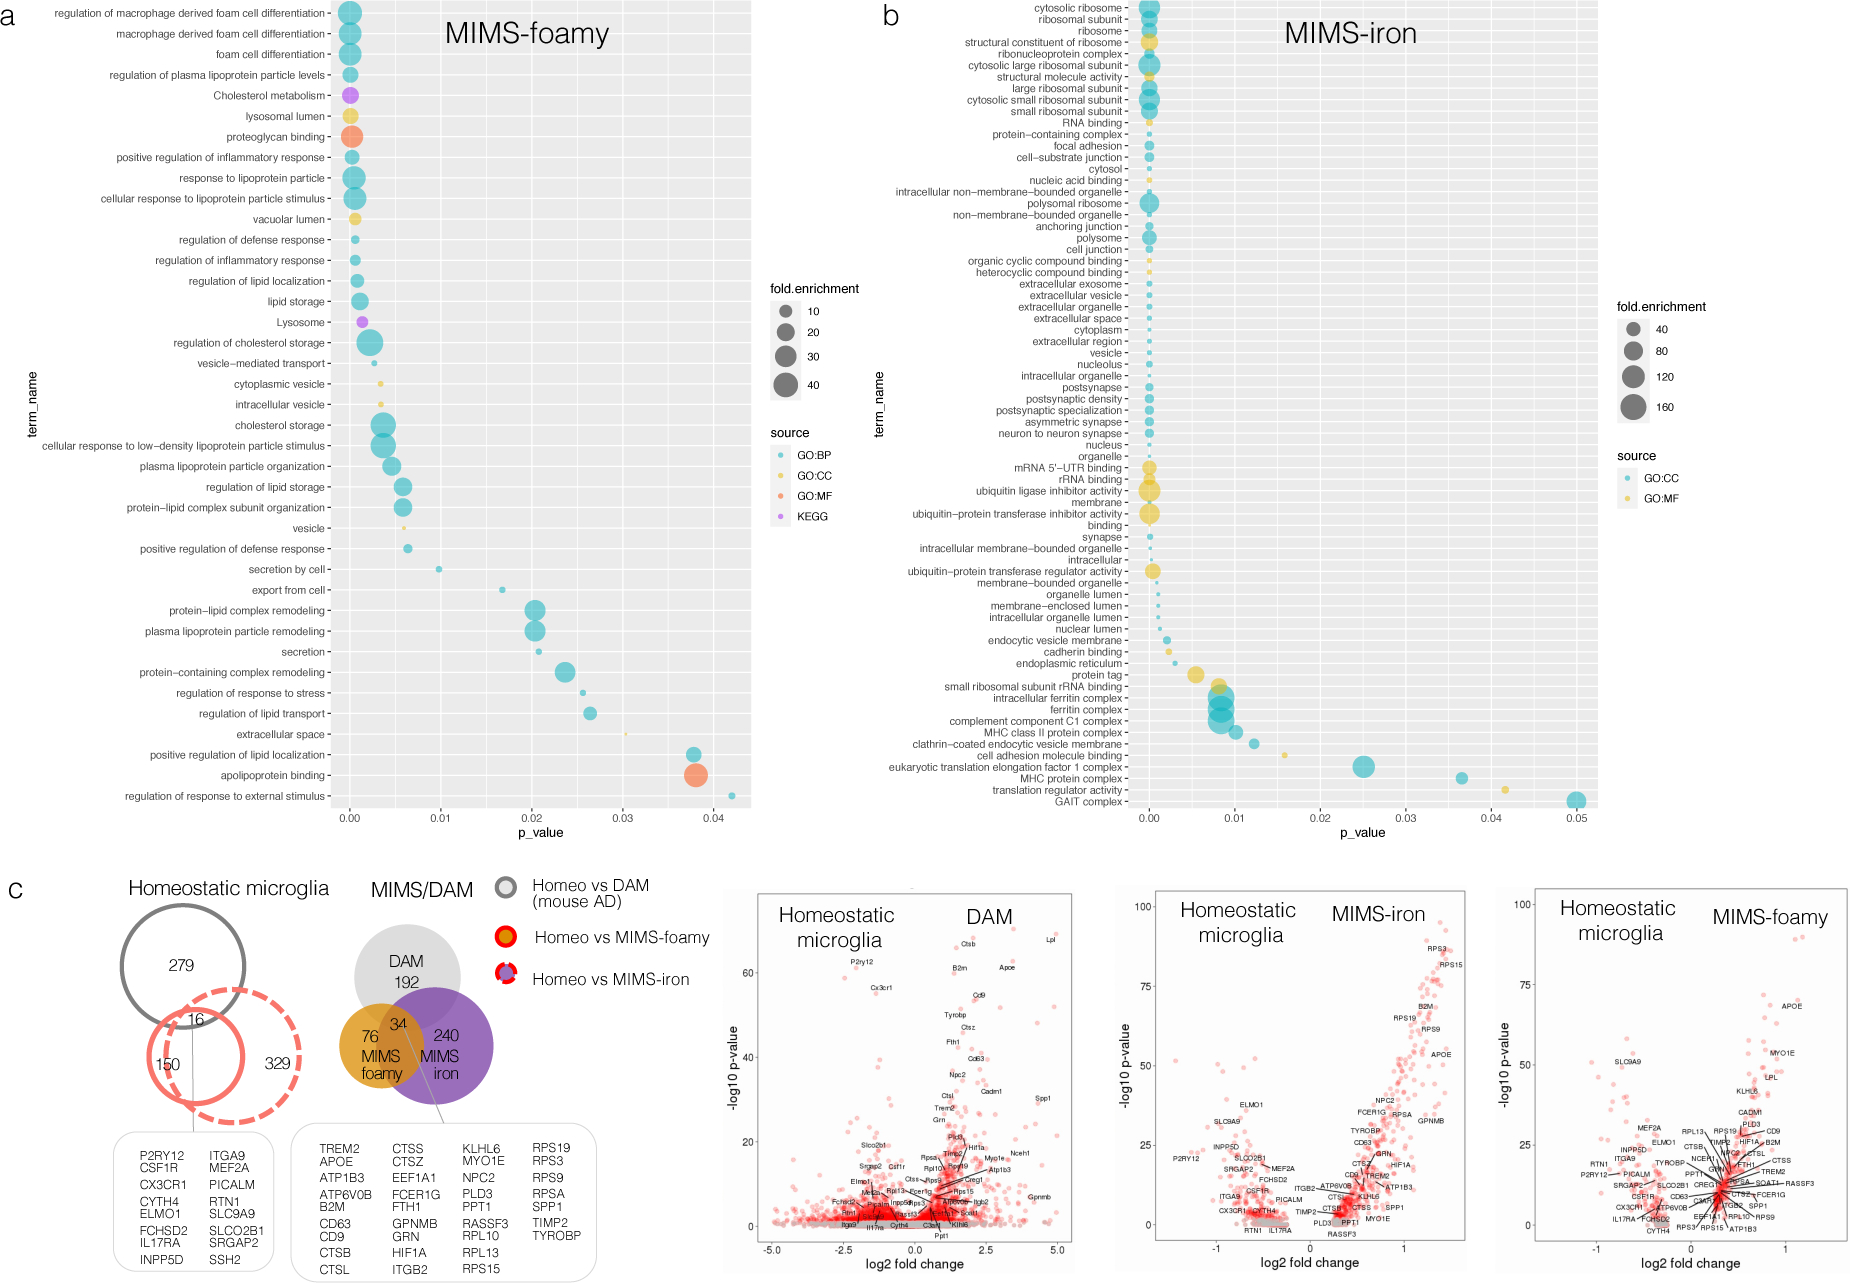
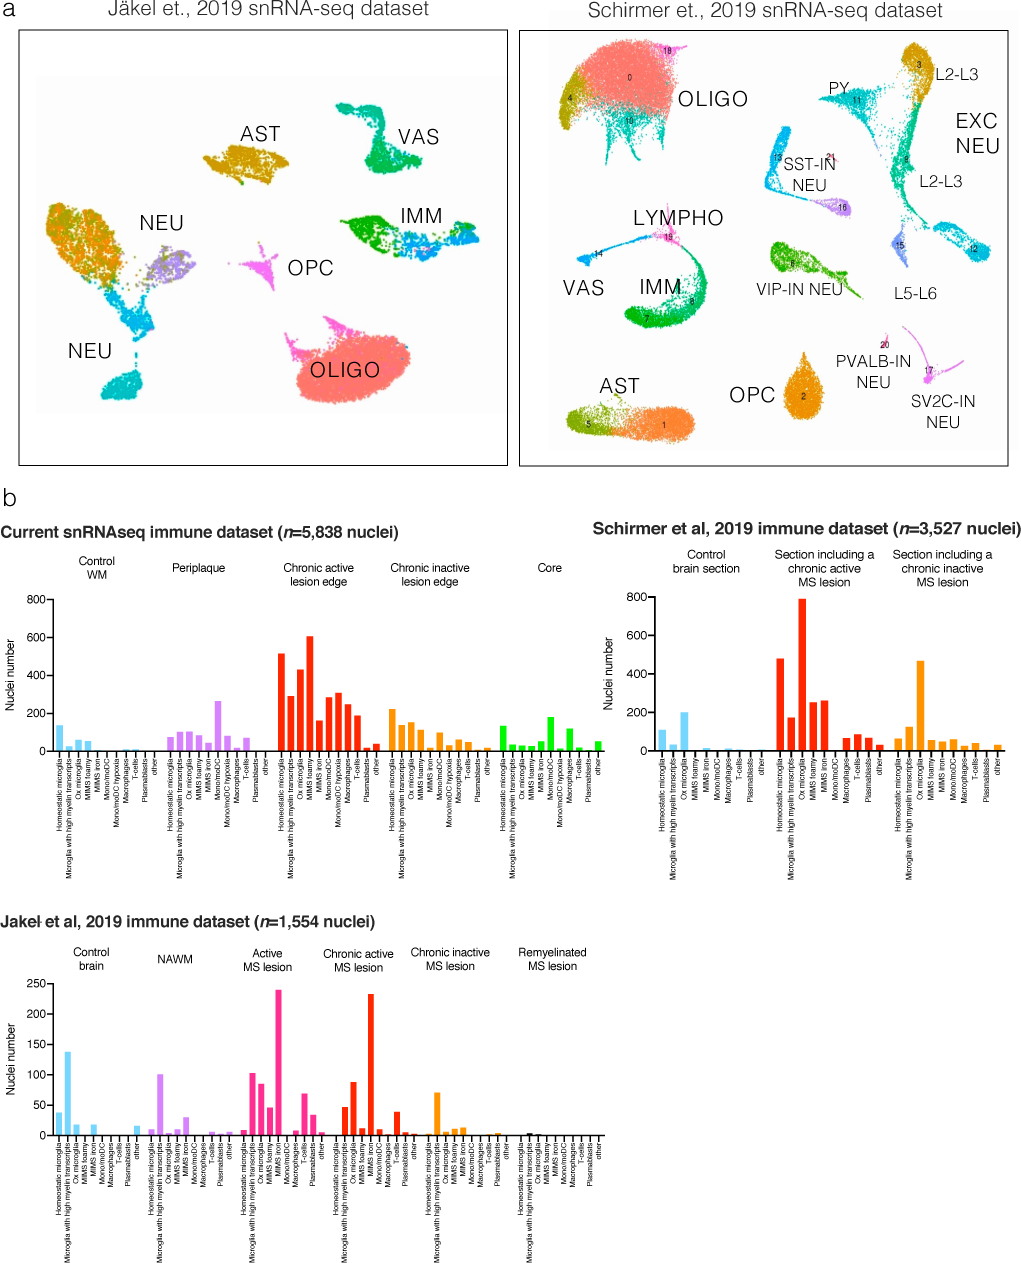
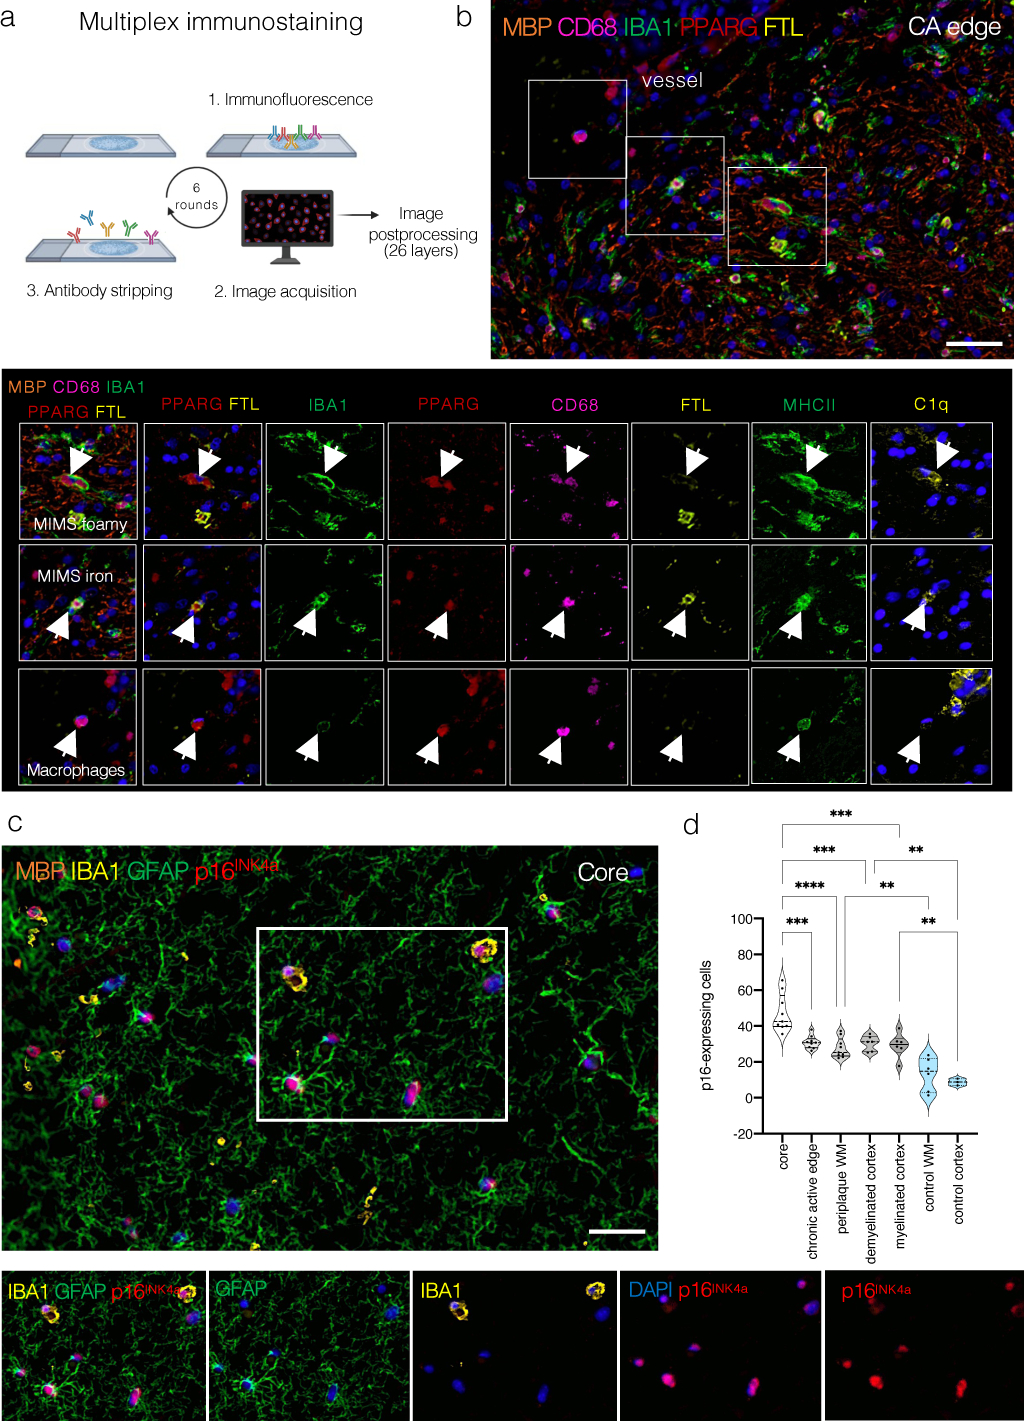
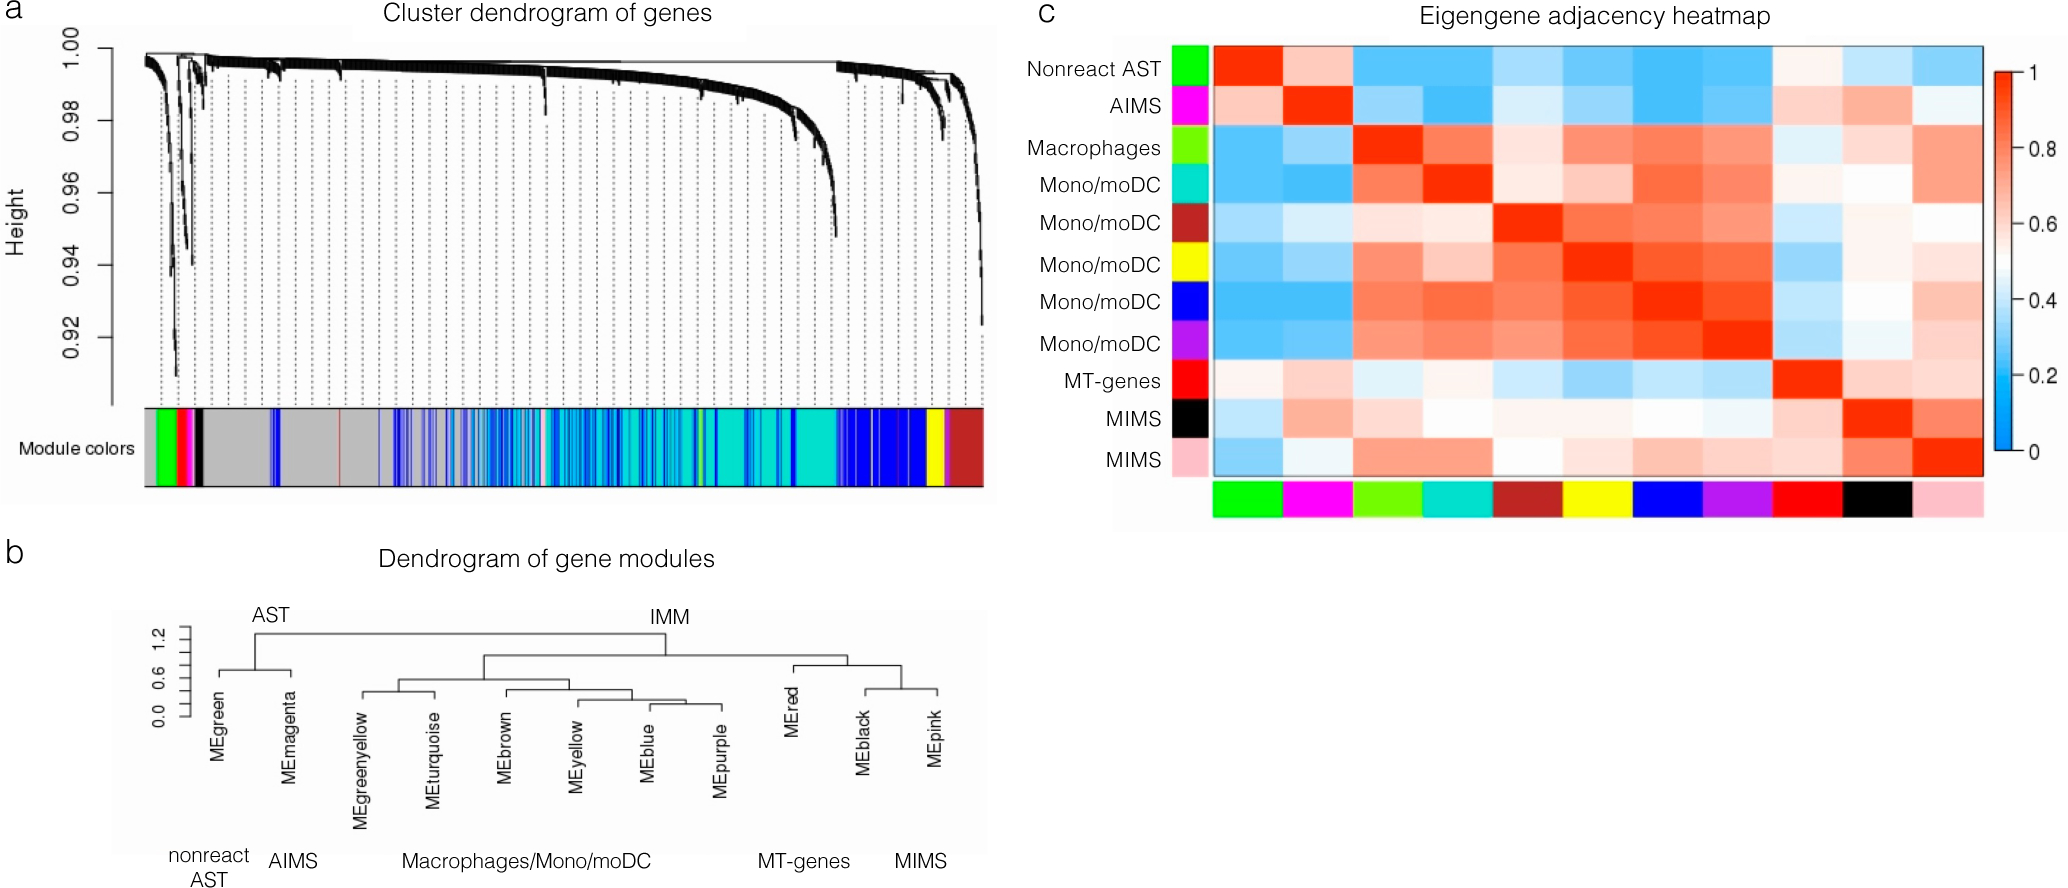
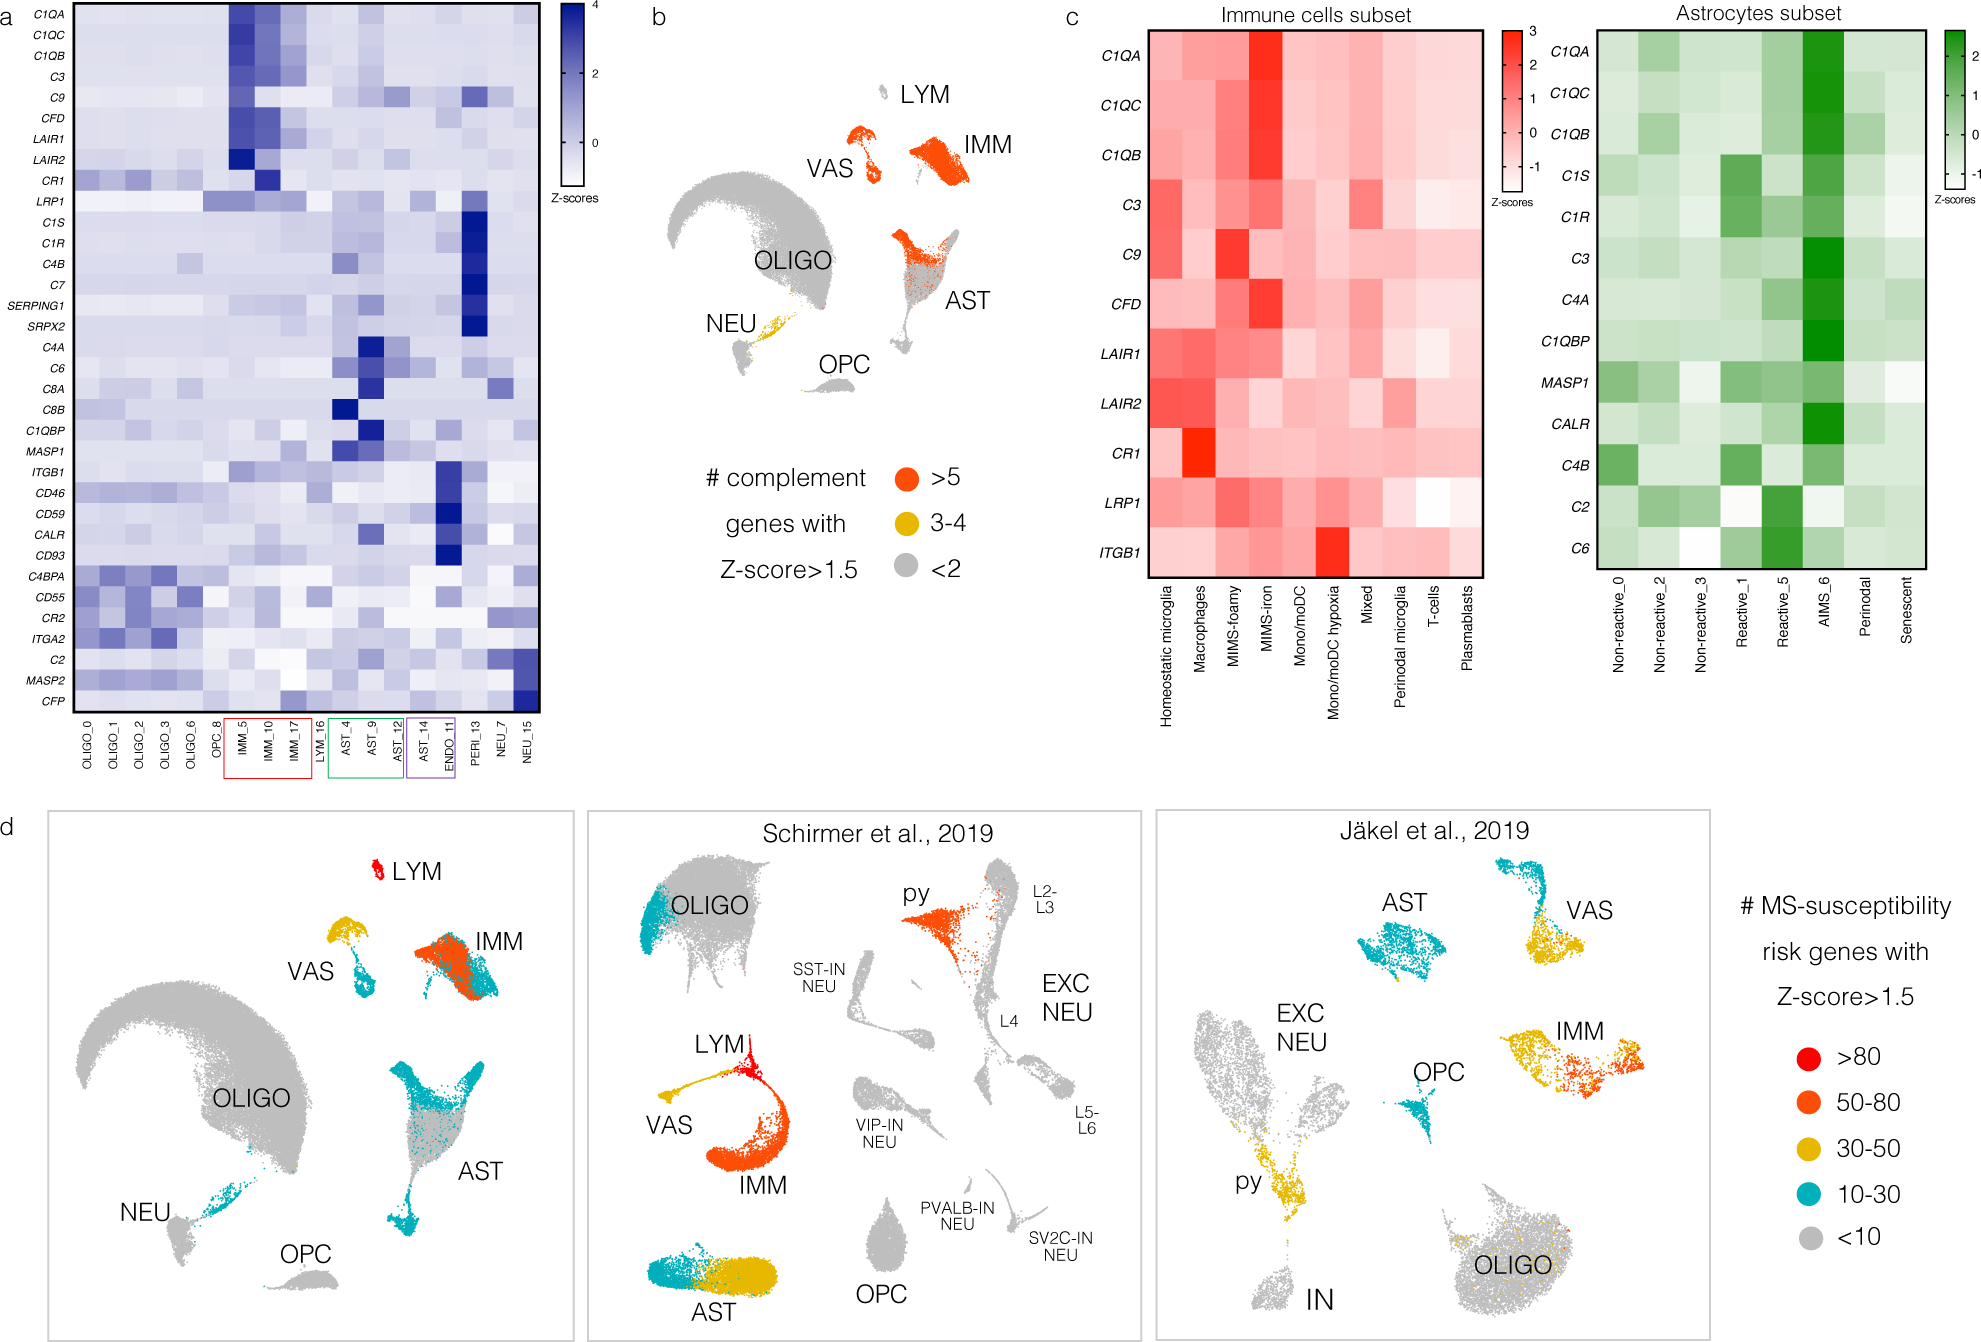
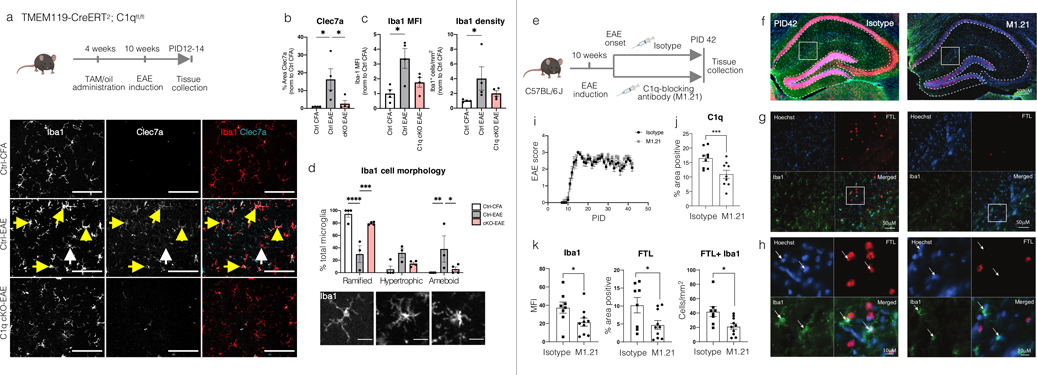
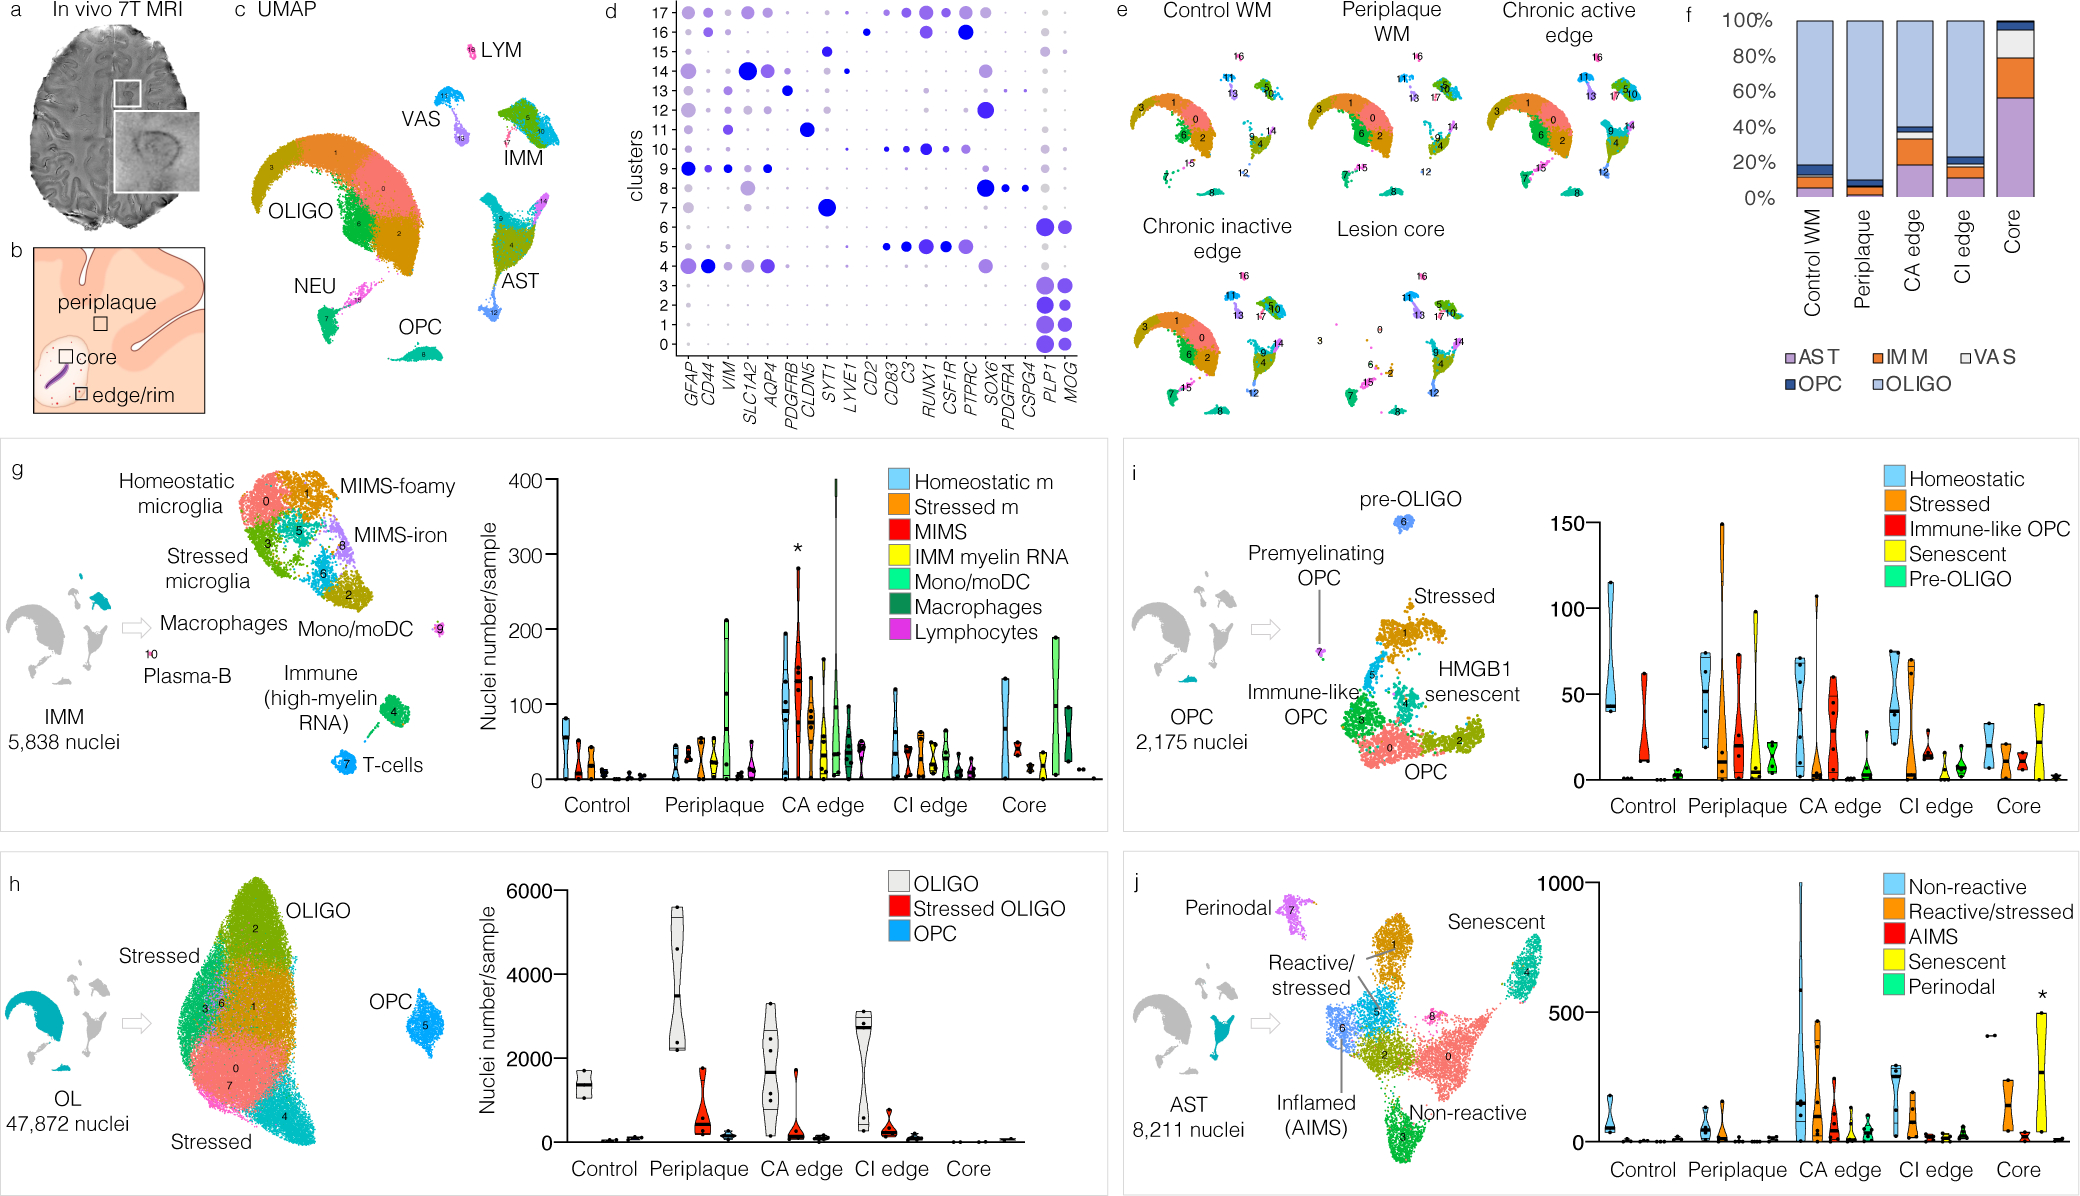
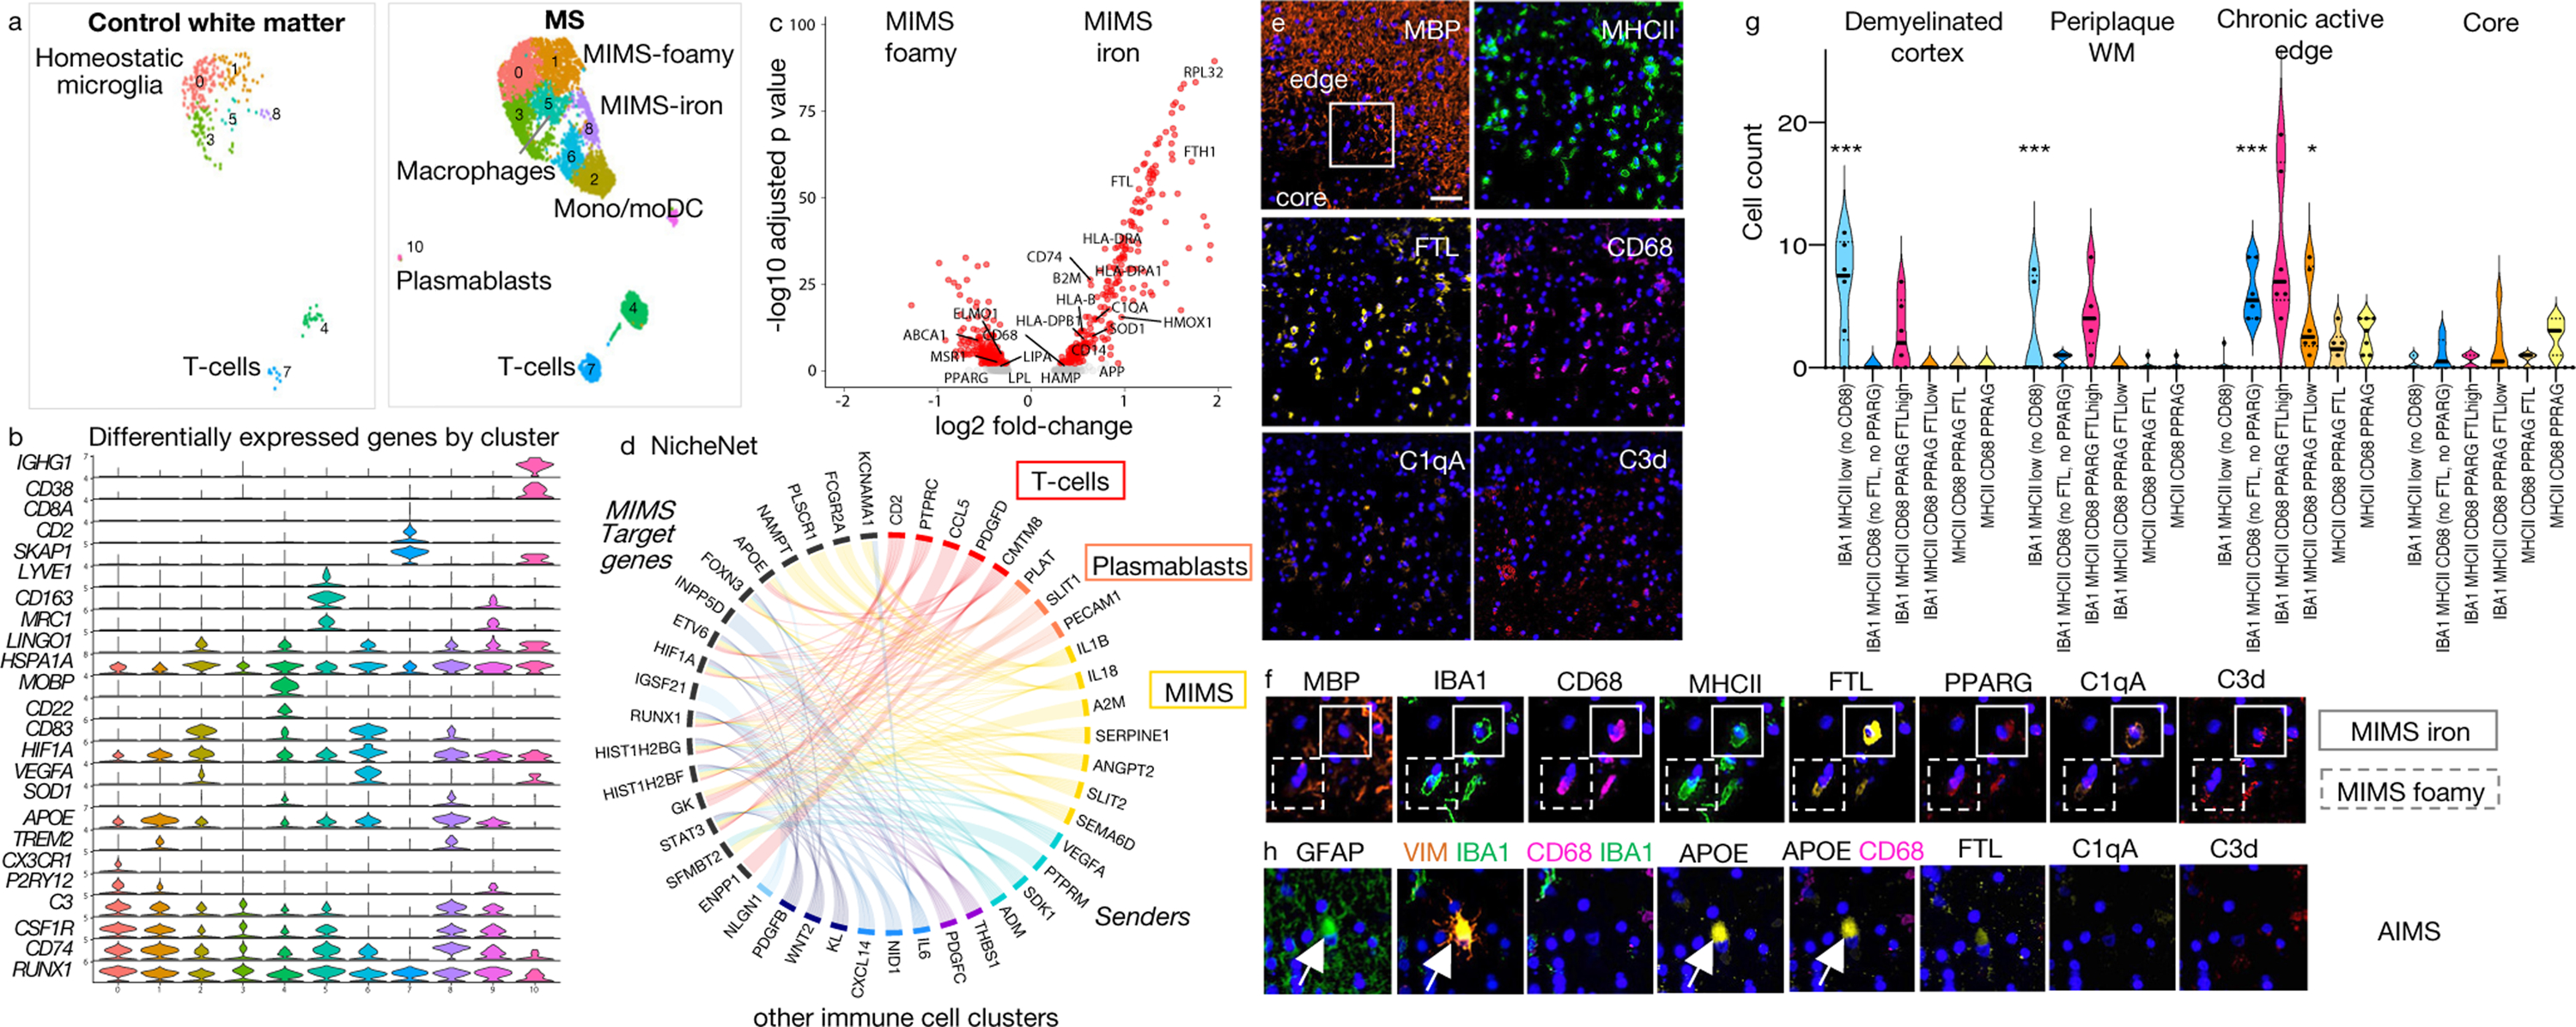
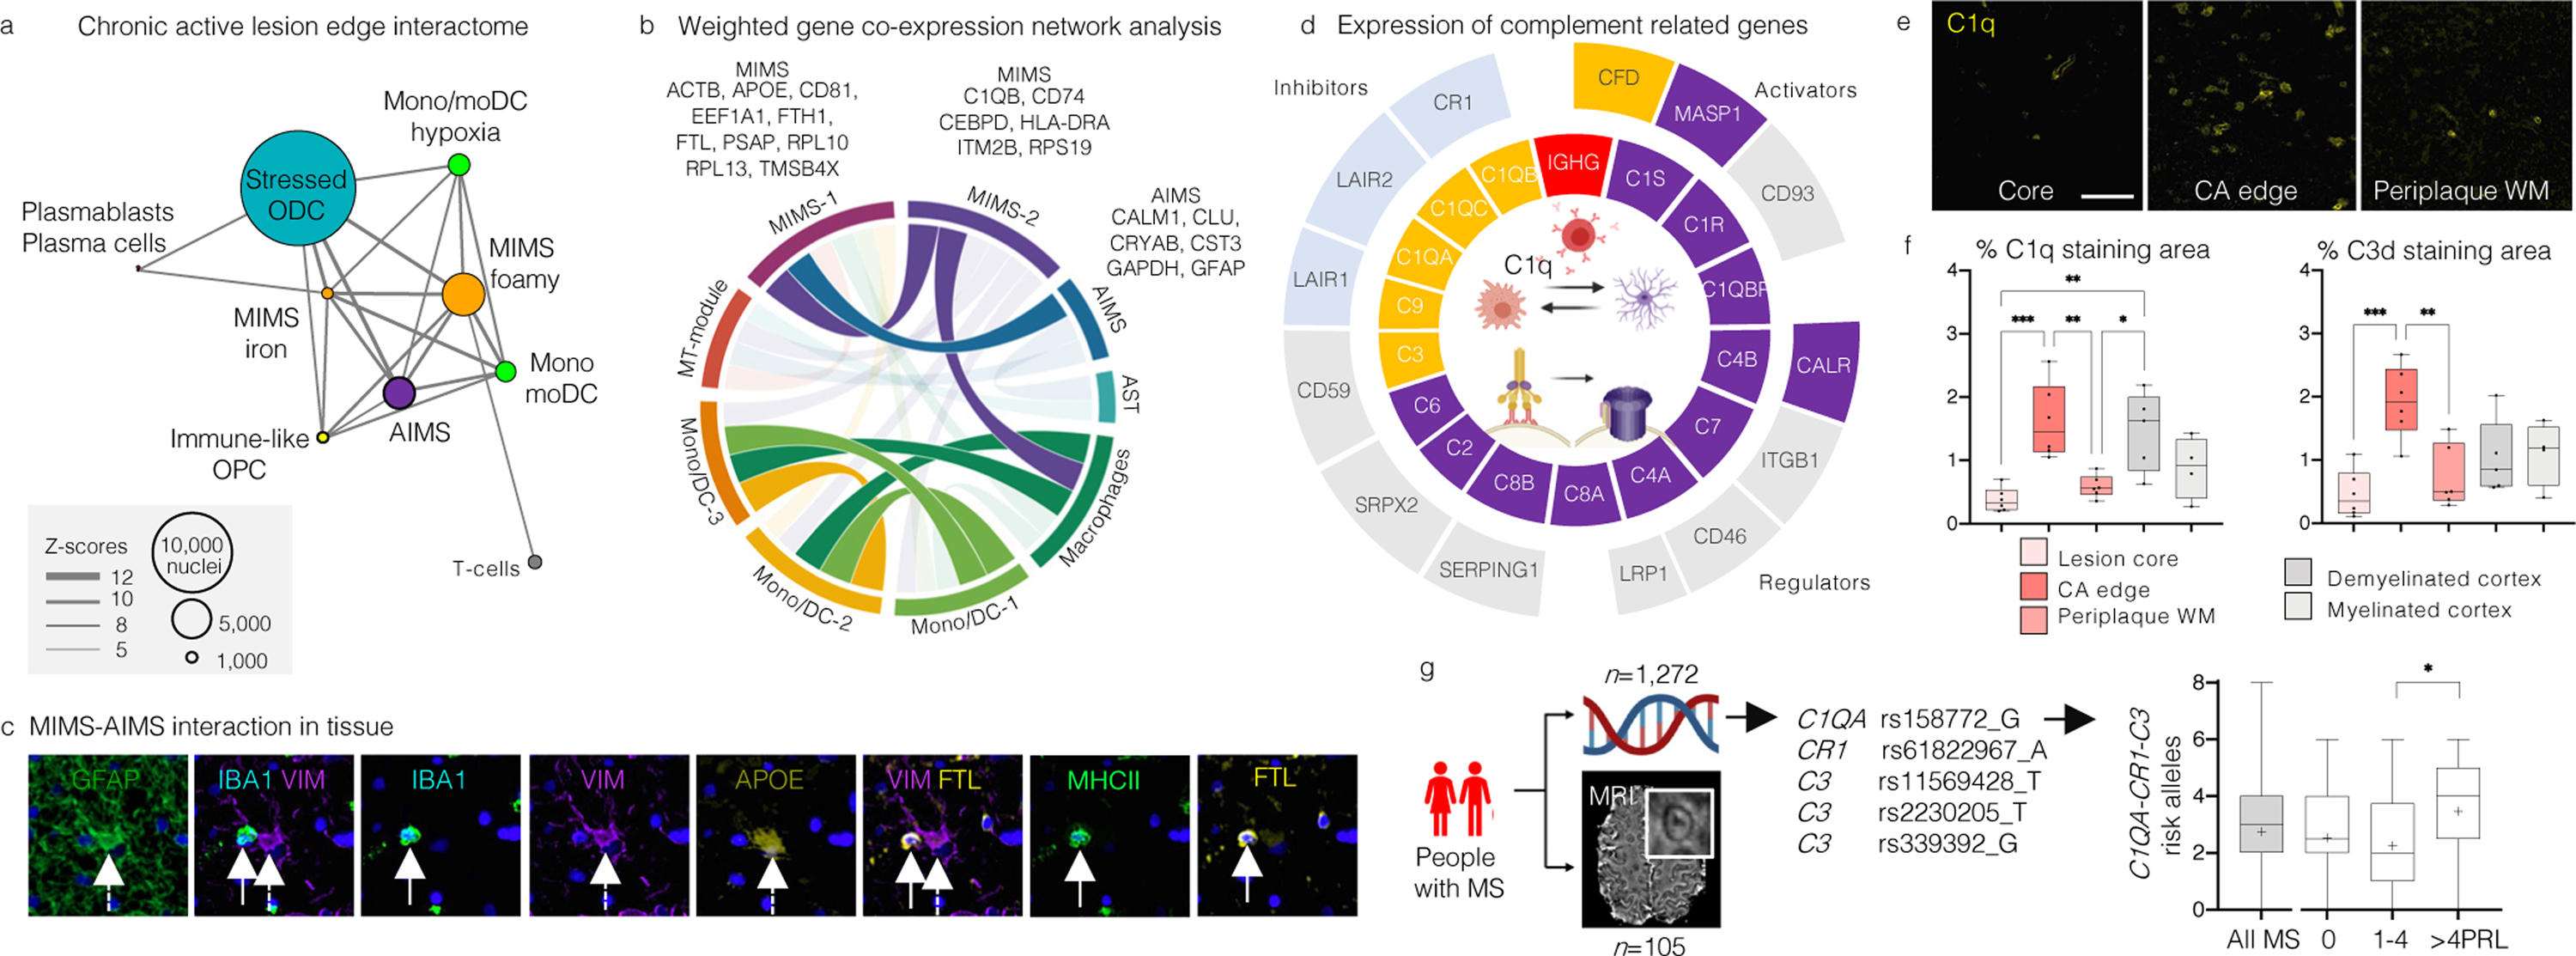
Multiple sclerosis (MS) lesions that do not resolve in the months after they form harbour ongoing demyelination and axon degeneration, and are identifiable in vivo by their paramagnetic rims on MRI scans1-3. Here, to define mechanisms underlying this disabling, progressive neurodegenerative state4-6 and foster development of new therapeutic agents, we used MRI-informed single-nucleus RNA sequencing to profile the edge of demyelinated white matter lesions at various stages of inflammation. We uncovered notable glial and immune cell diversity, especially at the chronically inflamed lesion edge. We define 'microglia inflamed in MS' (MIMS) and 'astrocytes inflamed in MS', glial phenotypes that demonstrate neurodegenerative programming. The MIMS transcriptional profile overlaps with that of microglia in other neurodegenerative diseases, suggesting that primary and secondary neurodegeneration share common mechanisms and could benefit from similar therapeutic approaches. We identify complement component 1q (C1q) as a critical mediator of MIMS activation, validated immunohistochemically in MS tissue, genetically by microglia-specific C1q ablation in mice with experimental autoimmune encephalomyelitis, and therapeutically by treating chronic experimental autoimmune encephalomyelitis with C1q blockade. C1q inhibition is a potential therapeutic avenue to address chronic white matter inflammation, which could be monitored by longitudinal assessment of its dynamic biomarker, paramagnetic rim lesions, using advanced MRI methods.


Conflict of interest statement

Competing interests

The authors declare no competing interests. MA received consulting fees from Sanofi, unrelated to this study. PC received grant support from Annexon Biosciences for testing the anti-C1q-blocking antibody in EAE. The funders of the study had no role in the collection, analysis, or interpretation of data, in the writing of the manuscript, or in the decision to submit the paper for publication.

Figures

Extended Data Fig. 1.
Extended Data Fig. 1.. Chronic active/slowly expanding rim lesions can be visualized with MRI in vivo.
(a) Susceptibility-based axial MRI at three levels showing the chronic active MS lesions with paramagnetic rims (magnified view in the insets, arrows) of a 38-year-old man with progressive MS, who requires assistance to walk 100 meters without resting. Scale bar=10 mm. (b) MRI-pathology of a frontal periventricular chronic active/slowly expanding lesion in a man with progressive MS who died at age 59. On the serial in vivo T1-weighted coronal images (clinical MR images sensitive to both demyelination and axonal loss), the rim lesion clearly expanded over a period of 7 years. The lesion was classified as chronic active by histological analysis. Accumulation of iron-laden phagocytes (CD68 and Turnbull iron staining) was seen at the lesion edge (asterisk on LFB-PAS staining). Smouldering demyelination can also be inferred by the co-presence of early (LFB+, blue) and late (PAS+, purple) myelin degradation products within phagocytes at the lesion edge. Most reactive GFAP+ astrocytes do not contain iron. Magnified views are shown in the insets. Scale bar=20 μm (myelin PLP); 10 μm (LFB-PAS); 50 μm (CD68, Turnbull iron/CD68, Turnbull iron/GFAP). (c) In vivo long-term evolution of paramagnetic rim lesions: representative examples of persistent/stable, faded, and disappeared rims. (d) Bar graph showing the evolution of paramagnetic rim lesions in each MS case followed over time. All cases had >5 years of yearly MRI follow up, except for cases 2–4, where follow-up was between 3.5 and 5 years. (e) Survival analysis showed that the median PRL survival time is about 7 years.
Extended Data Fig. 2.
Extended Data Fig. 2.. Cell cluster proportions vary across tissue types.
(a) Bar graphs showing the distribution of nuclei percentages by cell type (mean, standard error). See Fig. 2 for corresponding UMAP plots and distribution of nuclei count per sample. (b) Bar graph showing the percentage of MIMS-foamy and MIMS-iron nuclei for each sample and location. WM=white matter; CA=chronic active; CI=chronic inactive; UMAP=uniform manifold approximation and projection; MIMS=microglia inflamed in multiple sclerosis; OPC=oligodendrocyte progenitor cell; monoDC=monocyte/dendritic cell; Ox=oxidative stress.
Extended Data Fig. 3.
Extended Data Fig. 3.. Subclustering markers for astrocytes, oligodendrocytes, and OPC.
(a–c) Subclustering UMAP plots in astrocytes, oligodendrocytes, and OPC and associated stacked violin plots depicting selected differentially expressed genes for each subcluster. (d) Bar graph showing A1-marker expression (Z-scores relative to all astrocytes) for each astrocyte cluster. Most A1 markers were highly expressed in AIMS. UMAP=uniform manifold approximation and projection; OPC=oligodendrocyte progenitor cells; AIMS=astrocytes inflamed in MS.
Extended Data Fig. 4.
Extended Data Fig. 4.. Lymphocytes, monocyte-derived dendritic cells, MIMS, and AIMS are identified at the chronic active lesion edge.
Chronic active lesion overview. Multiplex immunostaining of a brain tissue block from a 48-year-old woman with progressive MS (case MS4 in Supplementary Table 1), including a chronic active demyelinated lesion (devoid of myelin proteolipid protein (PLP) staining). Numbers indicate areas magnified in subsequent panels for validation of immune cell and inflamed astrocytes and represent the chronic active lesion edge, lesion centre, and periplaque WM. Lymphocytes and microglia at the lesion edge (panels 1 and 2). At the chronic active lesion edge, there are groups of CD8 T-cells within the perivascular space and sparsely within the parenchyma (arrows). CD20 B-cells are fewer than CD8 T-cells and are located prevalently within the perivascular space (dashed arrows). Transition from myelination to demyelination is shown with staining for CNPase, an oligodendrocyte and myelin marker. Residual myelin fragments can be seen at the edge (arrowheads), presumably not yet removed by phagocytes. IBA1-microglia/macrophages are frequent, and they have an activated morphology (round shape without ramifications). Bar graphs (second row) show the gene expression Z-scores of markers implemented for the identification in tissue of the most relevant glial cell populations at the chronic active lesion edge. Homeostatic microglia vs. MIMS: different spatial locations (insets 3–5). In the periplaque WM, most microglia are P2RY12+ (a homeostatic marker) with short and thick processes, whereas at the chronic active lesion edge, most are CD68+ (indicating upregulation of antigen and lipid processing) with round, activated morphology. At the lesion core, fewer microglia can be identified, and these show a round morphology consistent with activation. Interestingly, some of them are P2RY12+, potentially suggesting the return of some homeostatic markers. MIMS-iron (inset 6). Accumulation of iron-laden phagocytes (CD68 and ferritin light chain, FTL) is seen at the lesion edge. FTL is within the first 100 top differentially expressed genes in MIMS, especially in MIMS-iron (Fig. 3c). Iron retention in phagocytes can be seen by MRI at the chronic active lesion edge as a paramagnetic rim (MRI biomarker; Fig. 1a). MIMS-foamy (inset 7). Colocalization of PPARG and CD68. PPARG and CD68 double positive (white, arrows) microglia are especially seen at the lesion edge, suggesting their involvement in energy metabolism and modulation of inflammation as well as clearance of myelin debris. Monocytes/monocyte-derived dendritic cells and MIMS (inset 8). CD68 microglia outnumber CD83 monocyte-derived mature dendritic cells (arrows) at the chronic active lesion edge. AIMS and MIMS (insets 9, 10a, and 10b). In addition to IBA1+/CD68+ microglia, the lesion edge is enriched for inflamed astrocytes (positive for VIM and APOE but negative for IBA1 and CD68), sometimes in close proximity (dashed white box). Compared to activated microglia, inflamed astrocytes are bigger and show radial processes. moDC= mature monocyte-derived dendritic cells; MIMS=microglia inflamed in MS; AIMS=astrocytes inflamed in MS. Scale bar: 20 μm.
Extended Data Fig. 5.
Extended Data Fig. 5.. Pathway analysis of the two MIMS populations and comparison with DAM.
(a–b) Gene enrichment and pathway analysis of the top 100 differentially expressed genes are shown for MIMS-foamy and MIMS-iron populations, separately. Using the gProfileR package, different sources were compared (GO:BP, GO:CC, GO:MF, KEGG). Only significant pathway terms are plotted in the graphs (p-value <0.05, correction methods “g_SCS”). See the text for interpretation. (c) Homeostatic microglia vs. MIMS vs. DAM: direct comparison of two single-cell RNA-seq datasets (MS [current work] and a mouse AD model [5XFAD]). Data for the AD model are derived from Supplementary Table 2 of Keren-Shaul et al., Cell 2017. In each dataset, only significant differentially expressed genes in the comparison between homeostatic vs. MIMS and homeostatic vs. DAM were retained (p<0.001), respectively. Volcano plots report overlapping genes for each microglia phenotype. MS=multiple sclerosis; MIMS=microglia inflamed in MS; AD=Alzheimer disease; DAM=degenerative disease-associated microglia.
Extended Data Fig. 6.
Extended Data Fig. 6.. Two MIMS populations were identified through re-analysis of two published snRNA-seq MS datasets.
(a) snRNA-seq initial mapping (UMAP plot) and annotations based on the top differentially expressed genes in each cluster after re-analysis of raw data from Schirmer et al. and Jäkel et al. (b) Immune cell nuclei were mapped onto our immune subclustering map. Most of the immune cell populations identified were seen also in the other datasets, including the two MIMS populations. UMAP=uniform manifold approximation and projection; MIMS=microglia inflamed in MS.
Extended Data Fig. 7.
Extended Data Fig. 7.. Multiplex immunostaining of human chronic active lesions.
(a) Overview of the multiplex immunostaining method (see the text for details). (b) A representative example of the chronic active edge and myeloid subpopulations. In the magnified view, identification of MIMS-foamy, MIMS-iron, and macrophages using 7 primary antibodies (combined or separate channels). (c) Within the lesion core, most cells (both myeloid cells and astrocytes) are positive for the senescent marker p16INK4a. Separate channels are shown to facilitate the visualization of different markers. (d) Quantification of the proportion of p16-positive nuclei at different locations. The lesion core showed the higher percentage of p16-positive nuclei (ANOVA p<0.0001, Tukey’s multiple comparison post-hoc analysis *p<0.05, **p<0.01, ***p<0.001). Scale bar: 20 μm. Blue: DAPI (nuclei).
Extended Data Fig. 8.
Extended Data Fig. 8.. MIMS-AIMS gene modules and correlation.
(a–b) Hierarchical clustering dendrograms of genes (a) and module colours (b) based on weighted correlation network analysis (WGCNA) of 918 variable genes from immune cells and astrocyte clusters 5, 9, 10. We identified: 2 MIMS gene modules (pink: C1QB, CD74, CEBPD, HLA-DRA, ITM2B, RPS19; black: ACTB, APOE, CD81, EEF1A1, FTH1, FTL, PSAP) and an AIMS gene module (magenta: CALM1, CLU, CRYAB, CST3, GAPDH, GFAP). The complete list of modules is shown in Supplementary Table 9. (c) Heatmap showing the eigengene adjacency matrix that represents the relationships among the identified gene modules. MIMS gene modules (pink and black) were highly correlated with other myeloid gene modules and with the AIMS module, but not with the nonreactive astrocyte module. AST=astrocytes; IMM=immune cells; MIMS=microglia inflamed in MS; AIMS=astrocytes inflamed in MS; ME=module eigengene.
Extended Data Fig. 9.
Extended Data Fig. 9.. Mapping complement and MS susceptibility genes onto the snRNA-seq dataset.
(a) Heatmap showing the expression of genes involved in the classical complement cascade, including complement genes, receptors, and regulators. Z-scores are relative to all cells. Most of these genes map onto immune cell, astrocyte, and vascular cell populations. (b) For each cell population, the number of complement cascade-related genes with Z-score>1.5 is plotted on the UMAP. (c) Heatmaps showing the expression of genes involved in the classical complement cascade for the immune cell (left, pink) and astrocyte (right, green) subclusters. Z-scores are relative to immune cells and astrocytes, respectively. C1Q, C3, and CFD (C3 activator) were expressed mainly by MIMS-iron, whereas negative regulators of complement activation (LAIR1, LAIR2, CR1) were expressed mainly by homeostatic microglia and perivascular macrophages. C1 complex (C1Q, C1R, C1S, C1QBP), C3, C4, and CALR were expressed mainly by AIMS, whereas C2 and C6 were expressed by some other reactive astrocytes. (d) Mapping MS-susceptibility risk genes onto the snRNA-seq dataset: the list of 558 prioritized MS susceptibility genes was obtained from a recent genome-wide association study (GWAS) and mapped onto all three snRNA-seq datasets (the current dataset as well as that of Schirmer et al. and Jäkel et al.). Low-expressed genes (within the 25th percentile average expression) were excluded. MS susceptibility genes were then assigned to clusters if the z-scored average gene expression was >2. Clusters were classified based on the number of MS susceptibility genes (>80, 50–80, 30–50, 1–30 and <10 genes). Results were colour-mapped onto each snRNA-seq UMAP. Most MS susceptibility genes mapped onto the immune and vascular cell clusters. Interestingly, an excitatory neuronal population (“py”) expressed some MS susceptibility genes as well.
Extended Data Fig.10
Extended Data Fig.10. C1q mediates microglia activation in mouse EAE.
Iba1+ cells in microglia-specific C1q cKO with EAE appear less reactive. (a) Visual thalamus was immunostained at PID12-14 for Iba1 (microglia/macrophages) and Clec7a (disease-associated microglia). Yellow arrows denote Iba1+Clec7a+ cells, white arrows Iba1+Clec7a- cells. Scale bar=100μm. (b–c) Clec7a decreased in cKO mice with EAE compared to Ctrl-EAE littermates. The density of Iba1+ cells and Iba1 MFI was attenuated to control values in cKO-EAE mice. *p<0.05, by one-way ANOVA and Tukey’s posthoc test (b) or Kruskal-Wallis test and Dunn posthoc test (c). (d) Iba1+ cells were morphologically characterized into 3 categories (representative images in the panel below the quantification, scale bar=20 μm). Iba1+ cells in cKO-EAE mice were indistinguishable from CFA controls. cKO-EAE showed more ramified Iba1+ cells and fewer amoeboid cells compared to Ctrl-EAE littermates. **p<0.01, ***p<0.001, ****p<0.0001 by two-way ANOVA and Tukey’s posthoc test. Error bars: SEM. Anti-C1q treatment reduces expression of FTL and Iba1 in chronic EAE. (e) Experimental paradigm (twice weekly treatment with isotype control or C1q-blocking antibody (M1.21) from EAE onset until PID42). (f) Representative images of FTL and Iba1 immunostaining; higher magnifications (g–h). White arrows: Iba1+ cells. (i) EAE scores for each treatment arm. (j–k) Quantification of the expression of C1q, FTL, and Iba1 in hippocampal WM (outlined with the dashed line in panel f) and count of Iba1+FTL+ cells. Student t-test, p*≤0.05, ***≤0.001. Error bars: SEM. EAE=experimental autoimmune encephalomyelitis; cKO=conditional knock out; TAM=tamoxifen; FTL=ferritin light chain; MFI= mean fluorescent intensity; PID=post-immunization day; SEM=standard error of the mean.
Fig. 1
Fig. 1. snRNA-seq demonstrates pathological stage- and location-specific population diversity in MS lesions vs. control WM.
(a) 7-tesla susceptibility-weighted MRI showing a chronic active MS lesion with paramagnetic rim (magnified view, inset) of a 38-year-old man with progressive MS. (b) Strategic sampling of MS brain tissue. (c) snRNA-seq clustering of 66,432 nuclei by cell type, labelled based on known lineage markers, and visualized as a UMAP plot. Each dot corresponds to a single nucleus and each colour a cell-type cluster. (d) Dot plot depicting selected differentially expressed genes for each cluster and associated cluster labelling. Dot size corresponds to the percentage of nuclei expressing the gene in each cluster, and the colour represents the average expression level (scale bars). (e) snRNA-seq clustering split by pathological condition. (f) Percentages of different cell populations by pathological condition. Validating our sampling procedure (b), the chronic active lesion edge showed the highest proportion of immune cells. (g–j) Subclustering (UMAP plots) and annotation for each cell population based on differentially expressed genes in each cluster and relative pathway analysis. Violin plots show the distribution of nuclei number for sample by cell type and pathological condition. All subclustered population profiles showed significant differences across MS pathological stages (two way-ANOVA analysis, column factor p<0.05), with MIMS (g), oligodendrocytes (h), and senescent astrocytes (j) surviving the Tukey’s multiple comparison post-hoc analysis (*p<0.05). UMAP: uniform manifold approximation and projection; IMM=immune cells, LYM=lymphocytes; OLIGO=oligodendrocytes; OPC=oligodendrocytes progenitor cells; AST=astrocytes; NEU=neurons; VAS=vascular cells; WM=white matter; mono/moDC=monocytes/dendritic cells; MIMS=microglia inflamed in MS; cl=cluster.
Fig. 2
Fig. 2. Two MIMS clusters at the chronic active lesion edge have divergent effector functions.
(a) Distribution of immune cell clusters in control and MS WM. (b) Selected differentially expressed genes for each cluster. (c) Gene expression changes in the two MIMS clusters. Both upregulated common genes, including TREM2 and APOE (b); however, MIMS-foamy showed relative upregulation of genes involved in lipid phagocytosis/storage, whereas MIMS-iron showed relative upregulation of ferritin, genes involved in antigen presentation, and C1q. p<0.05, two-tailed Student’s t test. (d) Links between prioritized ligands from immune cells (“senders”) and predicted MIMS target genes (“receivers”) in chronic active lesion edge vs. normal WM (NicheNet). A ligand’s regulatory potential is proportional to ribbon thickness. Ribbon colour indicates subcluster of origin for each ligand; ribbons with regulatory potential below the median are shown in light grey. MIMS target genes are most strongly regulated by lymphocytes and MIMS (autocrine regulation). (e) Representative multiplex immunostaining showing a dense myeloid inflammatory infiltrate at the chronic active lesion edge (48-year-old woman with progressive MS, case MS4); scale bar=40 𝜇m). (f) Magnified multiplex immunostaining panel (see box in MBP panel, e) confirming the presence of the two identified MIMS populations by snRNA-seq. (g) Tissue quantification of myeloid cell populations. All subclustered population profiles showed significant differences across MS pathological stages (two way-ANOVA analysis, column factor p<0.001, row factor p<0.001, Tukey’s multiple comparison post-hoc analysis *p<0.05, **p<0.01, ***p<0.001). The ameboid myeloid population (MIMS-iron) identified as IBA1 MHCII CD68 PPARG FTLhigh was significantly prevalent at the chronic active edge. In the demyelinated cortex and periplaque WM, myeloid populations showed prevalently a ramified morphology. (h) Representative multiplex immunostaining panel showing AIMS at the chronic active edge. MIMS=microglia inflamed in MS; AIMS=astrocytes inflamed in MS.
Fig. 3
Fig. 3. MIMS-AIMS anchor the glial interactome, and C1q and C3 are elevated in chronic active WM lesions.
(a) Glial interactome map of the chronic active lesion edge (first 20 significant connections, p<0.05). Each node indicates a cell-type cluster; node size proportional to number of nuclei, connector thickness to Z-scores of the MetaCore interactome output. (b) Correlations among gene modules in immune and astrocyte clusters using WGCNA, retaining only variable genes for chronic active edge vs. control WM; module size <50 genes. Ribbon colour-scale: eigengene adjacency matrix values (highest quartile, dark colour). MIMS and AIMS gene modules are highly correlated. (c) Spatial interaction between MIMS (dashed white arrow) and AIMS (white arrow) in tissue at the chronic active edge. (d) Z-scores (>1.5 relative to all nuclei) for expression of classical complement cascade genes (inner circle) and their regulators (outer circle). C1Q, C3, and CFD were expressed mainly by MIMS-iron, and C1R, C1S, C1QBP, C3, and CALR by AIMS. (e) Upregulation of C1q at the chronic active edge relative to periplaque WM and lesion core (scale bar=40 𝜇m). (f) Quantification of C1q and C3d staining percentage area (430×790μm viewing area) in tissue at different locations (ANOVA p=0.0003 and p=0.0009, respectively; Tukey’s multiple comparison post-hoc analysis *p<0.05, **p<0.01, ***p<0.001); both complement components are highly expressed at the chronic active edge. (g) MRI-genotyping of a cohort of MS patients to assess the cumulative presence of complement risk variants and chronic active lesions (PRL) in vivo. Cases with >4 PRL had more complement-associated risk variants than those with fewer or no PRL (ANOVA p=0.04, Tukey’s multiple comparison test *p=0.035). MIMS=microglia inflamed in MS; AIMS=astrocytes inflamed in MS; WCGNA=weighted correlation network analysis.

Comment in

Similar articles

Cited by

References

    1. Bagnato F, et al. Tracking iron in multiple sclerosis: a combined imaging and histopathological study at 7 Tesla. Brain 134, 3602–3615 (2011). - PMC - PubMed
    1. Absinta M, et al. Persistent 7-tesla phase rim predicts poor outcome in new multiple sclerosis patient lesions. J Clin Invest 126, 2597–2609 (2016). - PMC - PubMed
    1. Dal-Bianco A, et al. Slow expansion of multiple sclerosis iron rim lesions: pathology and 7 T magnetic resonance imaging. Acta Neuropathol 133, 25–42 (2017). - PMC - PubMed
    1. Absinta M, et al. Association of Chronic Active Multiple Sclerosis Lesions With Disability In Vivo. JAMA Neurol 76, 1520 (2019). - PMC - PubMed
    1. Elliott C, et al. Chronic white matter lesion activity predicts clinical progression in primary progressive multiple sclerosis. Brain 142, 2787–2799 (2019). - PMC - PubMed

Publication types

MeSH terms