

The Effect of Ryegrass Silage Feeding on Equine Fecal Microbiota and Blood Metabolite Profile
- PMID: 34497595
- PMCID: PMC8419423
- DOI: 10.3389/fmicb.2021.715709
The Effect of Ryegrass Silage Feeding on Equine Fecal Microbiota and Blood Metabolite Profile
Abstract
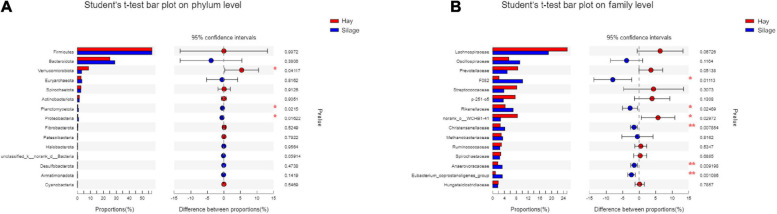
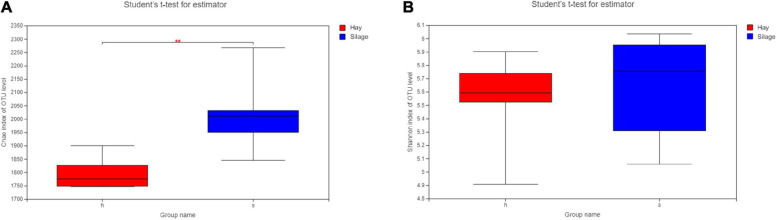
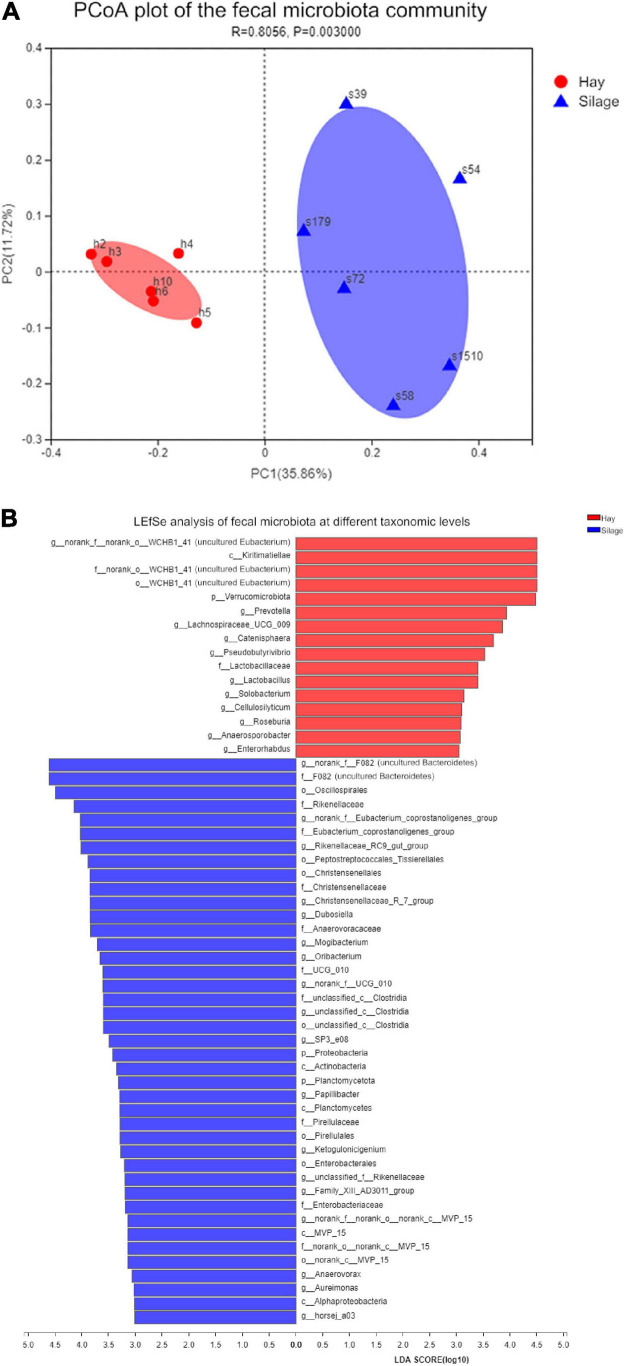
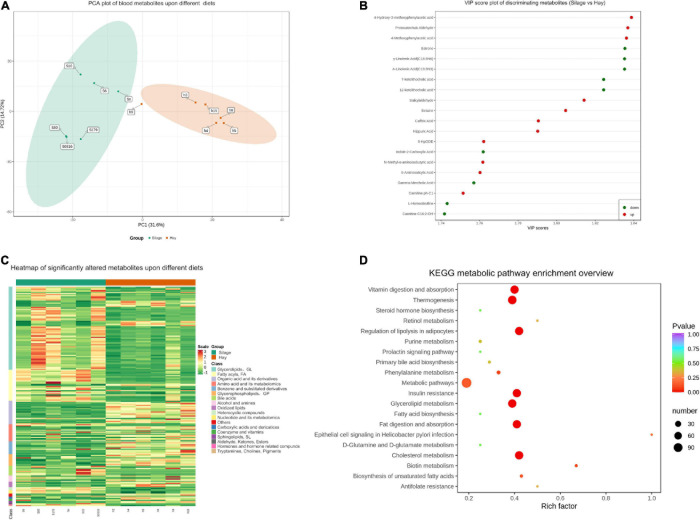
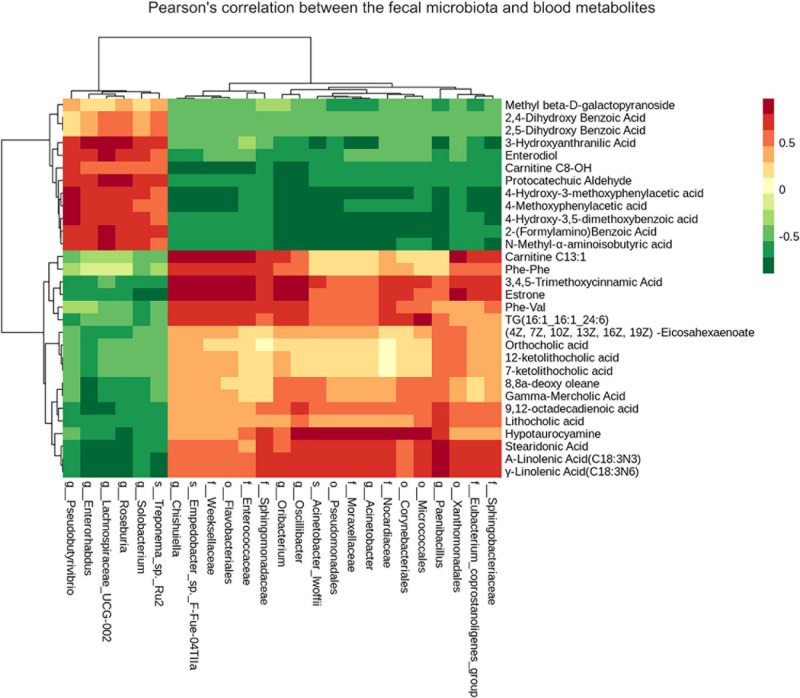
Silage is fed to horses in China and other areas in the world, however, knowledge about the impact of feeding silage on horse health is still limited. In the current study, 12 horses were assigned into two groups and fed ryegrass silage and ryegrass hay, respectively, for 8 weeks. High-throughput sequencing was applied to analyze fecal microbiota, while liquid chromatography-tandem mass spectrometry (LC-MS/MS) based metabolomics technique was used for blood metabolite profile to investigate the influence of feeding ryegrass silage (group S) compared to feeding ryegrass hay (group H) on equine intestinal and systemic health. Horses in group S had significantly different fecal microbiota and blood metabolomes from horses in group H. The results showed that Verrucomicrobia was significantly less abundant which plays important role in maintaining the mucus layer of the hindgut. Rikenellaceae and Christensenellaceae were markedly more abundant in group S and Rikenellaceae may be associated with some gut diseases and obesity. The metabolomics analysis demonstrated that ryegrass silage feeding significantly affected lipid metabolism and insulin resistance in horses, which might be associated with metabolic dysfunction. Furthermore, Pearson's correlation analysis revealed some correlations between bacterial taxa and blood metabolites, which added more evidence to diet-fecal microbiota-health relationship. Overall, ryegrass silage feeding impacted systemic metabolic pathways in horses, especially lipid metabolism. This study provides evidence of effects of feeding ryegrass silage on horses, which may affect fat metabolism and potentially increase risk of insulin resistance. Further investigation will be promoted to provide insight into the relationship of a silage-based diet and equine health.
Keywords: fecal microbiota; hay; horses; metabolome; silage.
Copyright © 2021 Zhu, Wang, Liu, Yi, Zhao, Deng, Holyoak and Li.
Conflict of interest statement
The authors declare that the research was conducted in the absence of any commercial or financial relationships that could be construed as a potential conflict of interest.
Figures
Similar articles
-
Effects of Pasture Grass, Silage, and Hay Diet on Equine Fecal Microbiota.Animals (Basel). 2021 May 7;11(5):1330. doi: 10.3390/ani11051330. Animals (Basel). 2021. PMID: 34066969 Free PMC article.
-
Effects on the equine colon ecosystem of grass silage and haylage diets after an abrupt change from hay.J Anim Sci. 2009 Jul;87(7):2291-8. doi: 10.2527/jas.2008-1461. Epub 2009 Mar 27. J Anim Sci. 2009. PMID: 19329474 Clinical Trial.
-
Variability, stability, and resilience of fecal microbiota in dairy cows fed whole crop corn silage.Appl Microbiol Biotechnol. 2017 Aug;101(16):6355-6364. doi: 10.1007/s00253-017-8348-8. Epub 2017 Jun 10. Appl Microbiol Biotechnol. 2017. PMID: 28601892
-
Effect of Different Dietary Regimes on the Gut Microbiota and Fecal Metabolites of Père David's Deer.Animals (Basel). 2022 Feb 25;12(5):584. doi: 10.3390/ani12050584. Animals (Basel). 2022. PMID: 35268151 Free PMC article.
-
Review: Feeding conserved forage to horses: recent advances and recommendations.Animal. 2017 Jun;11(6):958-967. doi: 10.1017/S1751731116002469. Epub 2016 Nov 24. Animal. 2017. PMID: 27881201 Review.
Cited by
-
Research Progress on Influencing Factors of Gastrointestinal Microbial Diversity in Equine.Vet Med Sci. 2025 May;11(3):e70271. doi: 10.1002/vms3.70271. Vet Med Sci. 2025. PMID: 40145999 Free PMC article. Review.
References
-
- Armstrong C. W., McGregor N. R., Lewis D. P., Butt H. L., Gooley P. R. (2017). The association of fecal microbiota and fecal, blood serum and urine metabolites in myalgic encephalomyelitis/chronic fatigue syndrome. Metabolomics 13:8.
-
- Brandwein M., Katz I., Katz A., Kohen R. (2019). Beyond the gut: skin microbiome compositional changes are associated with bmi. Hum.Microb. J. 13:100063. 10.1016/j.humic.2019.100063 - DOI
Associated data
LinkOut - more resources
Full Text Sources