. 2021 Aug 23:12:714090.
doi: 10.3389/fimmu.2021.714090. eCollection 2021.

Single-Cell Analysis of the Neonatal Immune System Across the Gestational Age Continuum

Affiliations

Single-Cell Analysis of the Neonatal Immune System Across the Gestational Age Continuum

Laura S Peterson et al. Front Immunol. .

Abstract

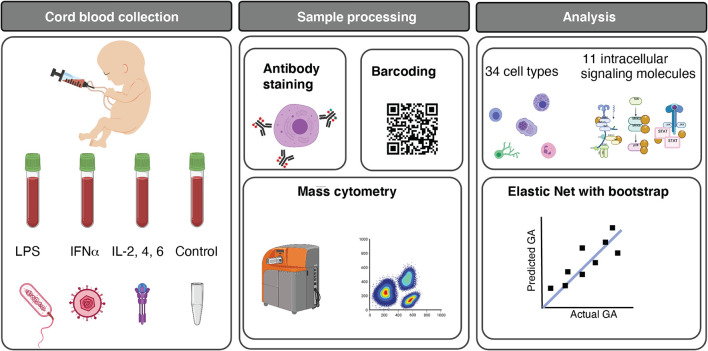
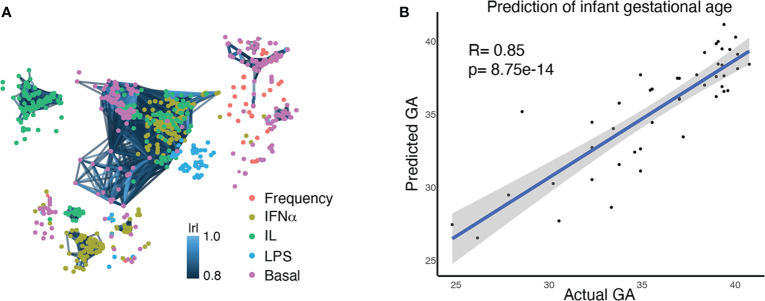
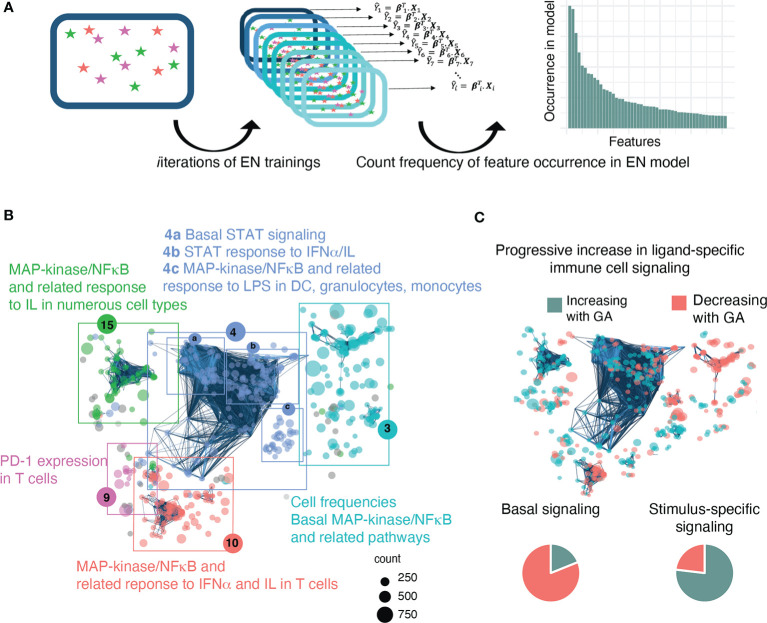
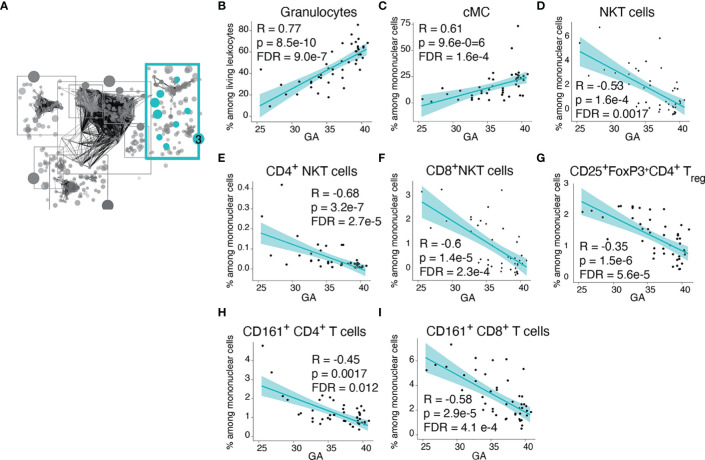
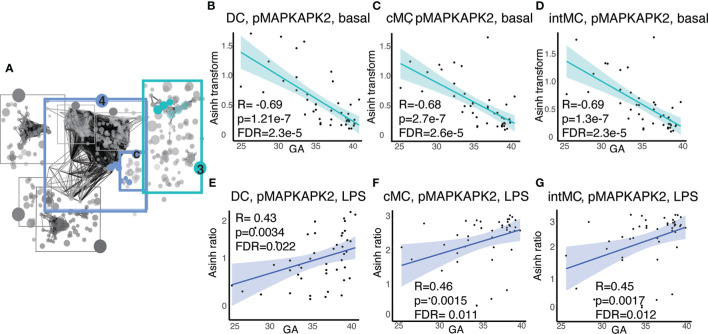
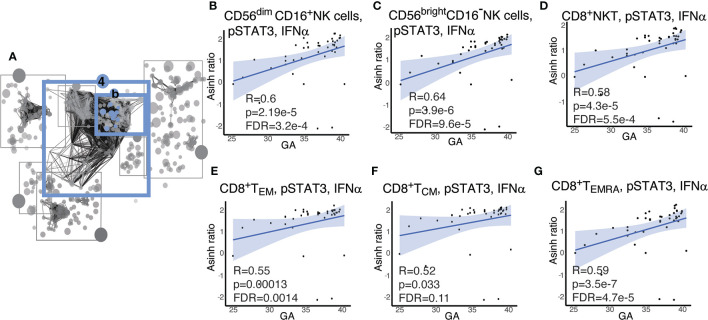
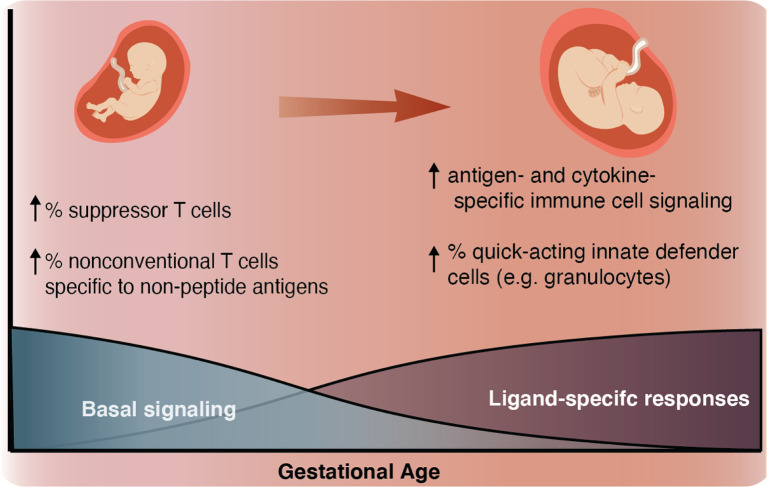
Although most causes of death and morbidity in premature infants are related to immune maladaptation, the premature immune system remains poorly understood. We provide a comprehensive single-cell depiction of the neonatal immune system at birth across the spectrum of viable gestational age (GA), ranging from 25 weeks to term. A mass cytometry immunoassay interrogated all major immune cell subsets, including signaling activity and responsiveness to stimulation. An elastic net model described the relationship between GA and immunome (R=0.85, p=8.75e-14), and unsupervised clustering highlighted previously unrecognized GA-dependent immune dynamics, including decreasing basal MAP-kinase/NFκB signaling in antigen presenting cells; increasing responsiveness of cytotoxic lymphocytes to interferon-α; and decreasing frequency of regulatory and invariant T cells, including NKT-like cells and CD8+CD161+ T cells. Knowledge gained from the analysis of the neonatal immune landscape across GA provides a mechanistic framework to understand the unique susceptibility of preterm infants to both hyper-inflammatory diseases and infections.

Keywords: Neonatal immunology; neonatal NK cells; neonatal T cells; neonatal antigen presenting cells; neonatal cytotoxic cells; prematurity.


Conflict of interest statement

The authors declare that the research was conducted in the absence of any commercial or financial relationships that could be construed as a potential conflict of interest.

Figures

Figure 1
Figure 1
Functional profiling of the neonatal immune system across GA. Experimental and analytical workflow. 45 neonates ranging from 25w2d to 40w6d were studied. Umbilical cord blood was obtained immediately after birth, and whole blood was either left unstimulated (control) or stimulated for 15 minutes with LPS, IFNα, or a cocktail of interleukins (IL) (IL-2, IL-4, and IL-6). Immune cells were barcoded, stained with surface and intracellular antibodies, and analyzed with mass cytometry. The assay produced five categories of immune features, providing information about cell frequency in 34 immune cell subsets, basal intracellular signaling activity (i.e. phosphorylation state) of 11 intracellular signaling proteins in these cells, and cell type-specific signaling capacity in response to one of the three stimuli. 1,071 immune features were analyzed. Multivariate modeling using an Elastic Net method followed by a bootstrap procedure and unsupervised clustering of features were applied to characterize the GA-dependent progression of immune cell features. Image credits: Figure 1 was created in part on BioRender.org.
Figure 2
Figure 2
Multivariate modeling analysis (EN) identifies a correlation between the comprehensive immune profile of an infant at birth and GA at birth. (A) A correlation network of 1,071 immune features, representing the comprehensive immune profile at birth. Each node is an immune feature, consisting of the frequency of an immune cell subset, its baseline signaling activity, or its signaling response to stimulation. Colors indicate the category of immune feature (frequency, basal signaling, or evoked signaling response to IFNα, LPS, or IL). Lines are drawn between features with a correlation coefficient >0.8 (Pearson’s) (B) An Elastic Net analysis created a model that could predict GA based on an infant’s comprehensive immune profile at birth, confirming the close relationship between GA and the immune system.
Figure 3
Figure 3
A bootstrap procedure with agnostic clustering reveals patterns in the immune system that change with advancing GA and suggests a progressive increase in ligand-specific responsiveness of the immune system. (A) Analytical workflow for the bootstrap procedure used to identify immune correlates of GA. Boxes with stars represent a data set, Xi, that can be used for EN training. We ran the EN model 1,000 times on random sub-samples of the data with replacement and then tallied the number of times an individual feature was selected in one of the bootstrap iterations. (B) The 609 immune features identified by the bootstrap procedure are highlighted on the correlation network of immune features and agnostically clustered into immunologically relevant communities, revealing patterns in the immune system that vary with respect to GA. The 5 communities that contain 95% of the features are annotated based on the immunologic trends contained within them (community 4 could be further sub-divided into 4a-c). Node size corresponds to frequency of occurrence of the feature in bootstrap iterations. (C) Comparison of basal vs ligand-specific responses (i.e. after stimulation by LPS, IFNα, or IL) among informative immune features that correlate linearly with GA [false discovery rate (FDR<0.1] shows that most (81.1%) basal signaling features decrease with advancing GA whereas most (76.9%) ligand-specific features increase.
Figure 4
Figure 4
Advancing GA is associated increasing frequency of key defensive innate immune cells and with decreasing frequency of invariant and regulatory T cell subsets. (A) Community 3 contained 164 informative immune features (164 nodes), including frequencies innate and adaptive immune cell subsets. (B–I) Relationship between GA and highlighted features in community 3. The frequency of granulocytes and cMCs increased with GA, while the frequency of NKT-like cells, Treg cells, and CD161-expressing CD4+ and CD8+ T cells decreased with GA. Spearman correlations.
Figure 5
Figure 5
Antigen presenting cell subsets exhibit decreasing basal MAP-kinase/NFκB pathway signaling with GA but increasing signaling responsiveness to LPS. (A) Community 3 contains information on 123 immune features corresponding to the basal signaling of the MAP-kinase/NFκB pathway, and community 4c contains information on 16 immune features corresponding to the response of the same pathway to LPS. (B–D) Highlighted immune features in community 3 show decreasing basal pMAPKAPK2 signaling in antigen presenting cells. (E–G) Highlighted immune features in community 4c show increasing pMAPKAPK2 signaling in response to LPS in the same cells. Spearman correlations.
Figure 6
Figure 6
Cytotoxic cells exhibit increasing pSTAT3 response to IFNα with advancing GA. (A) Community 4b contains information on 67 immune features corresponding to the response of the STAT pathway to IFNα. (B–G) Highlighted immune features in community 4b show increasing responsiveness of pSTAT-3 in cytotoxic cells in response to IFNα. Spearman correlations.
Figure 7
Figure 7
Summary schematic As GA advances, we observed an increase in ligand-specific immune signaling coupled with a decrease in non-specific basal signaling (bottom). As a complement to this change in signaling patterns, we also described an inverse relationship between GA and the prevalence of suppressor-type T cells (Treg cells and possibly CD161+ CD4+ T cells), which have the potential to inhibit antigen-specific inflammation and prevalence of non-conventional innate-like T cells such as NKT-like cells and CD8+CD161+ T cells (classically associated with MAIT cells) (top left). As GA advances the proportion of these inhibitory and non-conventional T cells decreases, the responsiveness of both innate and adaptive cells to antigen (LPS) and cytokine (IFNα and IL-2, IL-4, and IL-6) stimulation increases, and the population of quick-acting innate defender cells increases (top right).

References

    1. Bryce J, Daelmans B, Dwivedi A, Fauveau V, Lawn JE, Mason E, et al. . Countdown to 2015 for Maternal, Newborn, and Child Survival: The 2008 Report on Tracking Coverage of Interventions. Lancet (2008) 371:1247–58. 10.1016/S0140-6736(08)60559-0 - DOI - PubMed
    1. Anderson JG, Baer RJ, Partridge JC, Kuppermann M, Franck LS, Rand L, et al. . Survival and Major Morbidity of Extremely Preterm Infants: A Population-Based Study. Pediatrics (2016) 138:e20154434. 10.1542/peds.2015-4434 - DOI - PubMed
    1. O’Shea TM, Allred EN, Dammann O, Hirtz D, Kuban KCK, Paneth N, et al. . The ELGAN Study of the Brain and Related Disorders in Extremely Low Gestational Age Newborns. Early Hum Dev (2009) 85:719–25. 10.1016/j.earlhumdev.2009.08.060 - DOI - PMC - PubMed
    1. Mϋller MJ, Paul T, Seeliger S. Necrotizing Enterocolitis in Premature Infants and Newborns. J Neonatal-Perinat Med (2016) 9:233–42. 10.3233/NPM-16915130 - DOI - PubMed
    1. Steinkuller PG, Du L, Gilbert C, Foster A, Collins ML, Coats DK. Childhood Blindness. J AAPOS Off Publ Am Assoc Pediatr Ophthalmol Strabismus (1999) 3:26–32. 10.1016/s1091-8531(99)70091-1 - DOI - PubMed

Publication types