

Biochar-Enhanced Resistance to Botrytis cinerea in Strawberry Fruits (But Not Leaves) Is Associated With Changes in the Rhizosphere Microbiome
- PMID: 34497619
- PMCID: PMC8419269
- DOI: 10.3389/fpls.2021.700479
Biochar-Enhanced Resistance to Botrytis cinerea in Strawberry Fruits (But Not Leaves) Is Associated With Changes in the Rhizosphere Microbiome
Abstract
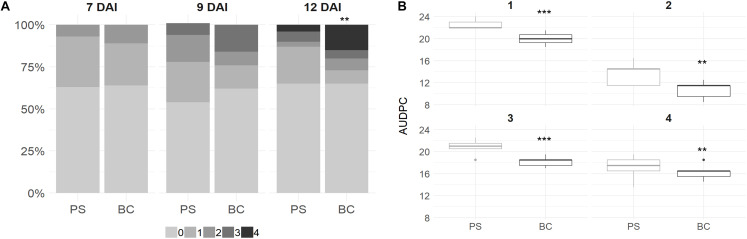
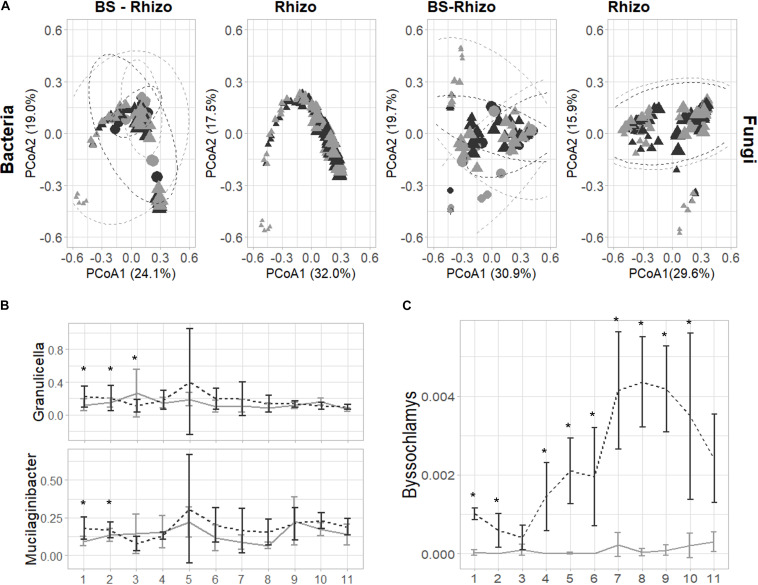
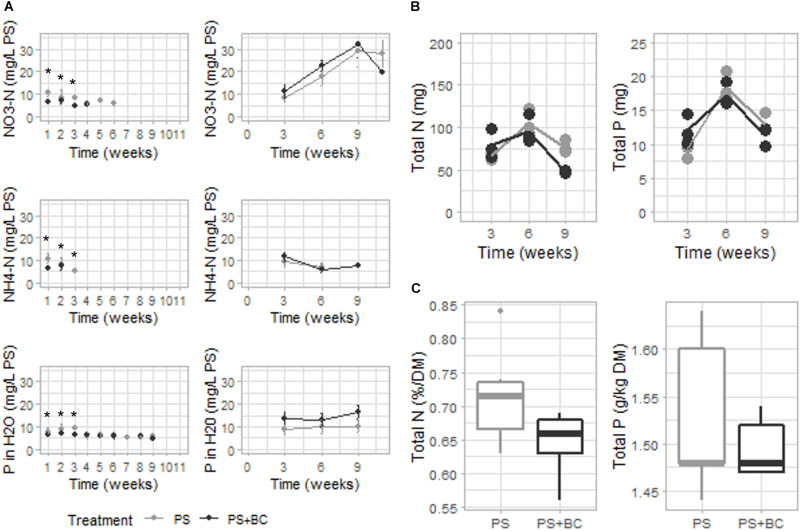
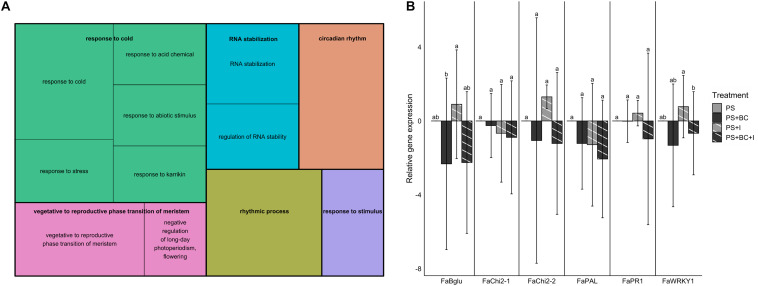
Biochar has been reported to play a positive role in disease suppression against airborne pathogens in plants. The mechanisms behind this positive trait are not well-understood. In this study, we hypothesized that the attraction of plant growth-promoting rhizobacteria (PGPR) or fungi (PGPF) underlies the mechanism of biochar in plant protection. The attraction of PGPR and PGPF may either activate the innate immune system of plants or help the plants with nutrient uptake. We studied the effect of biochar in peat substrate (PS) on the susceptibility of strawberry, both on leaves and fruits, against the airborne fungal pathogen Botrytis cinerea. Biochar had a positive impact on the resistance of strawberry fruits but not the plant leaves. On leaves, the infection was more severe compared with plants without biochar in the PS. The different effects on fruits and plant leaves may indicate a trade-off between plant parts. Future studies should focus on monitoring gene expression and metabolites of strawberry fruits to investigate this potential trade-off effect. A change in the microbial community in the rhizosphere was also observed, with increased fungal diversity and higher abundances of amplicon sequence variants classified into Granulicella, Mucilaginibacter, and Byssochlamys surrounding the plant root, where the latter two were reported as biocontrol agents. The change in the microbial community was not correlated with a change in nutrient uptake by the plant in either the leaves or the fruits. A decrease in the defense gene expression in the leaves was observed. In conclusion, the decreased infection of B. cinerea in strawberry fruits mediated by the addition of biochar in the PS is most likely regulated by the changes in the microbial community.
Keywords: RNA sequencing; biochar; metabarcoding; microbiome; plant defense; strawberry.
Copyright © 2021 De Tender, Vandecasteele, Verstraeten, Ommeslag, Kyndt and Debode.
Conflict of interest statement
The authors declare that the research was conducted in the absence of any commercial or financial relationships that could be construed as a potential conflict of interest.
Figures
Similar articles
-
Dynamics in the Strawberry Rhizosphere Microbiome in Response to Biochar and Botrytis cinerea Leaf Infection.Front Microbiol. 2016 Dec 22;7:2062. doi: 10.3389/fmicb.2016.02062. eCollection 2016. Front Microbiol. 2016. PMID: 28066380 Free PMC article.
-
Strawberry FaWRKY25 Transcription Factor Negatively Regulated the Resistance of Strawberry Fruits to Botrytis cinerea.Genes (Basel). 2020 Dec 31;12(1):56. doi: 10.3390/genes12010056. Genes (Basel). 2020. PMID: 33396436 Free PMC article.
-
Chitin in Strawberry Cultivation: Foliar Growth and Defense Response Promotion, but Reduced Fruit Yield and Disease Resistance by Nutrient Imbalances.Mol Plant Microbe Interact. 2021 Mar;34(3):227-239. doi: 10.1094/MPMI-08-20-0223-R. Epub 2021 Mar 3. Mol Plant Microbe Interact. 2021. PMID: 33135964
-
Agroecological Management of the Grey Mould Fungus Botrytis cinerea by Plant Growth-Promoting Bacteria.Plants (Basel). 2023 Feb 1;12(3):637. doi: 10.3390/plants12030637. Plants (Basel). 2023. PMID: 36771719 Free PMC article. Review.
-
Communication of plants with microbial world: Exploring the regulatory networks for PGPR mediated defense signaling.Microbiol Res. 2020 Sep;238:126486. doi: 10.1016/j.micres.2020.126486. Epub 2020 May 1. Microbiol Res. 2020. PMID: 32464574 Review.
Cited by
-
Strawberry Biostimulation: From Mechanisms of Action to Plant Growth and Fruit Quality.Plants (Basel). 2022 Dec 10;11(24):3463. doi: 10.3390/plants11243463. Plants (Basel). 2022. PMID: 36559576 Free PMC article. Review.
-
Genotype, mycorrhizae, and herbivory interact to shape strawberry plant functional traits.Front Plant Sci. 2022 Oct 26;13:964941. doi: 10.3389/fpls.2022.964941. eCollection 2022. Front Plant Sci. 2022. PMID: 36388560 Free PMC article.
-
Biochar stimulates tomato roots to recruit a bacterial assemblage contributing to disease resistance against Fusarium wilt.Imeta. 2022 Jun 23;1(3):e37. doi: 10.1002/imt2.37. eCollection 2022 Sep. Imeta. 2022. PMID: 38868709 Free PMC article.
-
Secondary Metabolites and Their Role in Strawberry Defense.Plants (Basel). 2023 Sep 12;12(18):3240. doi: 10.3390/plants12183240. Plants (Basel). 2023. PMID: 37765404 Free PMC article. Review.
-
From trade-off to synergy: microbial insights into enhancing plant growth and immunity.Plant Biotechnol J. 2024 Sep;22(9):2461-2471. doi: 10.1111/pbi.14360. Epub 2024 May 12. Plant Biotechnol J. 2024. PMID: 38735054 Free PMC article. Review.
References
-
- Agrios N. G. (2005). Plant Pathology, 5th ed., United States. Cambridge, MA: Elsevier-Academic Press.
-
- Amery F., Debode J., Ommeslag S., Visser R., De Tender C., Vandecasteele B. (2021). Biochar for circular horticulture: feedstock related effects in soilless cultivation. Agronomy 11:629. 10.3390/agronomy11040629 - DOI
-
- Bateman D., Basham H. (1976). “Degradation of plant cell walls and membranes by microbial enzymes,” in Physiological plant pathology, eds Heitefub R., Williams P. (Berlin: Springer; ), 316–355. 10.1007/978-3-642-66279-9_13 - DOI
LinkOut - more resources
Full Text Sources
Molecular Biology Databases