. 2021 Aug 23:11:723481.
doi: 10.3389/fcimb.2021.723481. eCollection 2021.

Dual RNASeq Reveals NTHi-Macrophage Transcriptomic Changes During Intracellular Persistence

Affiliations

Dual RNASeq Reveals NTHi-Macrophage Transcriptomic Changes During Intracellular Persistence

Jodie Ackland et al. Front Cell Infect Microbiol. .

Abstract

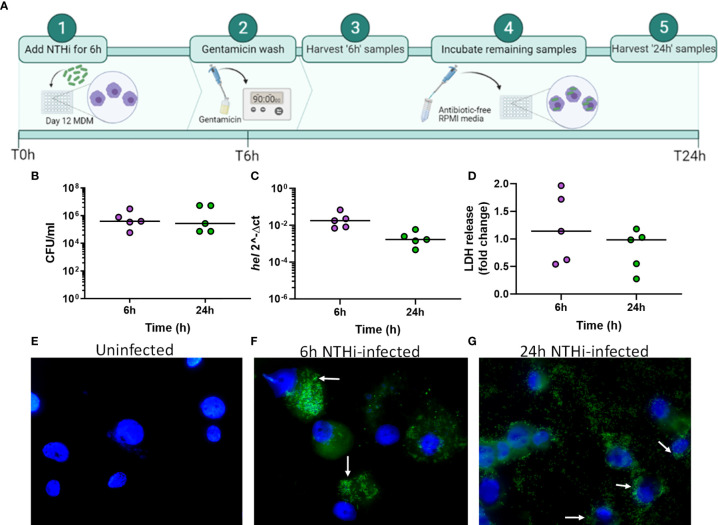
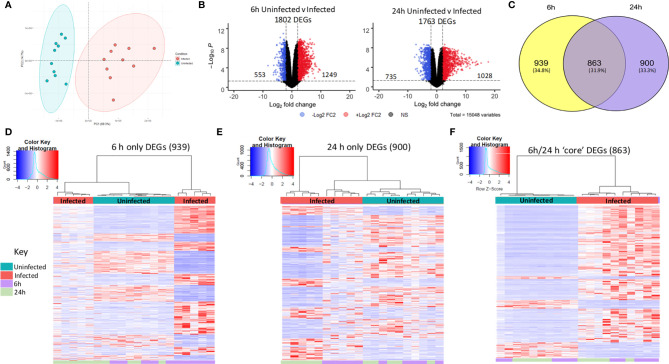
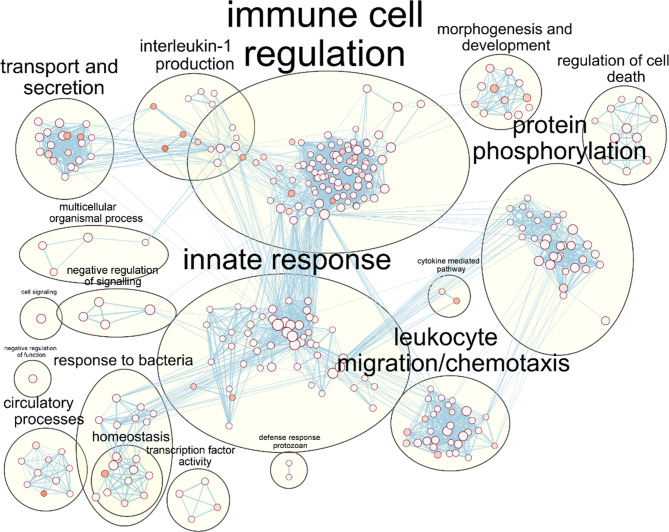
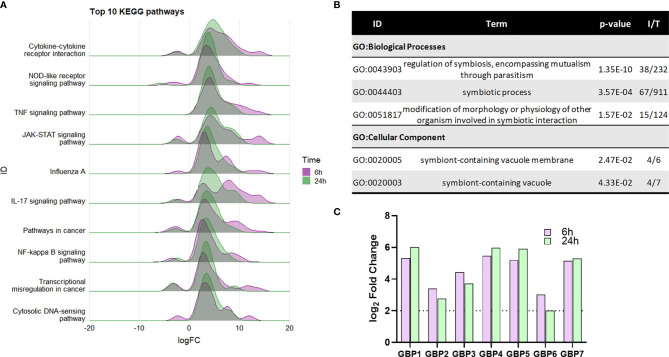
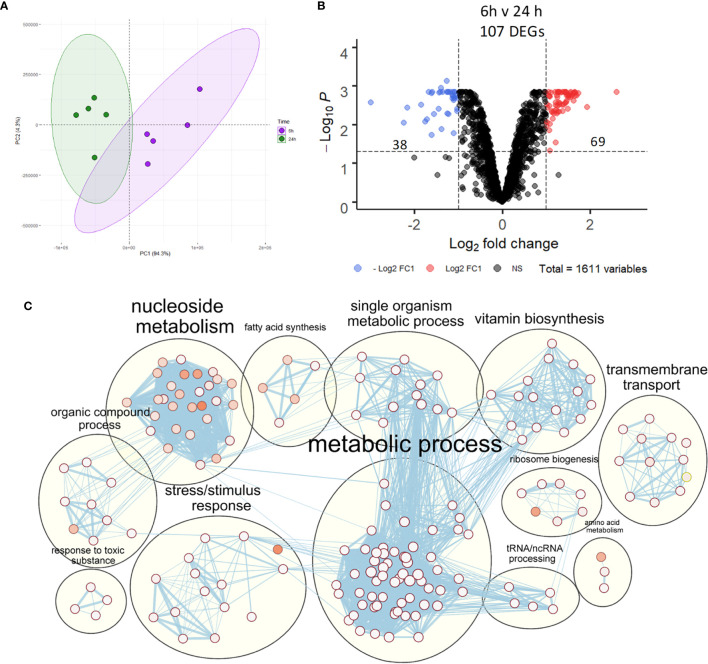
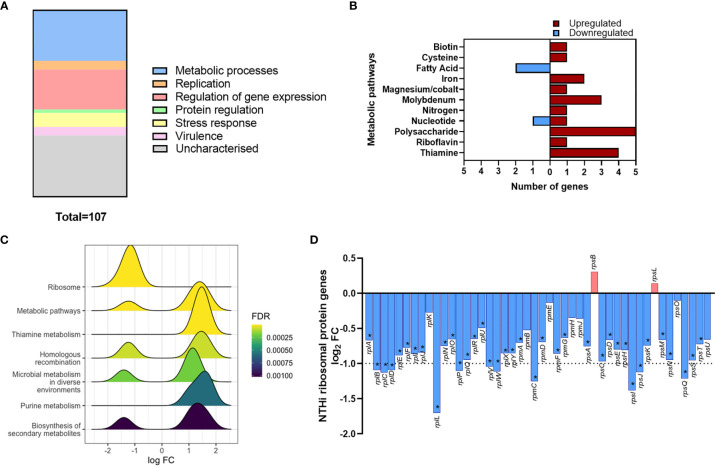
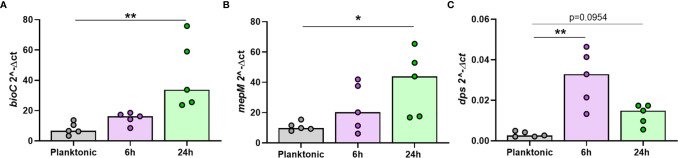
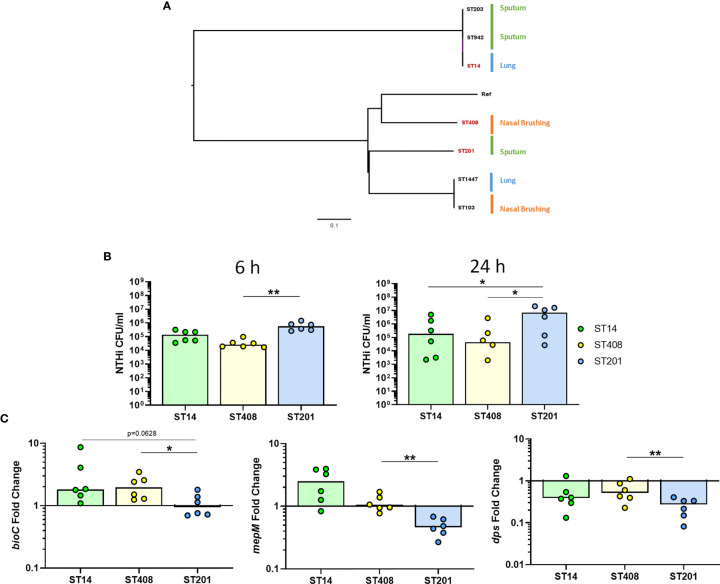
Nontypeable Haemophilus influenzae (NTHi) is a pathobiont which chronically colonises the airway of individuals with chronic respiratory disease and is associated with poor clinical outcomes. It is unclear how NTHi persists in the airway, however accumulating evidence suggests that NTHi can invade and persist within macrophages. To better understand the mechanisms of NTHi persistence within macrophages, we developed an in vitro model of NTHi intracellular persistence using human monocyte-derived macrophages (MDM). Dual RNA Sequencing was used to assess MDM and NTHi transcriptomic regulation occurring simultaneously during NTHi persistence. Analysis of the macrophage response to NTHi identified temporally regulated transcriptomic profiles, with a specific 'core' profile displaying conserved expression of genes across time points. Gene list enrichment analysis identified enrichment of immune responses in the core gene set, with KEGG pathway analysis revealing specific enrichment of intracellular immune response pathways. NTHi persistence was facilitated by modulation of bacterial metabolic, stress response and ribosome pathways. Levels of NTHi genes bioC, mepM and dps were differentially expressed by intracellular NTHi compared to planktonic NTHi, indicating that the transcriptomic adaption was distinct between the two different NTHi lifestyles. Overall, this study provides crucial insights into the transcriptomic adaptations facilitating NTHi persistence within macrophages. Targeting these reported pathways with novel therapeutics to reduce NTHi burden in the airway could be an effective treatment strategy given the current antimicrobial resistance crisis and lack of NTHi vaccines.

Keywords: NTHi; dual RNAseq; host-pathogen interactions; intracellular persistence; macrophage.


Conflict of interest statement

DC reports that he was a post-doctoral researcher on projects funded by Pfizer and GSK between April 2014 and October 2017. TW reports grants and personal fees from AstraZeneca, personal fees and other from MMH, grants and personal fees from GSK, personal fees from BI, and grants and personal fees from Synairgen, outside the submitted work. KS reports grants from AstraZeneca, outside the submitted work. The remaining authors declare that the research was conducted in the absence of any commercial or financial relationships that could be construed as a potential conflict of interest.

Figures

Figure 1
Figure 1
Modelling NTHi infection of macrophages. (A) Model workflow: MDM were challenged with NTHi for 6 h, washed with gentamicin for 90 min to remove extracellular NTHi and left to incubate in antibiotic-free media until 24 h (created using BioRender.com). (B) The 6 h and 24 h time point MDM samples were lysed and plated to quantify the amount of NTHi associated with MDM. (C) RNA was harvested from the 6 h and 24 h uninfected and NTHi-infected MDM samples to assess the presence of NTHi RNA through detection of the hel gene by qPCR. Expression of the hel gene was normalised to B2M. (D) MDM viability was not impacted by NTHi ST14 infection, as assessed by LDH release into cell culture supernatants at 6 h and 24 h. (B–D) (n = 5) show paired data and lines indicate medians. Data were analysed by Wilcoxon signed-rank test and no statistical significance was determined. GFP-NTHi was used to visually confirm NTHi association with MDM at the 6 h and 24 h time points. Uninfected and NTHi-infected MDM were streaked and fixed onto glass sides followed by staining with DAPI. Slides were visualised using the AxioScope KS400 fluorescence microscope at 100x magnification. (E) Uninfected MDM, (F) GFP-NTHi infected MDM at the 6 h time point and (G) GFP-NTHi infected MDM at the 24 h time point. White arrows indicate NTHi associated with MDM cell nuclei.
Figure 2
Figure 2
Distinct macrophage transcriptomic profiles in response to NTHi persistence. (A) Principal component analysis of the MDM data set identified that samples clustered based on infection status, with uninfected samples in blue and NTHi infected samples in red. (B) Differential gene expression analysis found 1802 MDM DEGs at the 6 h time point (left) and 1763 MDM DEGs at 24 h time point (right) (log2 FC2 cut off, FDR p < 0.05). (C) Venn diagram showing the regulation of MDM DEGs in a time-dependent manner, with 939 genes only differentially expressed at 6 h, 900 genes only differentially expressed at 24 h and 863 genes differentially expressed across both 6 h and 24 h. Heatmap visualisation of the gene expression profiles indicate time-dependent clustering of samples. (D) Clustering of samples based on the expression profile of the MDM DEGs at the 6 h time point only show clustering of the 6 h time point sample away from uninfected samples at both time points, as well as the NTHi infected 24 h time point samples. (E) Similarly, the NTHi infected samples harvested at the 24 h time point cluster away from all uninfected and 6 h infected samples. (F) In contrast, based on the expression of the 863 ‘core’ DEGs, the NTHi-infected samples clustered together separately away from the uninfected samples, with no sub clustering based on time point. Clustering was performed using Euclidean distance and Ward linkage methods. Heatmap colour key indicates sample metadata; blue = uninfected samples, red = infected samples, purple = 6 h time point samples and green = 24 h time point samples.
Figure 3
Figure 3
Enrichment of macrophage immune responses during NTHi persistence. Enrichment analysis using ToppFunn identified over 500 significantly enriched biological processes which were clustered using EnrichmentMap and AutoAnnotate in Cytoscape to identify the key biological processes involved in the MDM response to NTHi. Nodes represent individual GO:terms, with size relating to the number of genes in each term and the colour indicating enrichment significance. Edges represent connections between nodes that share genes.
Figure 4
Figure 4
Enrichment of macrophage intracellular immune responses during NTHi persistence. (A) KEGG pathway analysis identified a number of enriched immune processes, with a number of pathways indicating a response to an intracellular pathogen. The genes assigned to each process were more highly upregulated at both 6 h (purple) and 24 h (green). Pathway/category IDs are ordered by enrichment significance (FDR). (B) Significantly enriched GO terms in the Biological Process and Cellular Component categories relating to host-pathogen symbiosis for the 863 core genes differentially expressed at 6 h and 24 h (log2 FC ± 2, FDR p < 0.05). P-value indicates the enrichment FDR, I = input number of genes, T= total number of genes in annotation. (C) MDM upregulation of guanylate-binding proteins (GBPs) 1-7 involved in host response to intracellular pathogens. Purple bar = 6 h, green bar = 24 h. Dotted line indicates log2 FC2 cut off. All genes were statistically significantly upregulated at both time points (FDR p < 0.05).
Figure 5
Figure 5
NTHi transcriptomic regulation during adaptation to intracellular persistence. (A) Principal component analysis identified clustering of NTHi samples based on time point (6 h time point samples in purple and 24 h time point samples in green). (B) Differential gene expression analysis identified 107 NTHi DEGs at 24 h (log2 FC1 cut off, FDR p < 0.05). (C) Clustering of the enriched Biological Process GO:terms performed using EnrichmentMap and AutoAnnotate in Cytoscape found enrichment of numerous metabolic processes. Nodes represent individual GO:terms, with size relating to the number of genes in each term and the colour indicating enrichment significance. Edges represent connections between nodes that share genes.
Figure 6
Figure 6
Modulation of NTHi processes during adaption to intracellular persistence. (A) The stacked bar chart highlights the main processes that the 108 NTHi DEGs are involved in. The process with the highest number of genes was metabolic processes (29), followed by regulation of gene expression (23), stress responses (8), virulence (5), replication (5) and protein regulation (2). The remaining genes (36) were uncharacterised (hypothetical, novel genes or sRNA). (B) Genes involved in bacterial metabolism were assigned to specific alternate metabolic pathways. Red = upregulated, blue = downregulated. (C) KEGG pathway analysis identified enrichment of KEGG pathways during intracellular persistence, ordered by enrichment significance (FDR). (D) KEGG pathway analysis identified the most significantly enriched pathway was ‘Ribosome’. Exploration of ribosomal protein gene expression identified global downregulation of NTHi ribosomal protein genes during infection. Bar chart shows log2 FC values of the 46 ribosomal protein genes detected in the NTHi data set. Dotted line indicates log2 FC1 cut off, with asterisk indicating genes (37) that were determined to be significantly differentially expressed at FDR p < 0.05.
Figure 7
Figure 7
The top regulated NTHi genes during intracellular persistence were differentially expressed compared to planktonic NTHi. To compare gene expression between planktonic and intracellular, persisting NTHi, RNA was harvested from NTHi ST14 grown in culture media alone (regarded as planktonic NTHi) or from NTHi-infected MDM at the 6 h and 24 h time points, as previously described (n = 5). The expression of the top regulated NTHi genes (A) bioC, (B) mepM and (C) dps was assessed by qPCR. Gene expression was normalised to NTHi rho gene. Graphs show unpaired data and lines indicate medians. N = 5. Data were analysed using a Kruskal-Wallis test with Dunn’s multiple comparisons; *p < 0.05, **p < 0.01.
Figure 8
Figure 8
Strain-dependent differences during NTHi persistence. (A) The diversity of seven clinical NTHi isolates were assessed by ParSNP using default parameters and NTHi 86-028NP as the reference strain. Strains were isolated from either from sputum sample (green), nasal brushing (orange) or protected bronchial brushes of the lung (blue). Phylogenetic tree was created in FigTree using ParSNP output files and strains highlighted in red (ST14, ST408 and ST201) indicate the strains chosen for further in vitro experimental analysis. (B) Invasion and persistence within MDM by the three chosen different strains of NTHi was measured by live viable counting at the 6 h and 24 h time points. (C) Expression of the top regulated NTHi genes were differentially expressed by additional clinical strains of NTHi during intracellular persistence. Gene expression was normalised to NTHi rho gene and data are shown as fold change in expression from 6 h to 24 h Graphs show paired data and lines indicate medians. N = 6. Data were analysed using Friedman test with Dunn’s multiple comparisons; *p < 0.05, **p < 0.01.

Similar articles

Cited by

References

    1. Ahearn C. P., Gallo M. C., Murphy T. F. (2017). Insights on Persistent Airway Infection by Non-Typeable Haemophilus Influenzae in Chronic Obstructive Pulmonary Disease. Pathog. Dis. 75 (4), 1–18. 10.1093/femspd/ftx042 - DOI - PMC - PubMed
    1. Ahrén I. L., Williams D. L., Rice P. J., Forsgren A., Riesbeck K. (2001). The Importance of a β-Glucan Receptor in the Nonopsonic Entry of Nontypeable Haemophilus Influenzae Into Human Monocytic and Epithelial Cells. J. Infect. Dis. 184 (2), 150–158. 10.1086/322016 - DOI - PubMed
    1. Akagawa K. S., Komuro I., Kanazawa H., Yamazaki T., Mochida K., Kishi F. (2006). Functional Heterogeneity of Colony-Stimulating Factor-Induced Human Monocyte-Derived Macrophages. Respirology 11 (Suppl. 1), 27–34. 10.1111/j.1440-1843.2006.00805.x - DOI - PubMed
    1. Anders S., Huber W. (2010). Differential Expression Analysis for Sequence Count Data. Genome Biol. 11 (10), R106. 10.1186/gb-2010-11-10-r106 - DOI - PMC - PubMed
    1. Anders S., Pyl P. T., Huber W. (2015). HTSeq-A Python Framework to Work With High-Throughput Sequencing Data. Bioinformatics 31 (2), 166–169. 10.1093/bioinformatics/btu638 - DOI - PMC - PubMed

Publication types