. 2021 Aug 23;6(34):22137-22150.
doi: 10.1021/acsomega.1c02763. eCollection 2021 Aug 31.

Optical Studies on the Phase Transitions in YBaMn2O6 Single Crystals

Affiliations

Optical Studies on the Phase Transitions in YBaMn2O6 Single Crystals

Rea Divina Mero et al. ACS Omega. .

Abstract

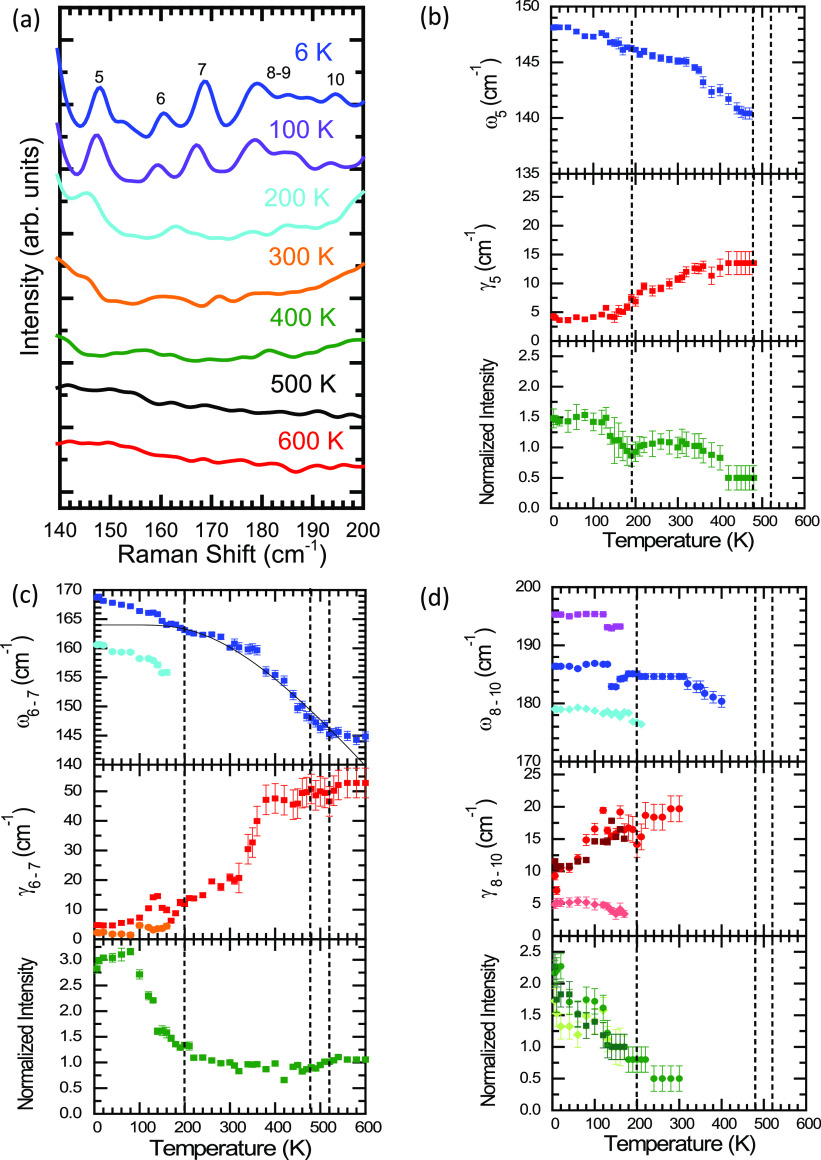
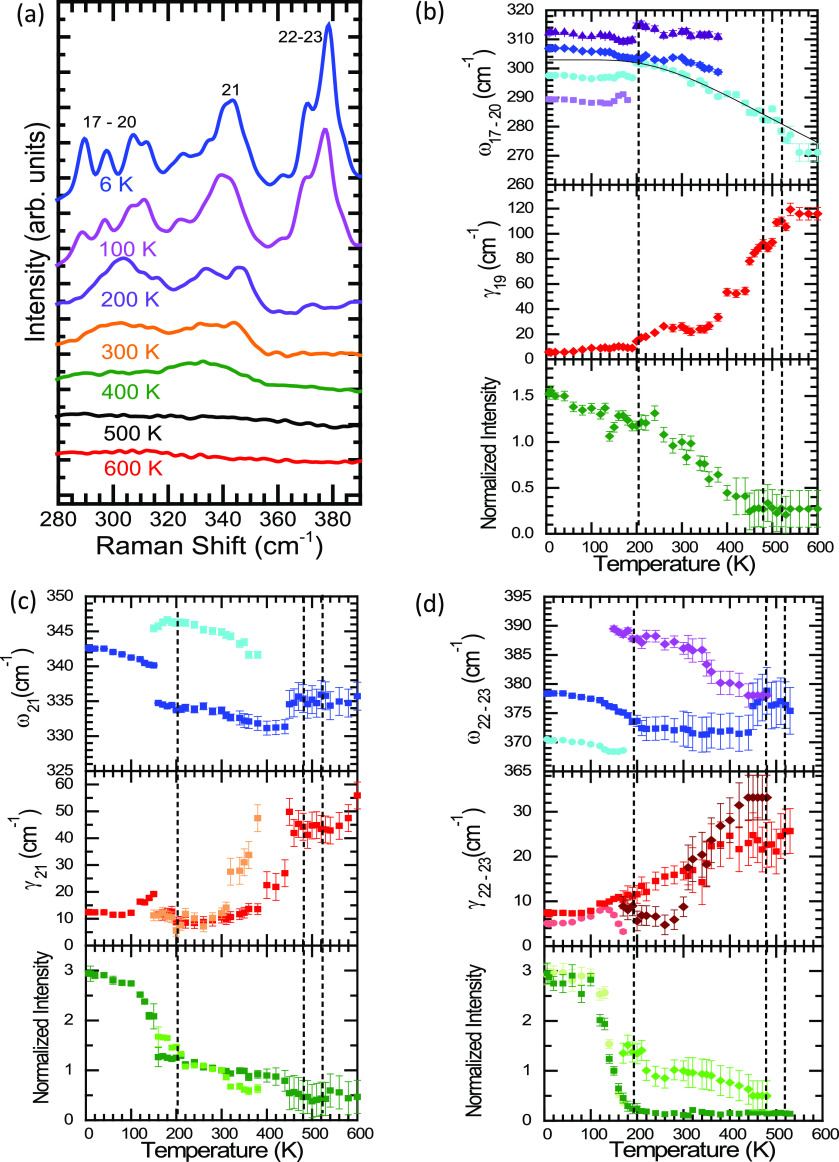
The double perovskite YBaMn2O6 exhibited complex structural, magnetic, and charge/orbital ordering phase transitions. In this paper, we investigated the correlation between the temperature-dependent optical response and complex phase transitions of YBaMn2O6 single crystals through spectroscopic ellipsometry and Raman scattering spectroscopy. The room temperature optical absorption spectrum of YBaMn2O6 revealed three bands of approximately 1.50, 4.05, and 5.49 eV. The lowest optical absorption band was assigned to on-site d-d transitions in Mn ions, whereas the other two optical features were assigned to charge-transfer transitions between the 2p states of O and 3d states of Mn. The room temperature Raman scattering spectrum revealed 25 phonon modes. Notably, the MnO6 octahedral tilting and bending modes between 360 and 440 cm-1 increased in intensity at temperatures <200 K. Furthermore, several new phonon peaks appeared at temperatures <200 K, which were associated with charge ordering. Additionally, the magnetic order-induced changes were observed in the breathing modes, with reduced intensity of the 620 cm-1 and a substantial enhancement of the 644 cm-1 phonon peaks. The Jahn-Teller mode at approximately 496 cm-1 exhibited strong hardening at temperatures <200 K, which indicated a linear correlation with the square of the magnetic susceptibility and thus revealed the occurrence of spin-phonon coupling. Anomalies in the phonon frequency, line width, and intensity observed near the phase transition temperatures highlighted the importance of lattice-charge-spin interactions in YBaMn2O6.


Conflict of interest statement

The authors declare no competing financial interest.

Figures

Figure 1
Figure 1
Crystal structure of YBaMn2O6 at room temperature and a schematic depicting the electric, structural, and magnetic properties of YBaMn2O6.
Figure 2
Figure 2
Room temperature optical absorption spectra of YBaMn2O6 and NdBaMn2O6. The dashed lines denote the optimal fit of YBaMn2O6 using the Lorentzian model. The inset illustrates the R-site atomic radii dependence of on-site d–d transitions in Mn ions. The plot for NdBaMn2O6 is adapted from ref (13). No subject to Copyright.
Figure 3
Figure 3
Room temperature polarized Raman scattering spectra and the optical image of YBaMn2O6. The notations used for the crystallographic directions are also given.
Figure 4
Figure 4
Temperature dependence of the unpolarized Raman scattering spectra of YBaMn2O6. The inset illustrates the results of fitting the spectrum obtained at 6 K by using the Lorentzian model.
Figure 5
Figure 5
(a) Temperature dependence of the unpolarized Raman scattering spectra of YBaMn2O6 for frequencies between 100 and 160 cm–1. The temperature dependence of frequency, line width, and normalized intensity of (b) ω1–2, (c) ω3, and (d) ω4 modes. The vertical dashed lines denote the phase transition temperatures at 200, 480, and 520 K. The thin solid line is the fitting results obtained with the anharmonic model.
Figure 6
Figure 6
(a) Temperature dependence of the unpolarized Raman scattering spectra of YBaMn2O6 for frequencies between 140 and 200 cm–1. The temperature dependence of frequency, line width, and normalized intensity of (b) ω5, (c) ω6–7, and (d) ω8–10 modes. The vertical dashed lines denote the phase transition temperatures at 200, 480, and 520 K. The thin solid line is the fitting results obtained with the anharmonic model.
Figure 7
Figure 7
(a) Temperature dependence of the unpolarized Raman scattering spectra of YBaMn2O6 for frequencies between 180 and 280 cm–1. The temperature dependence of frequency, line width, and normalized intensity of (b) ω11–14, (c) ω15, and (d) ω16 modes. The vertical dashed lines denote the phase transition temperatures at 200, 480, and 520 K. The thin solid line is the fitting results obtained with the anharmonic model.
Figure 8
Figure 8
(a) Temperature dependence of the unpolarized Raman scattering spectra of YBaMn2O6 for frequencies between 280 and 390 cm–1. The temperature dependence of frequency, line width, and normalized intensity of (b) ω11–14, (c) ω15, and (d) ω16 modes. The vertical dashed lines denote the phase transition temperatures at 200, 480, and 520 K. The thin solid line is the fitting results obtained with the anharmonic model.
Figure 9
Figure 9
(a) Temperature dependence of the unpolarized Raman scattering spectra of YBaMn2O6 for frequencies between 390 and 490 cm–1. The temperature dependence of frequency, line width, and normalized intensity of (b) ω24–25 and (c) ω27–29 modes. The vertical dashed lines denote the phase transition temperatures at 200, 480, and 520 K. The thin solid line is the fitting results obtained with the anharmonic model.
Figure 10
Figure 10
(a) Temperature dependence of the unpolarized Raman scattering spectra of YBaMn2O6 for frequencies between 500 and 700 cm–1. The inset of (a) illustrates the Jahn–Teller and the breathing modes at 400 and 500 K. The temperature dependence of frequency, line width, and normalized intensity of (b) ω30–31 and (c) ω34–35 modes. The vertical dashed lines denote the phase transition temperatures at 200, 480, and 520 K.
Figure 11
Figure 11
Square of the magnetic susceptibility of YBaMn2O6 plotted against the phonon renormalization of the Jahn–Teller mode at temperatures <200 K.
Figure 12
Figure 12
Temperature-dependent magnetic susceptibility of the YBaMn2O6 single crystal.

Similar articles

References

    1. Akahoshi D.; Uchida M.; Tomioka Y.; Arima T.; Matsui Y.; Tokura Y. Random potential effect near the bicritical region in perovskite manganites as revealed by comparison with the ordered perovskite analogs. Phys. Rev. Lett. 2003, 90, 17720310.1103/PhysRevLett.90.177203. - DOI - PubMed
    1. Akahoshi D.; Okimoto Y.; Kubota M.; Kumai R.; Arima T.; Tomioka Y.; Tokura Y. Charge-orbital ordering near the multicritical point in A-site ordered perovskites SmBaMn2O6 and NdBaMn2O6. Phys. Rev. B: Condens. Matter Mater. Phys. 2004, 70, 06441810.1103/PhysRevB.70.064418. - DOI
    1. Ueda Y.; Nakajima T. The A-site ordered manganese perovskite and its colossal magnetoresistance. Prog. Solid State Chem. 2007, 35, 397–406. 10.1016/j.progsolidstchem.2007.01.025. - DOI
    1. Loktev V. M.; Pogorelov Y. G. Peculiar physical properties and the colossal magnetoresistance of manganites (Review). Low Temp. Phys. 2000, 26, 171–193. 10.1063/1.593890. - DOI
    1. Kézsmárki I.; Tomioka Y.; Miyasaka S.; Demkó L.; Okimoto Y.; Tokura Y. Optical phase diagram of perovskite colossal magnetoresistance manganites near half doping. Phys. Rev. B: Condens. Matter Mater. Phys. 2008, 77, 07511710.1103/PhysRevB.77.075117. - DOI