

Determination of Advantages and Limitations of qPCR Duplexing in a Single Fluorescent Channel
- PMID: 34497918
- PMCID: PMC8412922
- DOI: 10.1021/acsomega.1c02971
Determination of Advantages and Limitations of qPCR Duplexing in a Single Fluorescent Channel
Abstract
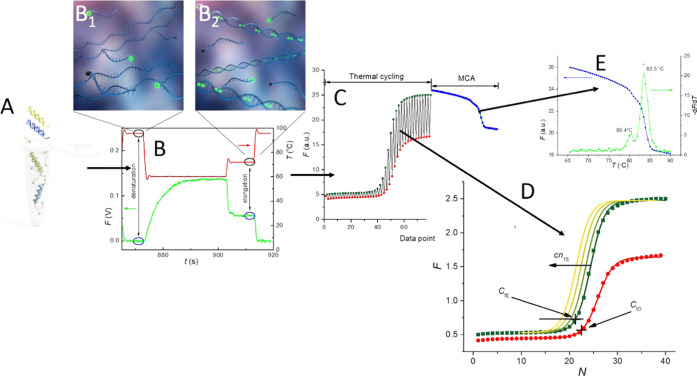
Real-time (quantitative) polymerase chain reaction (qPCR) has been widely applied in molecular diagnostics due to its immense sensitivity and specificity. qPCR multiplexing, based either on fluorescent probes or intercalating dyes, greatly expanded PCR capability due to the concurrent amplification of several deoxyribonucleic acid sequences. However, probe-based multiplexing requires multiple fluorescent channels, while intercalating dye-based multiplexing needs primers to be designed for amplicons having different melting temperatures. Here, we report a single fluorescent channel-based qPCR duplexing method on a model containing the sequence of chromosomes 21 (Chr21) and 18 (Chr18). We combined nonspecific intercalating dye EvaGreen with a 6-carboxyfluorescein (FAM) probe specific to either Chr21 or Chr18. The copy number (cn) of the target linked to the FAM probe could be determined in the entire tested range from the denaturation curve, while the cn of the other one was determined from the difference between the denaturation and elongation curves. We recorded the amplitude of fluorescence at the end of denaturation and elongation steps, thus getting statistical data set to determine the limit of the proposed method in detail in terms of detectable concentration ratios of both targets. The proposed method eliminated the fluorescence overspilling that happened in probe-based qPCR multiplexing and determined the specificity of the PCR product via melting curve analysis. Additionally, we performed and verified our method using a commercial thermal cycler instead of a self-developed system, making it more generally applicable for researchers. This quantitative single-channel duplexing method is an economical substitute for a conventional rather expensive probe-based qPCR requiring different color probes and hardware capable of processing these fluorescent signals.
© 2021 The Authors. Published by American Chemical Society.
Conflict of interest statement
The authors declare no competing financial interest.
Figures
Similar articles
-
Digital polymerase chain reaction duplexing method in a single fluorescence channel.Anal Chim Acta. 2023 Jan 15;1238:340243. doi: 10.1016/j.aca.2022.340243. Epub 2022 Aug 7. Anal Chim Acta. 2023. PMID: 36464439
-
PCR Multiplexing Based on a Single Fluorescent Channel Using Dynamic Melting Curve Analysis.ACS Omega. 2020 Nov 10;5(46):30267-30273. doi: 10.1021/acsomega.0c04766. eCollection 2020 Nov 24. ACS Omega. 2020. PMID: 33251461 Free PMC article.
-
Single Fluorescence Channel-based Multiplex Detection of Avian Influenza Virus by Quantitative PCR with Intercalating Dye.Sci Rep. 2015 Jun 19;5:11479. doi: 10.1038/srep11479. Sci Rep. 2015. PMID: 26088868 Free PMC article.
-
[Quantitative PCR in the diagnosis of Leishmania].Parassitologia. 2004 Jun;46(1-2):163-7. Parassitologia. 2004. PMID: 15305709 Review. Italian.
-
Real-time multiplex PCR assays.Methods. 2001 Dec;25(4):430-42. doi: 10.1006/meth.2001.1265. Methods. 2001. PMID: 11846612 Review.
Cited by
-
A Multiplex PCR Melting-Curve-Analysis-Based Detection Method for the Discrimination of Five Aspergillus Species.J Fungi (Basel). 2023 Aug 11;9(8):842. doi: 10.3390/jof9080842. J Fungi (Basel). 2023. PMID: 37623613 Free PMC article.
-
RT-PCR/MALDI-TOF Diagnostic Target Performance Reflects Circulating SARS-CoV-2 Variant Diversity in New York City.J Mol Diagn. 2022 Jul;24(7):738-749. doi: 10.1016/j.jmoldx.2022.04.003. Epub 2022 May 4. J Mol Diagn. 2022. PMID: 35525388 Free PMC article.
-
High-sensitivity qPCR detection method based on silver flower-like LSPR-active material.Sci Rep. 2025 Feb 18;15(1):5964. doi: 10.1038/s41598-025-90369-6. Sci Rep. 2025. PMID: 39966555 Free PMC article.
-
Detecting Dirofilaria immitis: Current Practices and Novel Diagnostic Methods.Pathogens. 2024 Oct 31;13(11):950. doi: 10.3390/pathogens13110950. Pathogens. 2024. PMID: 39599502 Free PMC article. Review.
-
Development of a Quadruplex RT-qPCR for the Detection of Porcine Astrovirus, Porcine Sapovirus, Porcine Norovirus, and Porcine Rotavirus A.Pathogens. 2024 Nov 29;13(12):1052. doi: 10.3390/pathogens13121052. Pathogens. 2024. PMID: 39770312 Free PMC article.
References
LinkOut - more resources
Full Text Sources
