. 2021 Oct 26;80(10):955-965.
doi: 10.1093/jnen/nlab088.

High-Throughput Digital Image Analysis Reveals Distinct Patterns of Dystrophin Expression in Dystrophinopathy Patients

Affiliations

High-Throughput Digital Image Analysis Reveals Distinct Patterns of Dystrophin Expression in Dystrophinopathy Patients

Silvia Torelli et al. J Neuropathol Exp Neurol. .

Abstract

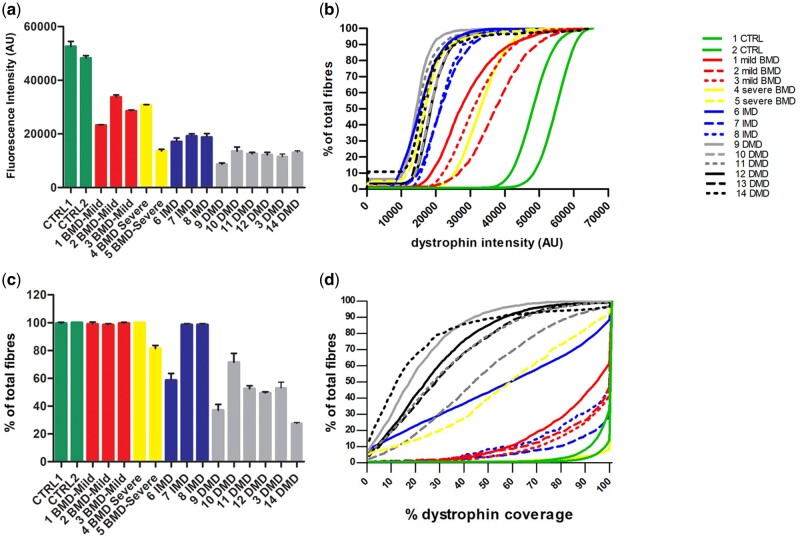
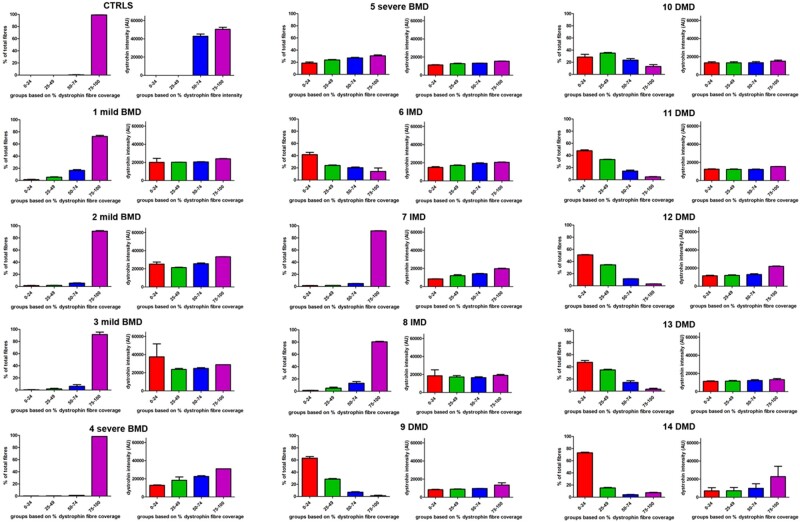
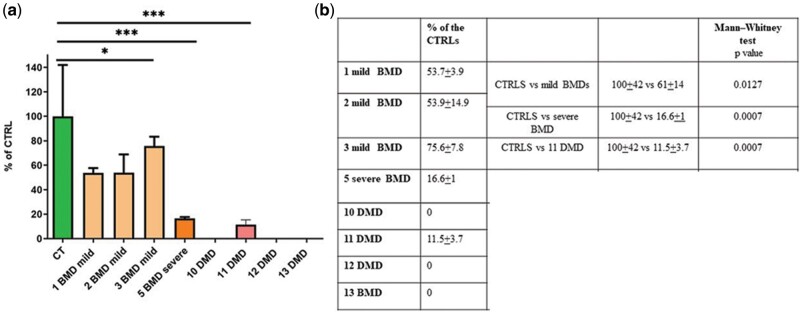
Duchenne muscular dystrophy (DMD) is an incurable disease caused by out-of-frame DMD gene deletions while in frame deletions lead to the milder Becker muscular dystrophy (BMD). In the last decade several antisense oligonucleotides drugs have been developed to induce a partially functional internally deleted dystrophin, similar to that produced in BMD, and expected to ameliorate the disease course. The pattern of dystrophin expression and functionality in dystrophinopathy patients is variable due to multiple factors, such as molecular functionality of the dystrophin and its distribution. To benchmark the success of therapeutic intervention, a clear understanding of dystrophin expression patterns in dystrophinopathy patients is vital. Recently, several groups have used innovative techniques to quantify dystrophin in muscle biopsies of children but not in patients with milder BMD. This study reports on dystrophin expression using both Western blotting and an automated, high-throughput, image analysis platform in DMD, BMD, and intermediate DMD/BMD skeletal muscle biopsies. Our results found a significant correlation between Western blot and immunofluorescent quantification indicating consistency between the different methodologies. However, we identified significant inter- and intradisease heterogeneity of patterns of dystrophin expression in patients irrespective of the amount detected on blot, due to variability in both fluorescence intensity and dystrophin sarcolemmal circumference coverage. Our data highlight the heterogeneity of the pattern of dystrophin expression in BMD, which will assist the assessment of dystrophin restoration therapies.

Keywords: Becker muscular dystrophy; Duchenne muscular dystrophy; Dystrophin; High–throughput digital analysis; Muscle biopsy; Skeletal muscle.


Figures

FIGURE 1.
FIGURE 1.
(A) Representative images for each phenotype of entire transverse muscle section immunostained with anti-dystrophin (green) and anti-laminin α-2 (red) antibodies. Magnification bar: 500 µm. (B) Representative images (upper part, enlarged area from image of patient 11DMD, magnification bar 100 µm; lower part, enlarged area from image of patient 7IMD, magnification bar 500 µm) showing different dystrophin sarcolemmal coverage identified by the script: white star: 75%–100% fiber coverage, yellow star: 50%–74% fiber coverage, blue star: 25%–49% fiber coverage, green star: <25% fiber coverage.
FIGURE 2.
FIGURE 2.
(A) Comparative immunostaining analysis of dystrophin expression in patients with BMD, IMD, and DMD. Transverse muscle sections were double labeled with anti-dystrophin and anti-laminin α-2 antibodies. Images of the entire sections were acquired with a ZEISS Axio Scan.Z1 slide scanner and analyzed by a script developed in Definiens. Values represent the dystrophin mean fluorescent intensity (expressed as arbitrary units, AU) ± standard deviation (SD) (error bar) for each patient. (B) Cumulative frequency distributions of dystrophin intensity. The lines represent the dystrophin intensity distribution in the fiber population for each patient. (C) Percentage of dystrophin-positive fibers in the entire transverse muscle section in individuals with BMD, IMD, and DMD. Values are expressed as percentage of total positive fibers ± SD (error bar). The script classifies as positive a myofiber immunolabeled with dystrophin antibody at the sarcolemma for 25% or more of its circumference. A few patients (1, 2, 3, 4, 7, and 8) showed a percentage of positive fibers similar to controls. The other patients had lower values with patient 14 having the lowest (29.5 + 0.7). (D) Cumulative frequency distributions of sarcolemmal circumference coverage of dystrophin. Lines represent the dystrophin coverage distribution in the fiber population for each patient.
FIGURE 3.
FIGURE 3.
In each section the fiber population was divided in 4 arbitrary groups based on the percentage of dystrophin coverage at the sarcolemma: 0%–24%; 25%–49%; 50%–74%; 75%–100%. The graphs show the percentage of fiber population in each arbitrary group and their mean dystrophin intensity for each patient. For the controls, a representative graph of one of the two controls (CTRL 2) showing the vast majority of the fibers belonging to the 75%–100% group is shown.
FIGURE 4.
FIGURE 4.
Semiquantitative Western blot (WB) analysis of dystrophin expression in muscle biopsies from BMD and DMD patients. Muscle lysates were run on a 3%–8% tris-acetate gradient gel. Blots were probed with an anti-dystrophin C-terminal and anti-sarcomeric actinin (as a loading control) antibodies. Analysis was performed by Image Studio software (Li-Cor, USA). Results are shown as dystrophin intensity normalized to a-actinin and expressed as percentage of controls. Values represent means of 4 repeats; error bars represent the SD; mild BMD *p = 0.0127; severe BMD ***p = 0.000; DMD ***p = 0.0007.
FIGURE 5.
FIGURE 5.
WB correlation with percentage of dystrophin-positive fibers and with dystrophin intensity. The graphs show a good linear correlation between (A) WB and mean percentage of dystrophin-positive fiber values (R = 0.82) and (B) WB and mean dystrophin intensity (R = 0.94) in those patients (patients 1, 2, 3, 5, 10, 11, 12, 13) in which it was possible to perform WB.

References

    1. Flanigan KM. Duchenne and Becker muscular dystrophies. Neurol Clin 2014;32:671–88 - PubMed
    1. Muntoni F, Torelli S, Ferlini A.. Dystrophin and mutations: One gene, several proteins, multiple phenotypes. Lancet Neurol 2003;2:731–40 - PubMed
    1. Kawaguchi T, Niba ETE, Rani AQM, et al.Detection of dystrophin Dp71 in human skeletal muscle using an automated capillary western assay system. Int J Mol Sci 2018;19:1546 - PMC - PubMed
    1. . Rando TA. The dystrophin-glycoprotein complex, cellular signaling, and the regulation of cell survival in the muscular dystrophies. Muscle Nerve 2001;24:1575–94 - PubMed
    1. Shimizu-Motohashi Y, Komaki H, Motohashi N, et al.Restoring dystrophin expression in duchenne muscular dystrophy: Current status of therapeutic approaches. J Pers Med 2019;9:1. - PMC - PubMed

Publication types