. 2021 Nov 24;184(2):214-222.
doi: 10.1093/toxsci/kfab110.

Metabolomics of Lung Microdissections Reveals Region- and Sex-Specific Metabolic Effects of Acute Naphthalene Exposure in Mice

Affiliations

Metabolomics of Lung Microdissections Reveals Region- and Sex-Specific Metabolic Effects of Acute Naphthalene Exposure in Mice

Nathanial C Stevens et al. Toxicol Sci. .

Abstract

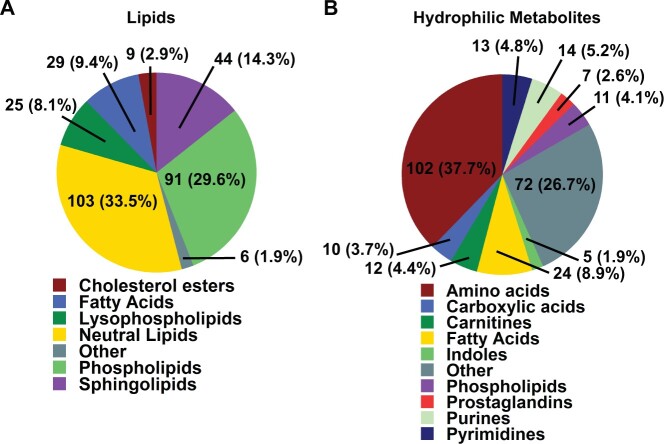
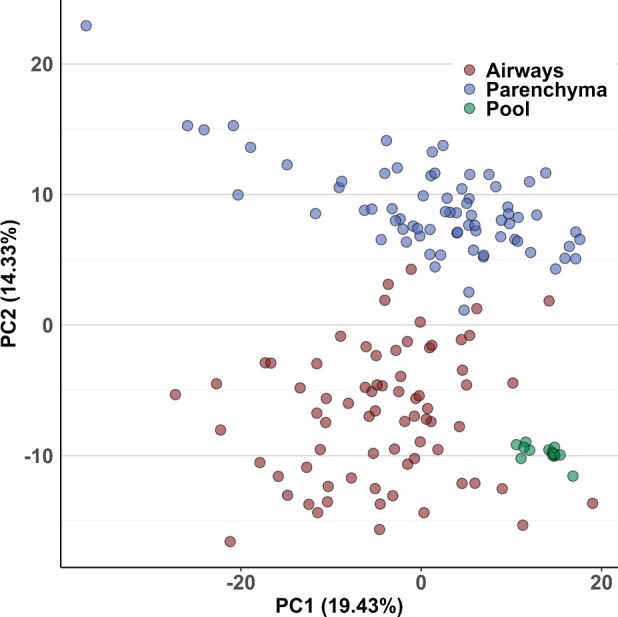
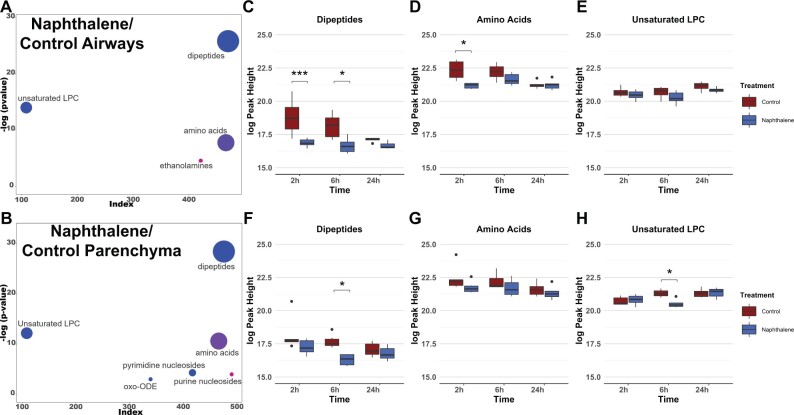
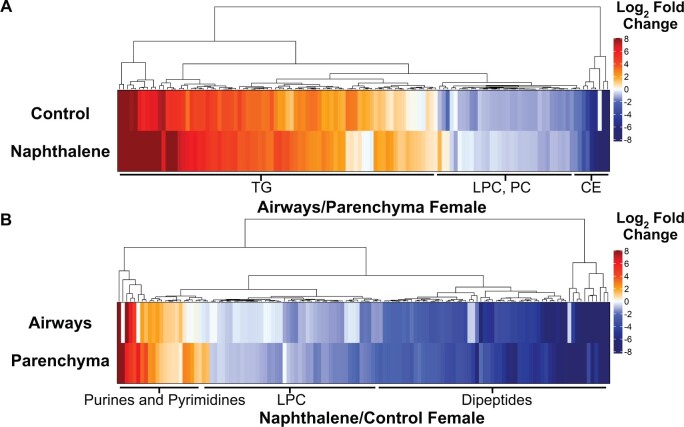
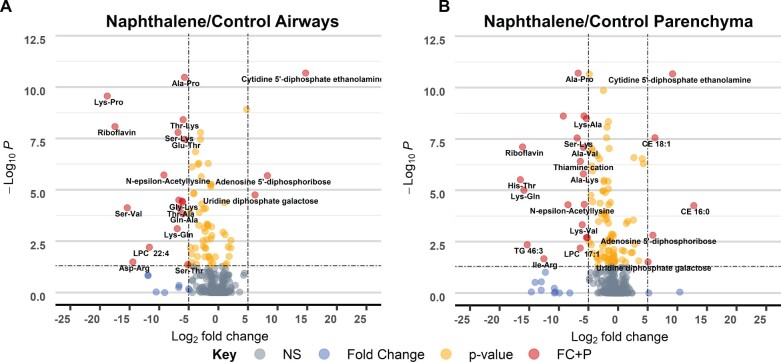
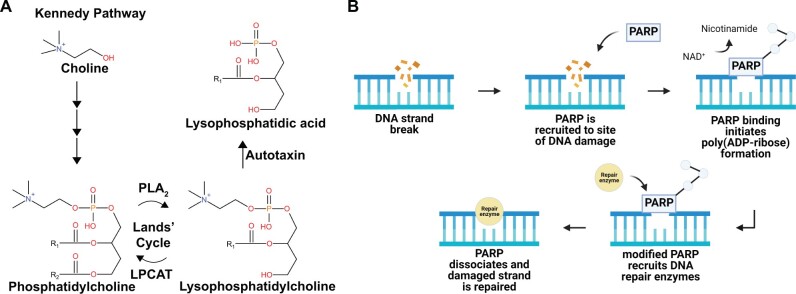
Naphthalene is a ubiquitous environmental contaminant produced by combustion of fossil fuels and is a primary constituent of both mainstream and side stream tobacco smoke. Naphthalene elicits region-specific toxicity in airway club cells through cytochrome P450 (P450)-mediated bioactivation, resulting in depletion of glutathione and subsequent cytotoxicity. Although effects of naphthalene in mice have been extensively studied, few experiments have characterized global metabolomic changes in the lung. In individual lung regions, we found metabolomic changes in microdissected mouse lung conducting airways and parenchyma obtained from animals sacrificed at 3 timepoints following naphthalene treatment. Data on 577 unique identified metabolites were acquired by accurate mass spectrometry-based assays focusing on lipidomics and nontargeted metabolomics of hydrophilic compounds. Statistical analyses revealed distinct metabolite profiles between the 2 lung regions. Additionally, the number and magnitude of statistically significant exposure-induced changes in metabolite abundance were different between airways and parenchyma for unsaturated lysophosphatidylcholines, dipeptides, purines, pyrimidines, and amino acids. Importantly, temporal changes were found to be highly distinct for male and female mice with males exhibiting predominant treatment-specific changes only at 2 h postexposure. In females, metabolomic changes persisted until 6 h postnaphthalene treatment, which may explain the previously characterized higher susceptibility of female mice to naphthalene toxicity. In both males and females, treatment-specific changes corresponding to lung remodeling, oxidative stress response, and DNA damage were observed. Overall, this study provides insights into potential mechanisms contributing to naphthalene toxicity and presents a novel approach for lung metabolomic analysis that distinguishes responses of major lung regions.

Keywords: lung; metabolomics; microdissection; polycyclic aromatic hydrocarbons.


Figures

Figure 1.
Figure 1.
Overview of annotations identified by lipidomics and HILIC analysis. A, Complex lipids were classified by ClassyFire software into 7 major lipid classes consisting of 307 unique annotations. B, Hydrophilic compounds were classified into 10 major metabolite classes, comprising 270 unique annotations. ClassyFire categories with less than 5 compounds were summarized into “Other” class labels.
Figure 2.
Figure 2.
Principal components analysis (PCA) of metabolic variance in mouse lungs. PC2 discriminates metabolic phenotypes of mouse airways and parenchyma. Pool samples were prepared by mixing fractions of each extracted parenchyma and airways sample, which were used as a measure of technical variance of the analytical method.
Figure 3.
Figure 3.
Metabolite profiles of lung airways and parenchyma are altered in response to naphthalene-treatment in females 6 h postinjection. A and B, ChemRICH plots comparing naphthalene-treated airways and parenchyma in female mice 6 h postinjection, respectively. The size of each circle represents the relative number of metabolites contained within each cluster. Red circles indicate all metabolites increase within a cluster, whereas blue circles indicate all metabolites decrease within a cluster. Pink and purple circles represent a mix consisting of mostly increased and decreased metabolite abundances, respectively. Axes correspond to the −log p value of a metabolite class plotted against index values assigned to each metabolite in the online datasheet included as supplemental material. p values used for the input of each ChemRICH were calculated by 1-way ANOVA with Tukey’s post hoc analysis. p values for each ChemRICH cluster were calculated using the Kolmogorov-Smirnov test. C–H, Boxplots displaying the average intensities for the largest clusters of metabolite classes altered in female airways and parenchyma for all timepoints, respectively. Axes represent the log10 peak height of each sample for each timepoint, and samples with values greater than 1.5 times the interquartile range are indicated by dots on each plot. *p < .05, ***p < .001.
Figure 4.
Figure 4.
Naphthalene treatment greatly alters the profiles of individual metabolite subclasses in female airways and parenchyma at 6 h. A, Heatmap comparing metabolite abundance of airways relative to parenchyma for each treatment at 6 h. B, Heatmap comparing metabolite abundance of naphthalene-treated tissues relative to control-treated tissues at 6 h for each tissue type. For both heatmaps, Euclidean clustering was used for HCA. Fold changes are expressed as the log2 fold change of each metabolite to indicate direction. Only metabolites that were statistically significant in at least one comparison were included in each figure. Labels of the most prevalent metabolite classes within each cluster are included below the body of the heatmap. p values were calculated by 1-way ANOVA and Tukey’s post hoc analysis. Lists of metabolites present in each heatmap are included in Tables 3 and 4.
Figure 5.
Figure 5.
Individual metabolite changes in naphthalene-treated female mice differ in magnitude and between tissues. A and B, Volcano plot of −log10p value versus log2 fold change of metabolites in naphthalene-treated airways and parenchyma relative to control, respectively. p values were determined using 1-way ANOVA with Tukey’s post hoc analysis. An arbitrary log2 fold change cut-off of 5 was used to indicate metabolites with especially large differences between treatment groups. A p value threshold of <.05 was selected to indicate statistical significance. Metabolites that pass both thresholds are indicated in red, whereas metabolites not passing either threshold are shaded in gray. Yellow and blue dots represent metabolites that only pass either the p value or fold change threshold, respectively.
Figure 6.
Figure 6.
Naphthalene alters metabolites related to lung remodeling, oxidative stress, and DNA damage. A, De novo synthesis of phosphatidylcholine (PC) via the Kennedy pathway and subsequent breakdown into lysophosphatidylcholine by phospholipase A2 (PLA2). Lysophosphatidylcholine can either be metabolized by autotaxin into lysophosphatidic acid or converted back into PC through lysophosphatidylcholine acyltransferase (LPCAT). B, ADP-ribose is a subunit of poly (ADP-ribose), which is formed by poly adenosine diphosphate ribose polymerase (PARP) in response to DNA strand breaks. Created with Biorender.com.

Similar articles

Cited by

References

    1. Altmeyer M., Messner S., Hassa P. O., Fey M., Hottiger M. O. (2009). Molecular mechanism of poly(adp-ribosyl)ation by parp1 and identification of lysine residues as adp-ribose acceptor sites. Nucleic Acids Res. 37, 3723–3738. - PMC - PubMed
    1. Barupal D. K., Fiehn O. (2017). Chemical similarity enrichment analysis (chemrich) as alternative to biochemical pathway mapping for metabolomic datasets. Sci. Rep. 7, 14567. - PMC - PubMed
    1. Bonini P., Kind T., Tsugawa H., Barupal D. K., Fiehn O. (2020). Retip: Retention time prediction for compound annotation in untargeted metabolomics. Anal. Chem. 92, 7515–7522. - PMC - PubMed
    1. Bradley H., Nccoxnell S. D., Crystal R. G. (1974). Lung collagen composition and synthesis. J. Biol. Chem. 219, 2674–2683. - PubMed
    1. Brunetti M., Gaiti A., Porcellati G. (1979). Synthesis of phosphatidylcholine and phosphatidylethanolamine at different ages in the rat brain in vitro. Lipids 14, 925–931. - PubMed

Publication types

Substances