. 2021 Dec 3;33(12):3700-3720.
doi: 10.1093/plcell/koab223.

The versatility of plant organic acid metabolism in leaves is underpinned by mitochondrial malate-citrate exchange

Affiliations

The versatility of plant organic acid metabolism in leaves is underpinned by mitochondrial malate-citrate exchange

Chun Pong Lee et al. Plant Cell. .

Abstract

Malate and citrate underpin the characteristic flexibility of central plant metabolism by linking mitochondrial respiratory metabolism with cytosolic biosynthetic pathways. However, the identity of mitochondrial carrier proteins that influence both processes has remained elusive. Here we show by a systems approach that DICARBOXYLATE CARRIER 2 (DIC2) facilitates mitochondrial malate-citrate exchange in vivo in Arabidopsis thaliana. DIC2 knockout (dic2-1) retards growth of vegetative tissues. In vitro and in organello analyses demonstrate that DIC2 preferentially imports malate against citrate export, which is consistent with altered malate and citrate utilization in response to prolonged darkness of dic2-1 plants or a sudden shift to darkness of dic2-1 leaves. Furthermore, isotopic glucose tracing reveals a reduced flux towards citrate in dic2-1, which results in a metabolic diversion towards amino acid synthesis. These observations reveal the physiological function of DIC2 in mediating the flow of malate and citrate between the mitochondrial matrix and other cell compartments.


Figures

Figure 1
Figure 1
Regulation of malate oxidation leading to citrate production in Arabidopsis. Two malate-oxidizing pathways contribute to the formation of citrate in plant mitochondria. Malate can be oxidized into either OAA or pyruvate. OAA accumulation leads to the inhibition of the malate-oxidizing malate dehydrogenase reaction. The availability of acetyl-CoA for condensation with OAA by citrate synthase is another factor for the regulation of mitochondria malate oxidation. During the day, pyruvate-derived acetyl-CoA amount is limited due to the inhibition of pyruvate dehydrogenase phosphorylation and the reverse reaction of malate dehydrogenase is favored to support photorespiration. At night, NAD-dependent malic enzyme (NAD-ME) and dephosphorylated pyruvate dehydrogenase are activated, allowing optimal supply of acetyl-CoA and OAA for efficient citrate synthesis. While the identity of plant mitochondrial pyruvate carrier (MPC) has recently been confirmed (Le et al., 2021a), the exact molecular identity and in vivo function for malate, OAA, citrate and alanine transporters are not clear. AlaAT, alanine aminotransferase; CS, citrate synthase; MDH, malate dehydrogenase; MPC, mitochondrial pyruvate carrier; PDC, pyruvate dehydrogenase complex.
Figure 2
Figure 2
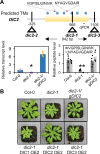
Phenotypic characterization of the DIC2 mutant. A, Top, gene model of DIC2 showing predicted transmembrane domains based on ARAMEMNON consensus prediction (Schwacke et al., 2003), the position of T-DNA insertion in the dic2-1 line and locations of peptides for selective reaction monitoring mass spectrometry (in purple lines) and the transcript for qPCR (in green line). Bottom left, expression levels of DIC2 as determined by qPCR in different genotypes (n = 4). Bottom right, abundance analysis of unique peptides of DIC2 using the quantifier ion transitions VGPISLGINIVK and NYAGVGDAIR (n = 5). Individual data points were overlaid in dots in bar graphs. Asterisks denote significant differences between dic2-1 versus Col-0 and dic2-1 versus dic2-1/gDIC2 based on ANOVA and post hoc analysis (*P < 0.05). B, Vegetative phenotype of Col-0, dic2-1 and complemented lines (gDIC2, native promoter; OE, 35S promoter) grown on soil under short-day conditions (8-h light/16-h dark) for 49 days after germination. Representative top view of various genotypes is shown. Expression levels are shown in Supplemental Table S1.
Figure 3
Figure 3
Uptake, consumption and export of malate or citrate by mitochondria isolated from the DIC2 mutant. A, Uptake rate of 200 µM [14C]-malate into isolated mitochondria under nonenergizing conditions. B, Experimental design for monitoring substrate consumption, product formation and metabolite transport kinetics of isolated mitochondria. Mitochondria are fed with a substrate under energized conditions. After indicated time interval, mitochondria are separated from extra-mitochondrial space by centrifugation through a silicone oil layer. These fractions are collected, and substrates (S) and products (P) in the EMS and in pelleted mitochondria are quantified by selective reaction monitoring mass spectrometry. C, Uptake rate of 500 µM (left) or 50 µM (right) malate into isolated mitochondria under energizing conditions. D, Time-course of pyruvate concentration in mitochondria in the presence of 500-µM external malate. E–I, Bar graphs showing the accumulation rate of (E) pyruvate in the EMS, (F) fumarate in the EMS, (G) fumarate in mitochondria, (H) citrate in the EMS, and (I) citrate in mitochondria upon 500-µM malate feeding. (J) Uptake rate of 500-µM citrate into isolated mitochondria under energizing conditions. K, Citrate accumulation rate in mitochondria when incubated with 500 µM external citrate. All data are presented as mean (± se) from at least three biological replicates. Individual data points were overlaid in dots in bar graphs. Asterisks denote significant differences between dic2-1 versus Col-0 and dic2-1 versus dic2-1/gDIC2 based on ANOVA and Tukey’s post hoc analysis (*P < 0.05; **P < 0.01). Response curves shown can also be found in Supplemental Figure S4, A and B.
Figure 4
Figure 4
Kinetic analysis of DIC2 substrate specificity by proteoliposome transport assay. A, Proteoliposomes reconstituted with microsomal membrane expressing V5-tagged empty vector control or DIC2 were analyzed by immunoblotting with anti-V5 tag antibodies. Image shown was exposed for 1 min. Gel loading control and images obtained from other exposure times are shown in Supplemental Figure S5A. B, Quantification of transport of TCA cycle organic acids (100 µM each) into proteoliposomes preloaded with 10-mM citrate. ** indicate a significant difference between empty vector and DIC2 with P < 0.01 according to the Student’s t test. Individual data points were overlaid in dots. C, Time course of malate uptake (100 µM) into 10-mM citrate-loaded proteoliposomes containing DIC2. Asterisks indicate a significant difference between empty vector and DIC2 according to the Student’s t test (**P < 0.01 and * < 0.05). D, Kinetic characteristics of DIC2 reconstituted into 10-mM citrate-loaded proteoliposomes in the presence of varying external malate concentrations (0–250 µM). Data are expressed as mean ± se from four independent experiments.
Figure 5
Figure 5
Photosynthetic and respiratory phenotypes of the DIC2 knockout mutant. A, Photosynthetic CO2 assimilation rate at different PAR with CO2 concentration at 400 ppm and temperature at 22°C (n = 7, mean ± se, no significant difference based on one-way ANOVA). B, Determination of post-illumination CO2 burst. A single leaf illuminated with actinic light of 1,000 μmol m−2 s−1, CO2 concentration of 100 ppm at 25°C was darkened for 2 min and post-illumination burst was monitored in the first 30 s (n = 6, mean ± se, data points within the bracket indicate significant differences of P < 0.05 for dic2-1 versus Col-0 and dic2-1 versus dic2-1/gDIC2 comparisons based on one-way ANOVA with Tukey post hoc test). C, Cytosolic NAD redox dynamics of the leaves of 6-week-old plants in response to a sudden light-to-dark transition. Redox changes of the NAD pool correspond to the Peredox-mCherry ratio (log10(tS/mC)), i.e. high ratio indicates high NADH/NAD+ ratio. Dark adapted leaf discs were illuminated at actinic light of 220 μmol m−2 s−1 before they were transferred to the dark. The 5-min light/15-min dark time course is shown on the left, with the red rectangle indicating the moment when significant differences in NAD redox state were observed. Zoom-in of this red rectangle time interval is shown on the right. Each data point represents mean ± sd (n ≥ 6), with asterisks indicating a significant difference with P < 0.001 based on multiple t tests (alpha = 5%) from the Holm–Sidak Method. D, Changes in the cytosolic NAD redox state over 8-h light/16-h dark diurnal cycle. Leaf discs were exposed to actinic light of 120 μmol m−2 s−1 before light was switched off. Two independent lines (A and B) for each genotype were measured. Data shown indicate mean ± sd (n ≥ 8) with no significant differences found between lines. E, Time course of leaf respiration measurements in the dark (RN) as measured by Q2 (n > 8, mean ± se, all time points for the dic2-1 line are significantly different from other genotypes with P < 0.05 based on one-way ANOVA with Tukey post hoc test).
Figure 6
Figure 6
Quantitative analysis of metabolites associated with the TCA cycle in a diurnal cycle and during prolonged darkness in the DIC2 knockout mutant. A, Plants were grown under short day conditions for 6 weeks and leaf discs were collected at 1, 4, 8, 12, and 15 h after dark shift and 1, 4, and 7 h after light shift. Metabolites in this figure were analyzed by LC–MRM–MS (n ≥ 6). Metabolites are colored according to their accumulation pattern in dic2-1 in a diurnal cycle: Orange, accumulates at night; Brown, accumulates during light and dark shift; Green, accumulates predominantly during the day; Blue, accumulates throughout a diurnal cycle; Purple, accumulates only after the first hour of dark shift; gray, metabolite not measured. B, Sucrose levels in leaf discs from Col-0, dic2-1 and dic2-1/gDIC2 collected at different time points of a diurnal cycle as quantitatively determined by GC–MS against authentic standards (n ≥ 6). C, CO2 evolution of leaf discs incubated in uniformly labeled 14C-malate. 14CO2 was captured in a NaOH trap, radiolabel in leaf discs was extracted and the radioactivity in these samples was counted by a liquid scintillation counter. Data shown are the percentage of CO2 released relative to the total amount of radiolabel incorporated into leaf metabolism (n ≥ 7). D, Images of 5- to 6-week-old, short-day grown plants treated with 0 and 10 days of extended darkness. Values for maximum quantum efficiency of photosystem II (Fv/Fm) are shown below each genotype (n = 6). E, Changes in citrate, 2-OG and malate content in Arabidopsis plants after 0, 3, 7, 10, and 12 days of extended darkness treatment (n ≥ 6). Individual data points were overlaid in dots in bar graphs. Each data point represents mean and each error bar represents ± se where appropriate. Asterisks indicate a significant change for dic2-1 versus Col-0 and dic2-1 versus dic2-1/gDIC2 comparisons as determined by one-way ANOVA with Tukey post hoc test (*P < 0.05; **P < 0.01).
Figure 7
Figure 7
The loss of DIC2 causes an altered metabolite turnover of the TCA cycle in the dark. A–F, Time-courses of 13C-labeling into metabolism in darkened leaf discs. Absolute abundance of total labeled metabolites as indicated is shown. Each value is expressed as the amount of indicated metabolite labeled per fresh weight of leaf per O2 molecule consumed at the specified incubation time (n = 4). All 13C labeling data are available in Supplemental Data Set S1. G, Gene expression analysis of peroxisomal citrate synthase and cytosolic ATP-dependent citrate lyase in leaves at night. qPCR determination of relative transcript abundances of CYS2, CYS3, ACLA-1, ACLA-2, ACLA-3, ACLB-1, and ACLB-2 in the indicated genotypes collected 15 h after dark shift. All expression values were normalized against Col-0 sample (n = 4), and individual data points were overlaid in dots. Values shown are mean and error bars are ± se (where appropriate), with asterisks indicating significant differences (*P < 0.05 or **P < 0.01) between dic2-1 versus Col-0 and dic2-1 versus dic2-1/gDIC2 pairs as determined by one-way ANOVA with Tukey post hoc test.
Figure 8
Figure 8
Schematic model of mitochondrial malate–citrate exchange for the maintenance of citrate metabolism at night. In wild-type leaves (left), DIC2 facilitates the export of citrate in exchange for malate (thick purple line) and operates in conjunction with other organic acid transporters (including other malate and citrate carriers) to support mitochondrial anaplerotic metabolism in the dark. Citrate exported from mitochondria is mostly transferred to the vacuole, with the remainder being converted to acetyl-CoA in the cytosol for the synthesis of secondary metabolism products, such as isoprenoids and flavonoids. The DIC2 loss-of-function mutant (dic2-1, right) significantly reduces citrate export from mitochondria but has little impact on cellular organic acid pools, including citrate. This is due to the activation of a number of compensatory mechanisms to minimize major metabolic disruptions, including (in green solid lines for single-step reactions or dashed lines for multistep pathways): increased citrate supply from β-oxidation of fatty acids in peroxisomes, faster sucrose depletion rate to increase the overall carbon supply, a higher rate of malate transport by non-DIC2 carriers and diversions of excess mitochondrial citrate and cytosolic malate into amino acid biosynthesis. However, these metabolic rearrangements fail to alleviate or cause the stunted phenotype of dic2-1 plants, indicating that DIC2 activity is important for maintaining an overall metabolic homeostasis, particularly at night and during starvation.
None

Similar articles

Cited by

References

    1. Araújo WL, Tohge T, Nunes-Nesi A, Obata T, Fernie AR (2014) Analysis of kinetic labeling of amino acids and organic acids by GC-MS. InDieuaide-Noubhani M, Alonso AP, eds, Plant Metabolic Flux Analysis: Methods and Protocols. Humana Press, Totowa, NJ, pp 107–119 - PubMed
    1. Ashykhmina N, Lorenz M, Frerigmann H, Koprivova A, Hofsetz E, Stührwohldt N, Flügge U-I, Haferkamp I, Kopriva S, Gigolashvili T (2019) PAPST2 plays critical roles in removing the stress signaling molecule 3′-phosphoadenosine 5′-phosphate from the cytosol and its subsequent degradation in plastids and mitochondria. Plant Cell 31: 231–249 - PMC - PubMed
    1. Baud S, Guyon V, Kronenberger J, Wuillème S, Miquel M, Caboche M, Lepiniec L, Rochat C (2003) Multifunctional acetyl-CoA carboxylase 1 is essential for very long chain fatty acid elongation and embryo development in Arabidopsis. Plant J 33: 75–86 - PubMed
    1. Bernard SM, Habash DZ (2009) The importance of cytosolic glutamine synthetase in nitrogen assimilation and recycling. New Phytol 182: 608–620 - PubMed
    1. Bykova NV, Møller IM, Gardeström P, Igamberdiev AU (2014) The function of glycine decarboxylase complex is optimized to maintain high photorespiratory flux via buffering of its reaction products. Mitochondrion 19: 357–364 - PubMed

Publication types

MeSH terms