. 2021 Dec 3;33(12):3721-3742.
doi: 10.1093/plcell/koab224.

SnRK1 stimulates the histone H3K27me3 demethylase JMJ705 to regulate a transcriptional switch to control energy homeostasis

Affiliations

SnRK1 stimulates the histone H3K27me3 demethylase JMJ705 to regulate a transcriptional switch to control energy homeostasis

Wentao Wang et al. Plant Cell. .

Abstract

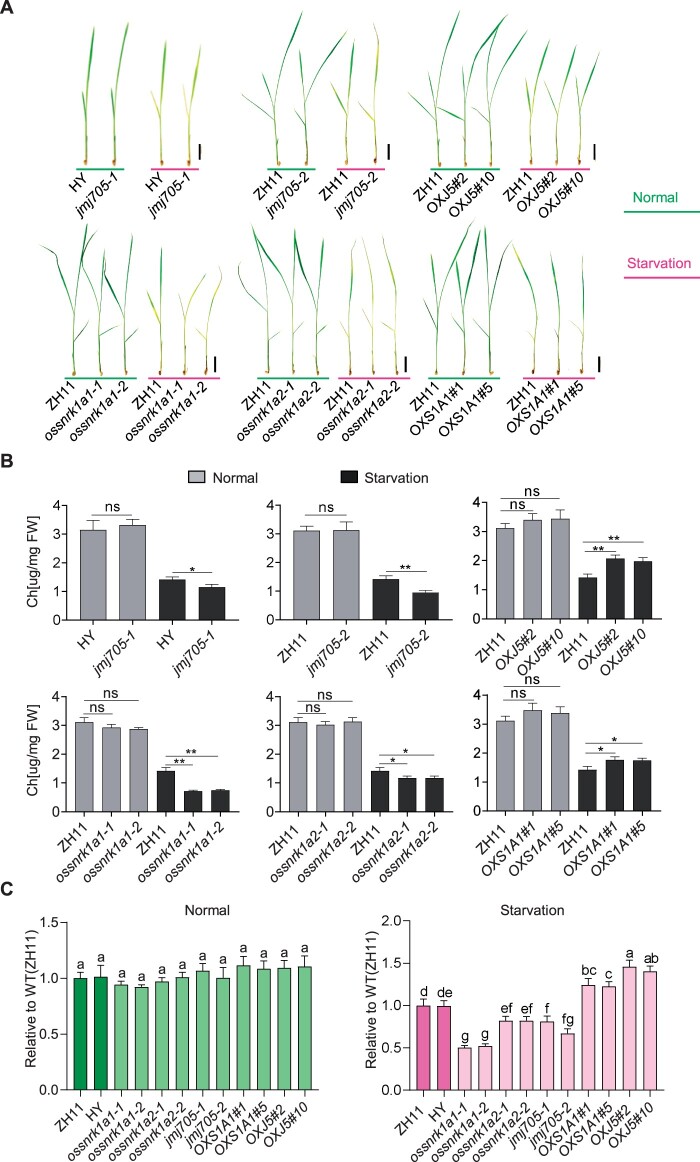
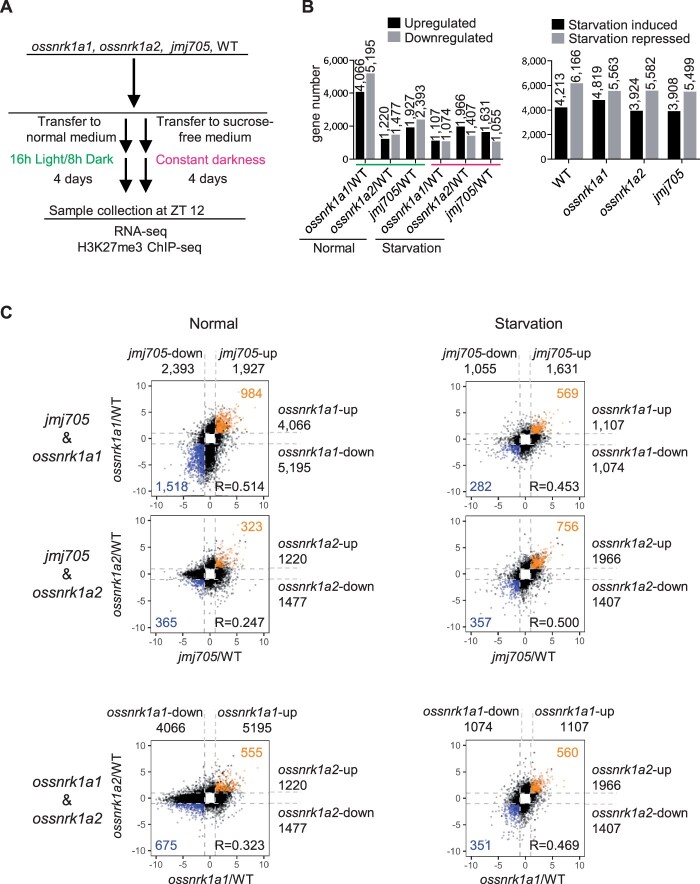
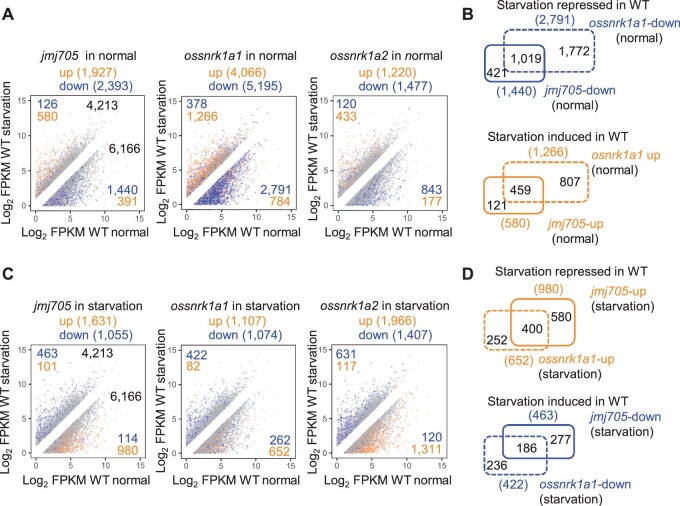
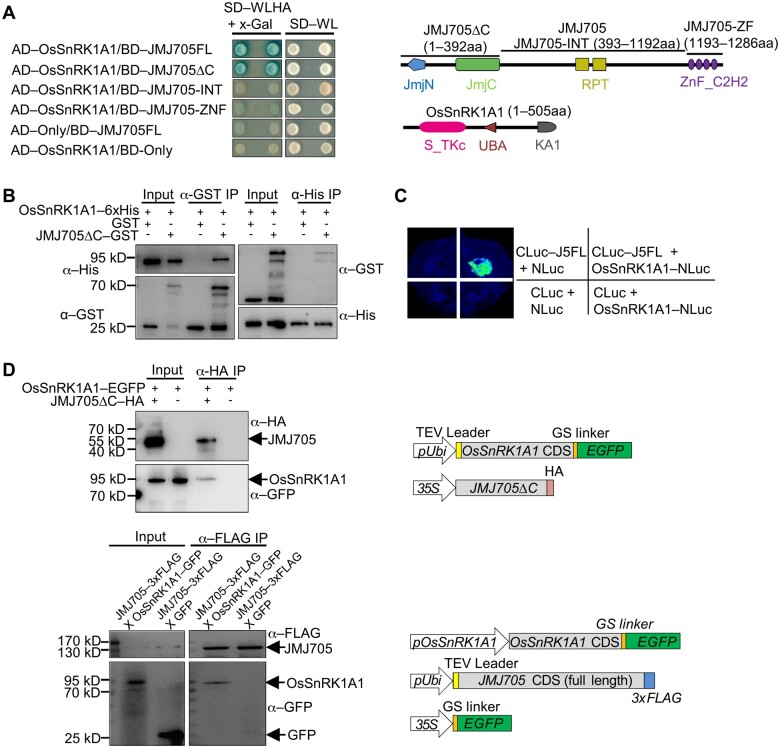
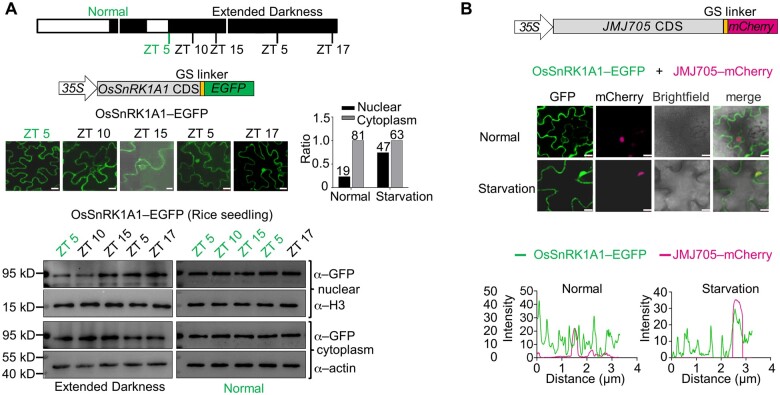
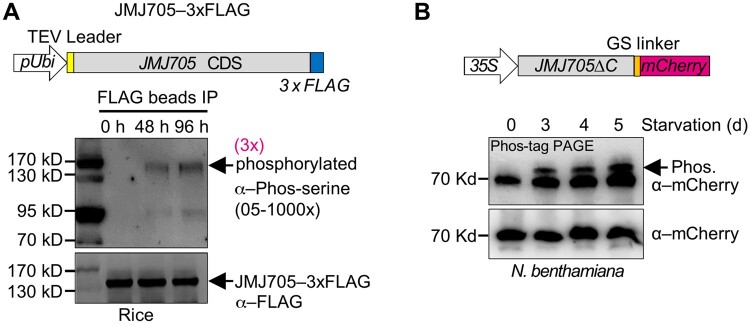
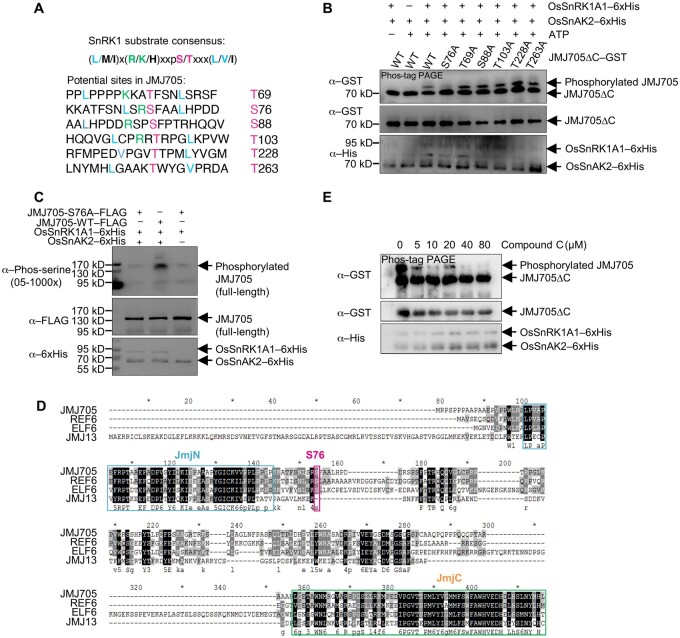
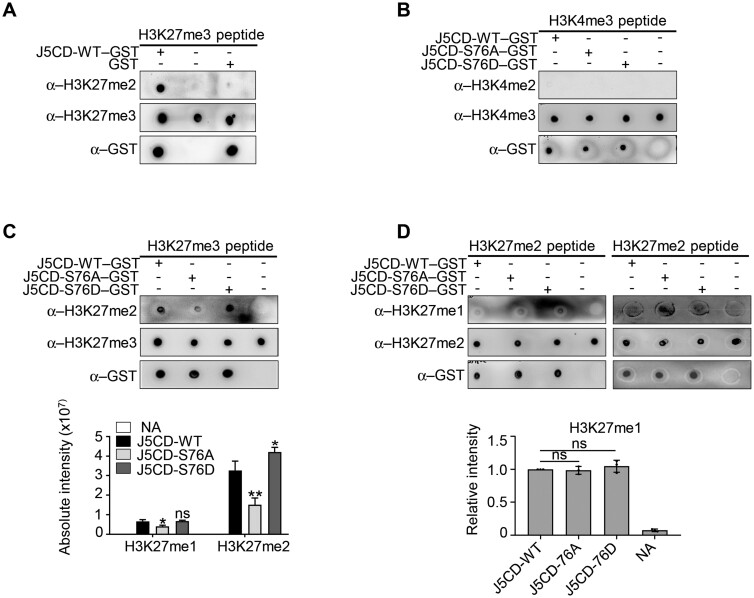
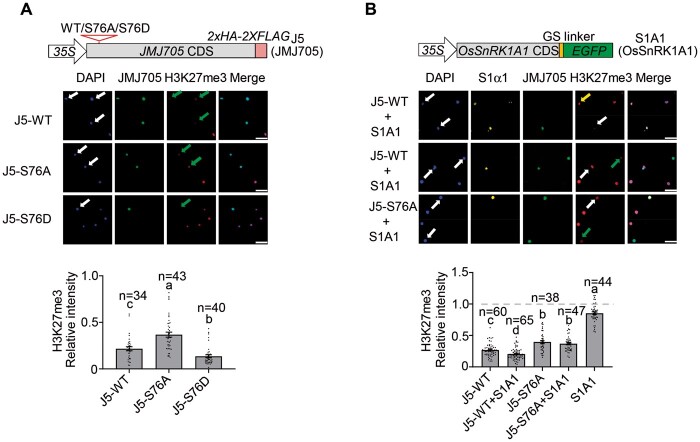
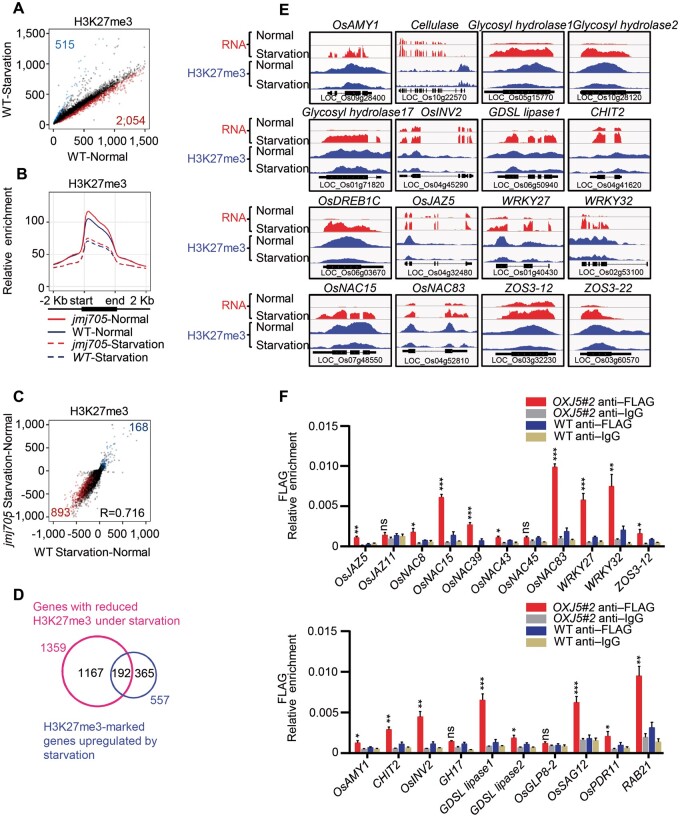
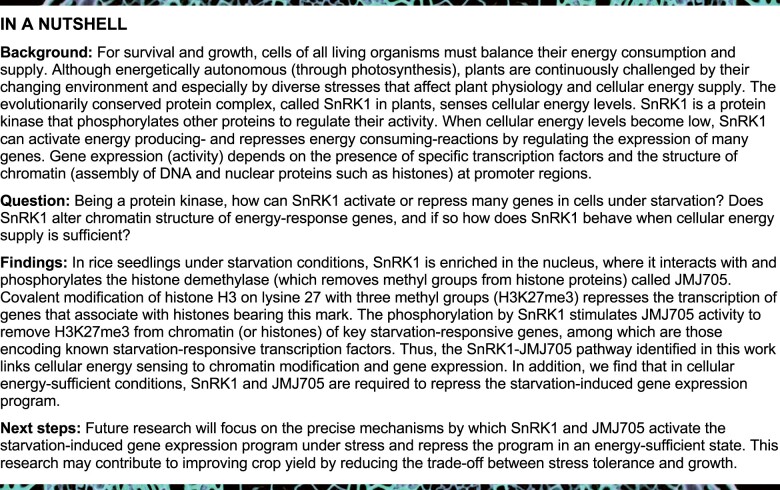
Plant SNF1-Related Kinase1 (SnRK1) is an evolutionarily conserved energy-sensing protein kinase that orchestrates transcriptional networks to maintain cellular energy homeostasis when energy supplies become limited. However, the mechanism by which SnRK1 regulates this gene expression switch to gauge cellular energy status remains largely unclear. In this work, we show that the rice histone H3K27me3 demethylase JMJ705 is required for low energy stress tolerance in rice plants. The genetic inactivation of JMJ705 resulted in similar effects as those of the rice snrk1 mutant on the transcriptome, which impairs not only the promotion of the low energy stress-triggered transcriptional program but also the repression of the program under an energy-sufficient state. We show that the α-subunit of OsSnRK1 interacts with and phosphorylates JMJ705 to stimulate its H3K27me3 demethylase activity. Further analysis revealed that JMJ705 directly targets a set of low energy stress-responsive transcription factor genes. These results uncover the chromatin mechanism of SnRK1-regulated gene expression in both energy-sufficient and -limited states in plants and suggest that JMJ705 functions as an upstream regulator of the SnRK1α-controlled transcriptional network.


Figures

Figure 1
Figure 1
Effect of mutation and OE of JMJ705, OsSnRK1A1, and OsSnRK1A2 on rice tolerance to starvation stress. A, Phenotypes of 21-day-old rice wild type (ZH11, HY), jmj705, ossnrk1a1 and ossnrk1a2 mutants and JMJ705 and OsSnRK1A1 OE lines grown under control conditions or subjected to dark-induced starvation for 4 days. Scale bars = 2.5 cm. Two mutant alleles and two independent OE lines were tested. OXJ5: JMJ705 OE lines; OXS1A1: OsSnRK1A1 OE lines. B, Chlorophyll contents in the above-tested genotypes (50–70 plants per sample were used for chlorophyll extraction). Three biological replicates were performed for each sample. Data are shown as means ± standard error (se). Student’s t test was used to calculate the P value (*P< 0.05, **P< 0.01, ***P< 0.001), ns, not significant. C, Relative chlorophyll levels in wild-type (ZH11 or HY), jmj705 and ossnrk1a mutants under normal and starvation conditions. Data are shown as means ± se. Different letters indicate significant differences, as determined by one-way ANOVA.
Figure 2
Figure 2
Loss of JMJ705, OsSnRK1A1, and OsSnRK1A2 result in overlapping differential gene expression profiles under both normal and starvation conditions. A, Schematic diagram of starvation treatments and sample collection for RNA-seq and ChIP-seq. B, Left, number of DEGs in ossnrk1a1-1, ossnrk1a2-1, and jmj705-1 versus wild type (WT) in normal and starvation conditions. Right, the number of starvation-induced- and repressed-genes in WT, ossnrk1a1, ossnrk1a2, and jmj705 mutants. C, Scatterplots showing pairwise comparisons of expression change in the mutants versus WT in normal (left) or starvation (right) conditions. The x-axis and y-axis represent gene expression changes (log2FC) in the indicated mutant versus WT. Orange dots represent shared upregulated genes and blue dots represent shared downregulated between the compared genotypes. Genes with FPKM fold-change > 2 and FDR < 0.05 were considered differentially expressed.
Figure 3
Figure 3
Relationship between DEGs in the mutant and starvation upregulated and downregulated genes in wild-type plants. A, Overlap between mutant versus WT DEGs under normal conditions and starvation-upregulated (4,213) and downregulated (6,166) genes in WT. The x-axis and y-axis represent gene expression levels in FPKM in WT under normal and starvation conditions, respectively. The orange and blue dots represent upregulated and downregulated genes, respectively, in the mutant compared to WT under normal conditions. The gray dots represent starvation-induced or -repressed genes in WT that do not overlap with mutant DEGs. B, Overlap of genes repressed (blue, upper part) or induced (orange, lower part) in jmj705 and ossnrk1a1 mutants in normal conditions that are repressed or induced, respectively, by starvation in wild-type. C, Overlap of mutant versus WT DEGs under starvation with the 4,213 starvation-induced and the 6,166 starvation-repressed genes in WT. The x-axis and y-axis represent transcript levels in FPKM in WT under starvation and normal conditions, respectively. The orange and blue dots represent upregulated and downregulated genes, respectively, in the mutant compared to WT under starvation. The gray dots represent starvation-induced or -repressed genes in WT that do not overlap with mutant DEGs. D, Overlap of genes induced (orange, upper part) or repressed (blue, lower part) in jmj705 and ossnrk1a1 mutants upon starvation that are repressed or induced, respectively, by starvation in wild type.
Figure 4
Figure 4
The histone demethylase JMJ705 interacts with OsSnRK1A1. A, Yeast two-hybrid tests of JMJ705 interaction with OsSnRK1A1. Full-length JMJ705 (aa 1–1,286), JMJ705ΔC (aa 1–392), JMJ705-INT (aa 393–1192) or JMJ705-ZNF (aa 1,193–1,286) and OsSnRK1A1 (aa 1–505) were fused to the GAL4 DNA DB or AD. Yeast cells were spotted onto stringent selection medium lacking Trp, Leu, His, and adenine (–WLHA) with 40 µg/mL X-Gal or a nonselective medium lacking Trp and Leu (–WL) as control. Schematic diagrams of JMJ705, OsSnRK1A1 proteins are shown on the right. B, In vitro pull-down assay of OsSnRK1A1 and JMJ705. OsSnRK1A1-SUMO-6xHis was incubated with JMJ705ΔC-GST or GST and was pulled down from JMJ705ΔC-GST-conjugated GST beads (left). The two proteins were also incubated with MagneHis Ni-Particles, and JMJ705ΔC-GST was pulled down from OsSnRK1A1-SUMO-6xHis-conjugated Ni-Particles (right). The eluates were analyzed by immunoblots using the indicated antibodies. C, Split-luciferase complementation imaging assays. Constructs encoding cLUC-tagged JMJ705 or cLUC alone were co-infiltrated into N. benthamiana leaves with nLUC-tagged OsSnRK1-1 or nLUC alone, as indicated to the right. Infiltrated leaves were harvested and dark-adapted for 5 min before detection of luminescence. D, In vivo co-immunoprecipitation assay of OsSnRK1A1 and JMJ705 showing their interaction in rice protoplasts. Upper panel: 35Spro:JMJ705ΔC-HA was transfected into rice protoplasts isolated from dark-adapted Ubipro:OsSnRK1A1-EGFP transgenic rice seedlings, followed by immunoprecipitation with anti-HA antibodies. Lower panel: Calli derived from Ubipro:JMJ705-3xFLAG plants were transformed with OsSnRK1A1pro:OsSnRK1A1-EGFP or 35Spro:EGFP, followed by immunoprecipitation with anti-FLAG beads. The constructs are shown on the right.
Figure 5
Figure 5
Starvation induces OsSnRK1A1 nuclear enrichment. A, Upper part: schematic diagram of the constructs. OsSnRK1A1-EGFP was transiently infiltrated into N. benthamiana leaves, followed by transfer into darkness at ZT 5. The subcellular localization of OsSnRK1A1-EGFP was observed at different times by confocal microscopy. Scale bars, 20 μm. Number and ratio of cells displaying nuclear or cytoplasmic localization in normal or starvation conditions are shown. Lower part: OsSnRK1A1-EGFP levels (based on GFP detection) in nuclear and cytoplasmic protein fractions extracted during starvation (extended darkness) treatment and in normal conditions. Anti-H3 and anti-actin were used as nuclear and cytoplasmic protein controls. The replicates are shown in Supplemental Figure S6C. B, Co-localization of OsSnRK1A1 and JMJ705 in N. benthamiana epidermal cells under normal and starvation conditions. Fluorescence signals were checked 3 days after co-infiltration of 35Spro:OsSnRK1A1-EGFP (shown in A) and 35Spro:JMJ705-mCherry (on the top). Scale bars, 20 μm. The fluorescence signals of OsSnRK1A1 and JMJ705 in 30 cells were scanned and one representative cell is shown in the bottom panels.
Figure 6
Figure 6
Starvation induces phosphorylation of JMJ705. A, Immunoblot analysis of the phosphorylation of JMJ705 in Ubipro:JMJ705–3xFLAG (schematized) transgenic rice under starvation conditions. Rice plants were transferred to darkness for the indicated times and proteins were precipitated using anti-FLAG beads and analyzed with anti-Phos-serine antibody to detect phosphorylation, and by anti-FLAG antibody as control. B, Immunoblot analysis of JMJ705 phosphorylation in N. benthamiana leaves infiltrated with 35Spro:JMJ705ΔC-mCherry (schematized on the top) under starvation conditions. Three days after infiltration, plants were kept in a dark room for 0, 3, 4, or 5 days, and harvested in the same time each day for nuclear protein extraction. Anti-mCherry antibody was used to detect JMJ705ΔC-mCherry fused protein. Phos-tag PAGE gel was used for phosphorylated protein detection (upper) and normal SDS–PAGE gel was used as control. The arrow indicates phosphorylated JMJ705ΔC-mCherry.
Figure 7
Figure 7
OsSnRK1A1 phosphorylates JMJ705. A, Sequence alignment of conserved SnRK1 recognition motifs in JMJ705 as candidate phosphorylation sites. B, In vitro phosphorylation assay of intact GST-JMJ705ΔC and Ser to Ala mutants by OsSnRK1A1 and its upstream kinase OsSnAK2. The phosphorylation state of JMJ705 was detected by Phos-tag gel immunoblots with anti-GST. Regular immunoblot with anti-GST was used as control. C, In vitro kinase assay of full-length JMJ705 with OsSnRK1A1. N. benthamiana leaves were infiltrated with JMJ705-HA-FLAG and JMJ705 protein was purified by anti-FLAG beads. The phosphorylation state of JMJ705 was detected by Phos-serine antibody. Immunoblotting with anti-FLAG was used as loading control. D, Sequence alignment of the Ser-76-containing region between several histone H3K27me3 demethylases from Arabidopsis and rice (JMJ705, REF6, ELF6, and JMJ13). The sequences were aligned with ClustalΩ. Magenta box, position of Ser-76 in JMJ705; blue boxes, conserved JmjN domain; green box, JmjC domain. E, Phosphorylation of JMJ705 by OsSnRK1A1 is inhibited by Compound C. Phosphorylation of JMJ705 by OsSnRK1A1 at different Compound C concentrations (0, 5, 10, 20, 40, and 80 µM), as analyzed by Phos-tags gel as in (B).
Figure 8
Figure 8
JMJ705 phosphorylation at Ser-76 enhances its H3K27me3 demethylase activity in vitro. A, Tests of JMJ705 H3K27me3 demethylase activity in vitro. Recombinant GST-JMJ705CD (aa 1–445) was incubated with histone H3 (aa 21–44) K27me3 peptide (120 µM) in reaction buffer at 25°C for 4 h; GST was used as control. H3K27me2 production was tested by immunoblots using anti-H3K27me2, with anti-H3K27me3 used to detect the initial amount of H3K27me3 peptide before reaction. Anti-GST was used for the GST fusion proteins. B, Tests of JMJ705 H3K4me3 demethylase activity, as in (A). Anti-H3K4me2 was used to detect the demethylation product. No H3K4me2 was produced in the assays. C, Tests of H3K27me3 demethylase activity of JMJ705 S76A (preventing phosphorylation) and S76D (phosphorylation mimic) mutants in comparison to intact JMJ705. Upper: about 5 µM of JMJ705CD-GST, JMJ705CD-S76A-GST, and JMJ705CD-S76D-GST proteins were incubated with H3 (21–44) K27me3 peptide. The production of H3K27me2 was detected as in (A). Lower: quantification of in vitro demethylation products by MALDI-TOF mass spectrometry (Supplemental Figure S7, D and E). Three independent replicates were performed. Significances of differences between WT and mutant JMJ705 proteins were tested (Student’s t test) (*P < 0.05, **P < 0.01, ***P < 0.001; ns, not significant). D, Test of JMJ705 demethylase activity on histone H3K27me2 peptides. Upper: H3K27me1 production was tested by immunoblots with anti-H3K27me1, with anti-H3K27me2 used to detect the initial amount of H3K27me2 peptide. Two repeats are shown. Lower panel: quantification of immunoblots. NA, no protein added. Three independent replicates were performed and H3K27me2 or H3K27me1 levels were quantified by ImageJ2x. Error bars are means se.
Figure 9
Figure 9
OsSnRK1A1 stimulates JMJ705 demethylase activity in vivo. A, Immunostaining assays of in vivo H3K27me3 demethylase activity of JMJ705 and its S76A/D mutants. Upper: schematic diagram of the 35Spro:JMJ705-2xHA-2xFLAG (J5) infiltrated into N. benthamiana leaves. After 3 days in the dark, nuclei were isolated and visualized by DAPI staining (blue), tested for accumulation of the fusion protein by HA fluorescence (green) and for histone methylation levels by anti-H3K27me3 immunostaining (red). DAPI-stained nuclei from cells expressing JMJ705 or its variants are indicated by white arrows. H3K27me3 signals are indicated by green arrows. Scale bars, 40 μm. Anti-H3K27me3 fluorescence was quantified from at least 30 pairs of infiltrated and control nuclei in the same field of view. The y-axis represents relative fluorescence to control nuclei (set to 1) and each point represents a single pair of nuclei. All comparisons for statistical tests are relative to JMJ705-WT. Data are shown as means ± se. Difference between JMJ705-WT and the mutants were tested by one-way ANOVA. B, Effect of OsSnRK1A1 on JMJ705 demethylase activity. J5-WT or its S76A mutant was co-inilftrated with 35Spro:OsSnRK1A1-EGFP (S1A1-WT) into N. benthamiana leaves. The abundance of OsSnRK1A1 was detected by anti-GFP antibody (yellow), the abundance of JMJ705 and H3K27me3, H3K27me2 levels were detected as described in (A). DAPI-stained nuclei from leaves that were infiltrated with either OsSnRK1A1 (or variants) or JMJ705 (or variants) are indicated by white arrows. H3K27me3 signals in nuclei infiltrated with OsSnRK1A1 or JMJ705 constructs alone are indicated by yellow and green arrows, respectively; H3K27me3 signals in nuclei from leaves co-infiltrated with OsSnRK1A1 and JMJ705 constructs are indicated by white arrows. More than 38 pairs of infiltrated and control nuclei in the same field of view were observed and quantified as in (A). Data are shown as means ± se. One-way ANOVA test was used.
Figure 10
Figure 10
Global H3K27me3 levels decrease slightly upon starvation stress in rice. A, Scatterplots of WT H3K27me3 levels between normal and starvation conditions. H3K27me3 peaks merged from all samples (n=8,363) are shown. The x-axis and y-axis represent normalized read number at each peak under normal and starvation conditions, respectively. Brown dots represent starvation downregulated peaks; blue dots represent starvation upregulated peaks; differential H3K27me3 peaks (fold-change >1.5, P < 0.01) overlapping between two replicates were considered significantly changed. B, Metaplots of H3K27me3 levels in all (nontransposable element) genes under starvation and normal conditions in WT and jmj705-1. The x-axis represents relative genomic coordinates, and the y-axis represents relative enrichment of H3K27me3. C, Comparison of H3K27me3 changes (hyper peaks in brown, hypo peaks in blue) in wild-type and jmj705-1 under starvation versus normal conditions. Numbers indicate the number of peaks identified in both wild-type and mutant. D, Venn diagram of the extent of overlap between genes with reduced H3K27me3 levels and increased expression under starvation conditions. E, Integrative Genomics Viewer visualization of 16 representative genes from 192 overlapping genes identified in (D), with lower H3K27me3 levels and increased expression. ChIP-seq and RNA-seq data in normal and starvation conditions are shown. F, Anti-FLAG ChIP-qPCR analysis of 21 representative genes for JMJ705 binding in JMJ705-FLAG (OXJ5#2) and WT (ZH11) control plants grown under starvation conditions. Anti-IgG was used as negative control. Data are shown as means ± se from three biological replicates. Student’s t test was used to calculate the P-value. Significances of differences between WT at starvation and normal conditions and between mutants and WT at starvation were tested (Student t test, *P < 0.05, **P < 0.01, ***P < 0.001).
None

Similar articles

Cited by

References

    1. Avila-Castaneda A, Gutierrez-Granados N, Ruiz-Gayosso A, Sosa-Peinado A, Martinez-Barajas E, Coello P (2014) Structural and functional basis for starch binding in the SnRK1 subunits AKINbeta2 and AKINbetagamma. Front Plant Sci 5: 199. - PMC - PubMed
    1. Baena-Gonzalez E, Hanson J (2017) Shaping plant development through the SnRK1-TOR metabolic regulators. Curr Opin Plant Biol 35: 152–157 - PubMed
    1. Baena-Gonzalez E, Rolland F, Thevelein JM, Sheen J (2007) A central integrator of transcription networks in plant stress and energy signalling. Nature 448: 938–942 - PubMed
    1. Broeckx T, Hulsmans S, Rolland F (2016) The plant energy sensor: evolutionary conservation and divergence of SnRK1 structure, regulation, and function. J Exp Bot 67: 6215–6252 - PubMed
    1. Chan A, Carianopol C, Tsai AY, Varatharajah K, Chiu RS, Gazzarrini S (2017) SnRK1 phosphorylation of FUSCA3 positively regulates embryogenesis, seed yield, and plant growth at high temperature in Arabidopsis. J Exp Bot 68: 4219–4231 - PMC - PubMed

Publication types