. 2021 Oct;78(19-20):6645-6667.
doi: 10.1007/s00018-021-03933-4. Epub 2021 Sep 8.

Defects in the STIM1 SOARα2 domain affect multiple steps in the CRAC channel activation cascade

Affiliations

Defects in the STIM1 SOARα2 domain affect multiple steps in the CRAC channel activation cascade

Carmen Höglinger et al. Cell Mol Life Sci. 2021 Oct.

Abstract

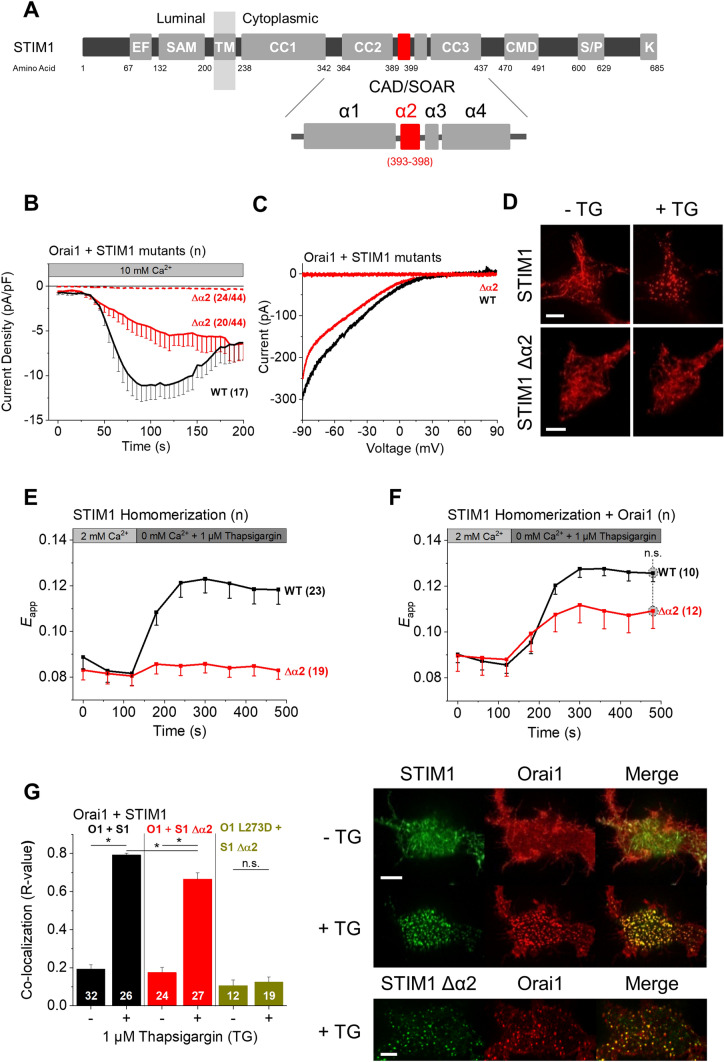
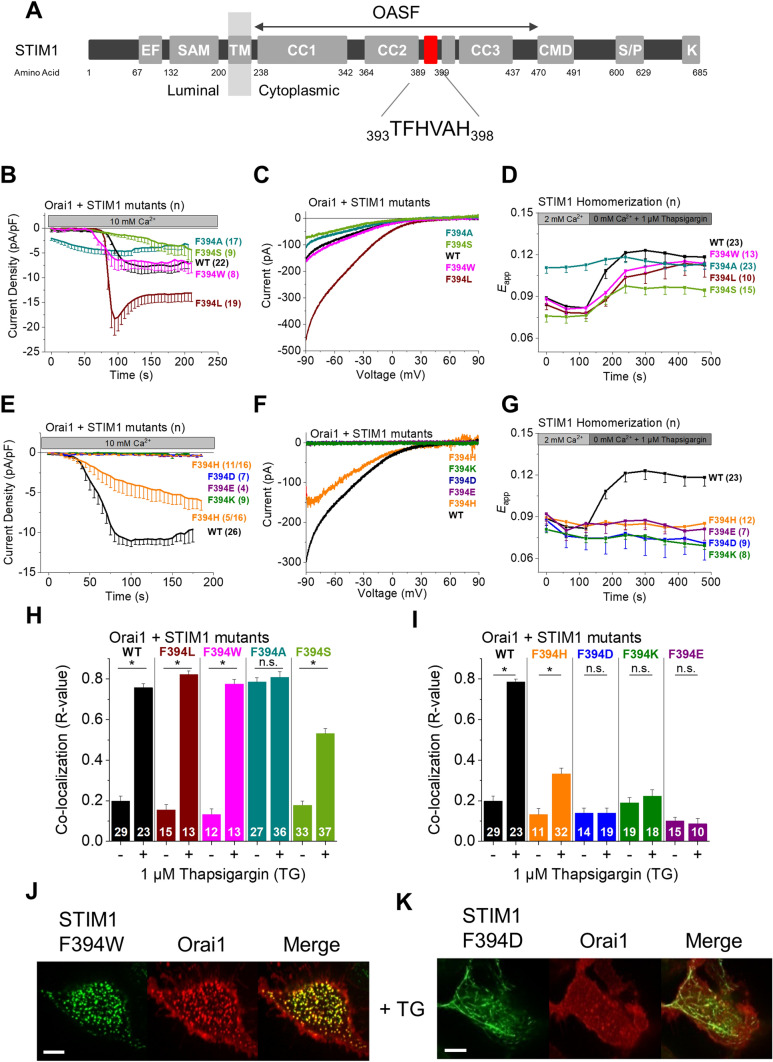
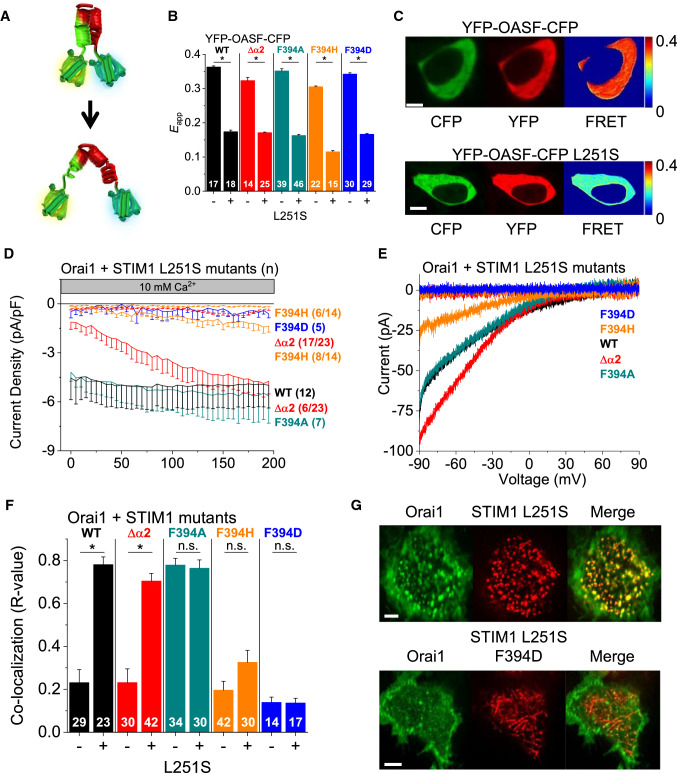
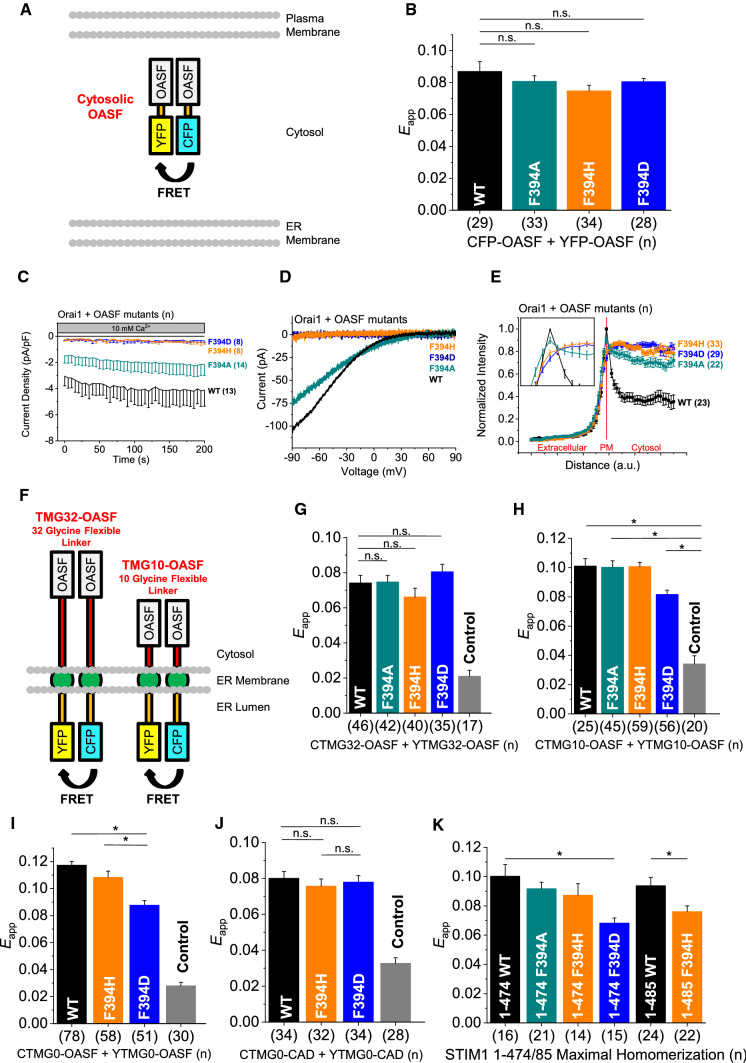
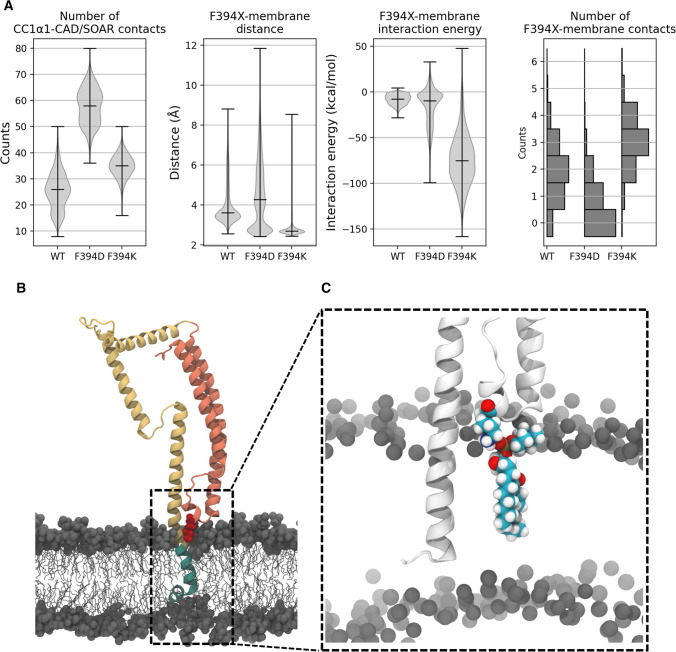
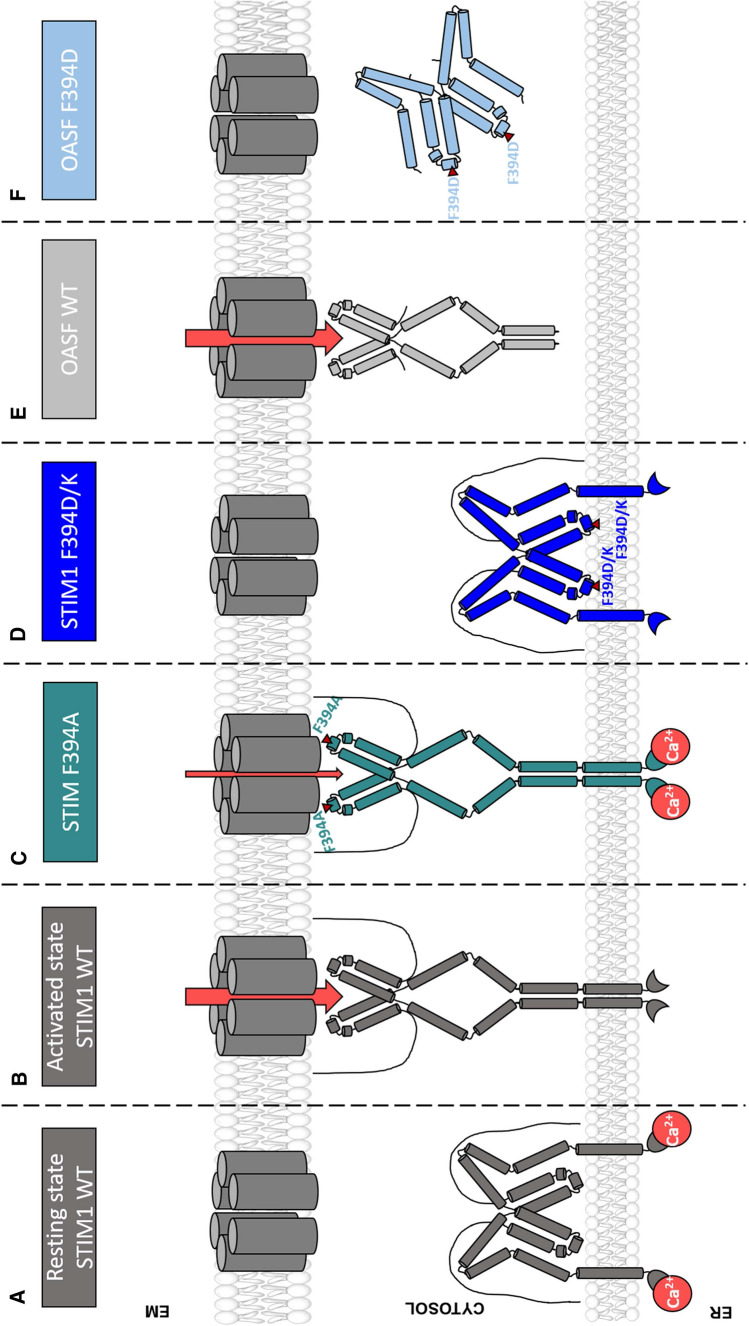
The calcium release-activated calcium (CRAC) channel consists of STIM1, a Ca2+ sensor in the endoplasmic reticulum (ER), and Orai1, the Ca2+ ion channel in the plasma membrane. Ca2+ store depletion triggers conformational changes and oligomerization of STIM1 proteins and their direct interaction with Orai1. Structural alterations include the transition of STIM1 C-terminus from a folded to an extended conformation thereby exposing CAD (CRAC activation domain)/SOAR (STIM1-Orai1 activation region) for coupling to Orai1. In this study, we discovered that different point mutations of F394 in the small alpha helical segment (STIM1 α2) within the CAD/SOAR apex entail a rich plethora of effects on diverse STIM1 activation steps. An alanine substitution (STIM1 F394A) destabilized the STIM1 quiescent state, as evident from its constitutive activity. Single point mutation to hydrophilic, charged amino acids (STIM1 F394D, STIM1 F394K) impaired STIM1 homomerization and subsequent Orai1 activation. MD simulations suggest that their loss of homomerization may arise from altered formation of the CC1α1-SOAR/CAD interface and potential electrostatic interactions with lipid headgroups in the ER membrane. Consistent with these findings, we provide experimental evidence that the perturbing effects of F394D depend on the distance of the apex from the ER membrane. Taken together, our results suggest that the CAD/SOAR apex is in the immediate vicinity of the ER membrane in the STIM1 quiescent state and that different mutations therein can impact the STIM1/Orai1 activation cascade in various manners. Legend: Upon intracellular Ca2+ store depletion of the endoplasmic reticulum (ER), Ca2+ dissociates from STIM1. As a result, STIM1 adopts an elongated conformation and elicits Ca2+ influx from the extracellular matrix (EM) into the cell due to binding to and activation of Ca2+-selective Orai1 channels (left). The effects of three point mutations within the SOARα2 domain highlight the manifold roles of this region in the STIM1/Orai1 activation cascade: STIM1 F394A is active irrespective of the intracellular ER Ca2+ store level, but activates Orai1 channels to a reduced extent (middle). On the other hand, STIM1 F394D/K cannot adopt an elongated conformation upon Ca2+ store-depletion due to altered formation of the CC1α1-SOAR/CAD interface and/or electrostatic interaction of the respective side-chain charge with corresponding opposite charges on lipid headgroups in the ER membrane (right).

Keywords: CAD; CRAC channels; Molecular dynamics; OASF; Orai1; Protein-membrane interaction; SOAR; STIM1.


Conflict of interest statement

The authors declare that they have no conflict of interest with the contents of this article.

Figures

Fig. 1
Fig. 1
The STIM1 α2 domain affects STIM1 homomerization. A STIM1 domain structure with enlarged view of the CAD/SOAR fragment. The α2 domain (aa 393–398) is highlighted in red. B Time course of whole cell inward currents at − 74 mV activated by passive store depletion of HEK293 cells co-expressing Orai1 WT together with the following STIM1 constructs: STIM1 WT (wild-type) and Δα2 (Δaa 393–398). C Corresponding I/V relationships of maximum currents shown in (B). D Confocal fluorescence images of YFP-STIM1 WT and Δα2 before and after application of 1 µM TG. E Time course of FRET (Eapp) monitoring the homomerization of the respective CFP/YFP-labeled STIM1 constructs specified in (B) in response to application of 1 µM TG. F Same as in (E) but in the presence of Orai1 WT. G Left: calculated Pearson correlation coefficient (R value) as a quantitative measurement of co-localization between the indicated CFP-STIM1 mutants and YFP-Orai1 WT or L273D before and after treatment with 1 µM TG. The number n of cells is indicated within each bar. Right: confocal fluorescence images of representative cells (CFP in green, YFP in red) after treatment with 1 µM TG as well as an overlay (Merge in yellow) for visual comparison. Length of scale bars corresponds to 5 µm. Images were captured in the periphery of the cells. Data represent mean values ± SEM. HEK293 cells were used for all experiments. Student’s two-tailed t test was employed for statistical analyses with differences considered statistically significant at p < 0.05. Asterisks (*) indicate significant difference. Color code: STIM1 WT (black), STIM1 Δα2 (red), Orai1 L273D (yellow)
Fig. 2
Fig. 2
STIM1 F394 is a critical residue within the α2 domain. A STIM1 domain structure with the α2 domain (aa 393–398) highlighted in red. The OASF domain as well as the α2 amino acid sequence are indicated. B, E Time course of whole cell inward currents at − 74 mV activated by passive store depletion of HEK293 cells co-expressing Orai1 WT together with the following STIM1 constructs: STIM1 WT, F394W, F394L, F394A, F394S, F394D, F394E, F394H, and F394K. C, F Corresponding I/V relationships of maximum currents shown in (B) and (E). D, G Time course of FRET (Eapp) monitoring the homomerization of the respective CFP/YFP-labeled STIM1 constructs specified in (B) and (E) in response to 1 µM TG. H, I Calculated Pearson correlation coefficient (R value) as a quantitative measurement of co-localization between the indicated CFP-STIM1 mutants and YFP-Orai1 WT before and after treatment with 1 µM TG. The number n of cells is indicated within each bar. J, K Confocal fluorescence images of representative mutants (CFP in green, YFP in red) after treatment with 1 µM TG as well as an overlay (Merge in yellow) for visual comparison. Length of scale bars corresponds to 5 µm. Images were captured in the periphery of the cells. Data represent mean values ± SEM. HEK293 cells were used for all experiments. Student’s two-tailed t test was employed for statistical analyses with differences considered statistically significant at p < 0.05. Asterisks (*) indicate significant difference. Color code: STIM1 WT (black), F394A (dark cyan), F394D (blue), F394E (purple), F394H (orange), F394K (dark green), F394L (brown), F394W (magenta), F394S (light green)
Fig. 3
Fig. 3
F394 does not impact the conformational switch of the STIM1 OASF fragment. A Simplified depictions of YFP-OASF-CFP conformational sensor in a tight, quiescent (top) and an extended, open (bottom) state. B Intramolecular FRET (Eapp) measurements of YFP-OASF-CFP conformational sensor probing the effect of the L251S mutation on the following constructs: OASF WT, Δα2 (Δaa 393–398), F394A, F394D, and F394H. The number n of cells is indicated within each bar. C Confocal fluorescence images of representative cells (CFP in green, YFP in red) as well as a FRET image showing calculated (Eapp) on a pixel-to-pixel basis (orange = high FRET, blue = low FRET). Images were captured in the center of the cells, rendering the outline of the nuclei visible. D Time course of whole cell inward currents at − 74 mV of HEK293 cells co-expressing Orai1 WT together with the following STIM1 constructs: STIM1 L251S, L251S Δα2, L251S F394A, L251 F394D, and L251S F394H. E Corresponding I/V relationships of maximum currents shown in (D). F Calculated Pearson correlation coefficient (R value) as a quantitative measurement of co-localization between CFP-Orai1 WT and the indicated YFP-STIM1 mutants (corresponding to those in (B) in the presence and absence of the L251S mutation. The number n of cells is indicated within each bar. G Confocal fluorescence images of CFP-Orai1 WT and YFP-STIM1 L251S ± F394D (CFP in green, YFP in red) as well as an overlay (Merge in yellow) for visual comparison. Images were captured in the periphery of the cells. Length of scale bars corresponds to 5 µm. Data represent mean values ± SEM. HEK293 cells were used for all experiments. Student’s two-tailed t test was employed for statistical analyses with differences considered statistically significant at p < 0.05. Asterisks (*) indicate significant difference. Color code: WT (black), Δα2 (red), F394A (dark cyan), F394D (blue), F394H (orange)
Fig. 4
Fig. 4
F394 controls oligomerization when OASF is tightly anchored in the membrane. A Scheme of cytosolic OASF homomerization. Upon interaction of two OASF molecules, the fluorophores CFP and YFP come into close proximity, allowing FRET to occur. B Intermolecular homomerization FRET (Eapp) measurements of cytosolic CFP-OASF + YFP-OASF fragments using the following constructs: OASF WT, F394A, F394D, and F394H. C Time course of whole cell inward currents at − 74 mV of HEK293 cells co-expressing Orai1 WT together with cytosolic OASF constructs using the same mutants used in (B). D Corresponding I/V relationships of maximum currents shown in (C). E Normalized fluorescence intensity plots of cytosolic OASF constructs using the same mutants as in (B) co-expressed with Orai1 showing localization in regions close to the plasma membrane. Inset showing normalized intensity at and in the surrounding of the plasma membrane (PM). F Cartoon representation of the FIRE system. The N-terminal fluorophores CFP and YFP within the ER lumen are bound to the STIM1 TM domain. On the cytosolic C-terminal side, a flexible linker with a length of either 32 or 10 glycines (red bars) is used to attach the STIM1 OASF domain to the ER membrane. G Intermolecular FIRE (Eapp) homomerization measurements of ER membrane-bound CFP-TMG32-OASF + YFP-TMG32-OASF fragments (C/YTMG32-OASF) containing a flexible cytosolic linker consisting of 32 glycines using the same mutations as in (B). For the control, CTMG32-OASF was co-expressed with a YTMG32 construct lacking OASF (cf. Supp. Figure 14B). Control Eapp is significantly smaller than all tested OASF interactions (not indicated). HJ Same as in (G) but for ER membrane-bound C/YTMG10-OASF (H), C/YTMG0-OASF (I) or C/YTMG0-CAD (J) fragments containing a shorter flexible cytosolic linker consisting of only 10 glycines (H) or no linker (I, J). Control Eapp is significantly smaller than all tested OASF (H, I) or CAD (J) interactions (not indicated). K Intermolecular homomerization FRET (Eapp) measurements of cytosolic CFP-STIM1 1–474 + YFP- STIM1 1–474 fragments using the following constructs: STIM1 1–474 (wild-type), F394A, F394H, and F394D and CFP-STIM1 1–485 + YFP-STIM1 1–485 fragments using the following constructs: STIM1 1–485 (wild-type) and STIM1 1–485 F394H. Data represent mean values ± SEM. HEK293 cells were used for all experiments. Student’s two-tailed t test was employed for statistical analyses with differences considered statistically significant at p < 0.05. Asterisks (*) indicate significant difference. Color code: WT (black), F394A (dark cyan), F394D (blue), F394H (orange), Control (gray)
Fig. 5
Fig. 5
F394 is located close to the ER membrane in molecular dynamics simulations. A Number of CC1α1-CAD/SOAR contacts, distances between closest non-hydrogen atoms of the membrane and X394, X394-membrane interaction energy and number of contacts between X394 and the membrane (X = F,D,K). Medians and extrema are denoted by a black line. B Side-view of the F394K model. The TM, CC1 and CAD/SOAR domains are coloured in green, yellow and orange, respectively. K394 is shown in red, forming numerous contacts with lipid headgroups (grey). C Zoom-in onto the CAD/SOAR apex. K394 and one DDPC molecule, which forms near-permanent contacts with K394, are shown in space-filling representation
Fig. 6
Fig. 6
Multiple effects of F394 mutations in the α2 region on diverse steps in the STIM1/Orai1 activation cascade. A Under resting conditions in the cell, the STIM1 C-terminus is kept in a quiescent state via interactions within the inhibitory clamp. The SOAR apex is located close to the ER membrane. B Upon Ca2+ store depletion of the endoplasmic reticulum (ER), STIM1 loses its bound Ca2+ and undergoes a conformational switch into an extended state capable of binding to Orai1 channels. Following this, the channels become activated and Ca2+ can enter the cell. C STIM1 F394A is constitutively active, but activates Orai1 channels to a reduced extent. D For STIM1 F394D/K, the conformational switch upon store depletion is prevented by altered formation of the CC1α1-SOAR/CAD interface and/or the formation of electrostatic interactions to the ER membrane. E The soluble OASF fragment (aa 233–474) induces constitutive activation of Orai1. F The OASF F394D mutant is able to oligomerize as it is not attached to the ER membrane, but is still impaired in coupling to and activation of Orai1

Similar articles

Cited by

References

    1. Parekh AB, Putney JW., Jr Store-operated calcium channels. Physiol Rev. 2005;85(2):757–810. doi: 10.1152/physrev.00057.2003. - DOI - PubMed
    1. Liou J, Kim ML, Heo WD, Jones JT, Myers JW, Ferrell JE, Jr, Meyer T. STIM is a Ca2+ sensor essential for Ca2+-store-depletion-triggered Ca2+ influx. Curr Biol. 2005;15(13):1235–1241. doi: 10.1016/j.cub.2005.05.055. - DOI - PMC - PubMed
    1. Roos J, DiGregorio PJ, Yeromin AV, Ohlsen K, Lioudyno M, Zhang S, Safrina O, Kozak JA, Wagner SL, Cahalan MD, Velicelebi G, Stauderman KA. STIM1, an essential and conserved component of store-operated Ca2+ channel function. J Cell Biol. 2005;169(3):435–445. doi: 10.1083/jcb.200502019. - DOI - PMC - PubMed
    1. Prakriya M, Feske S, Gwack Y, Srikanth S, Rao A, Hogan PG. Orai1 is an essential pore subunit of the CRAC channel. Nature. 2006;443(7108):230–233. doi: 10.1038/nature05122. - DOI - PubMed
    1. Zhang SL, Yeromin AV, Zhang XHF, Yu Y, Safrina O, Penna A, Roos J, Stauderman KA, Cahalan MD. Genome-wide RNAi screen of Ca2+ influx identifies genes that regulate Ca2+ release-activated Ca2+ channel activity. Proc Natl Acad Sci. 2006;103(24):9357–9362. doi: 10.1073/pnas.0603161103. - DOI - PMC - PubMed

MeSH terms