. 2022 Mar;33(1):213-229.
doi: 10.1007/s00335-021-09914-z. Epub 2021 Sep 8.

Best practices for analyzing imputed genotypes from low-pass sequencing in dogs

Affiliations

Best practices for analyzing imputed genotypes from low-pass sequencing in dogs

Reuben M Buckley et al. Mamm Genome. 2022 Mar.

Abstract

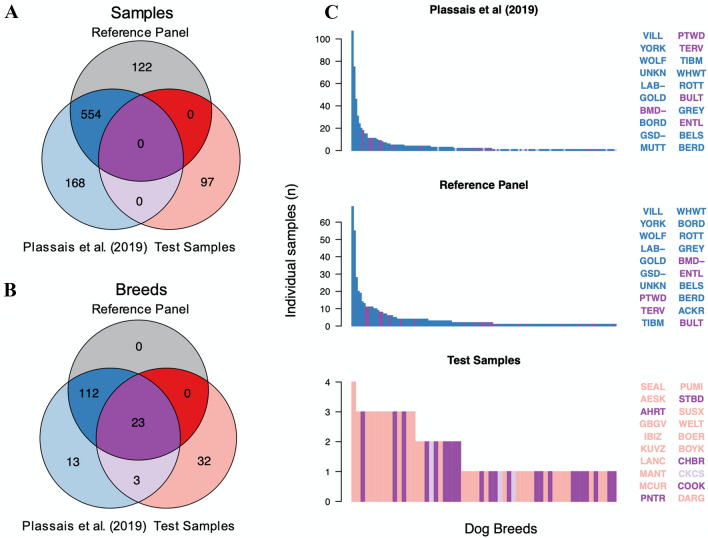
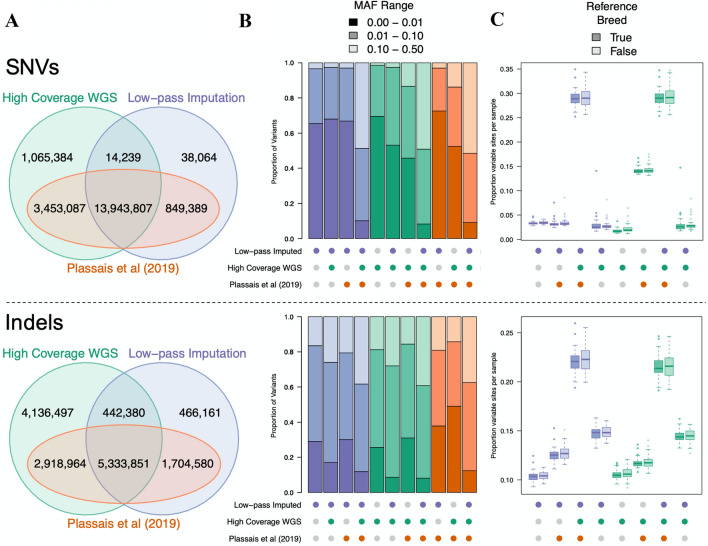
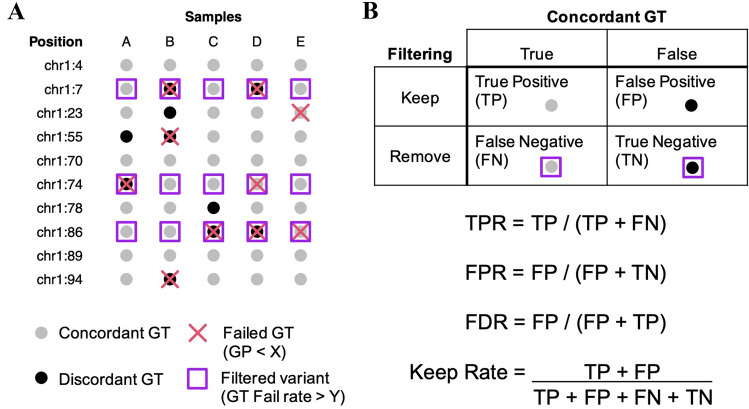
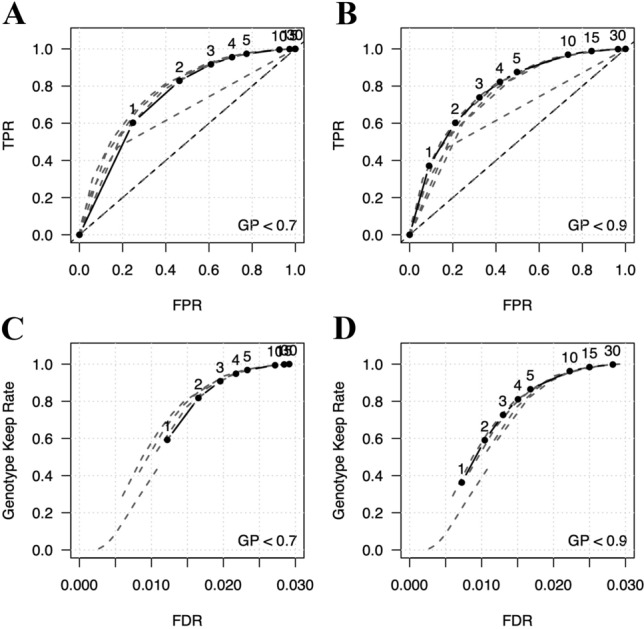
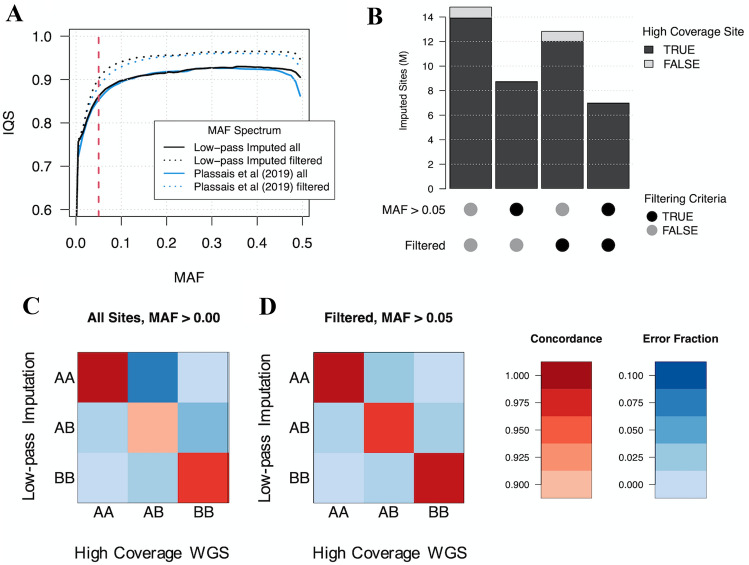
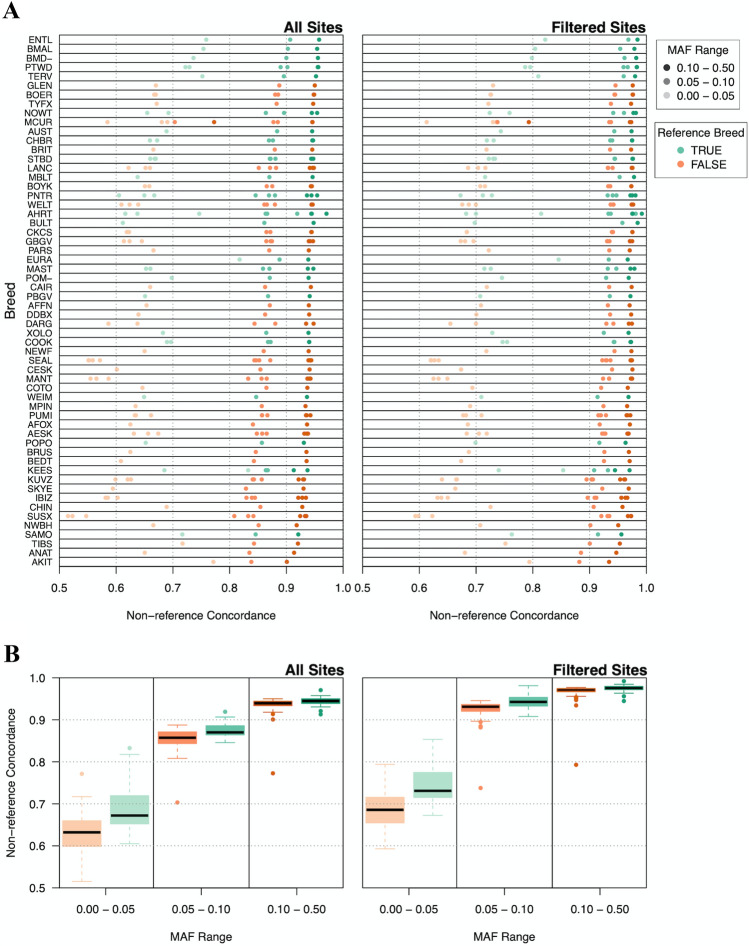
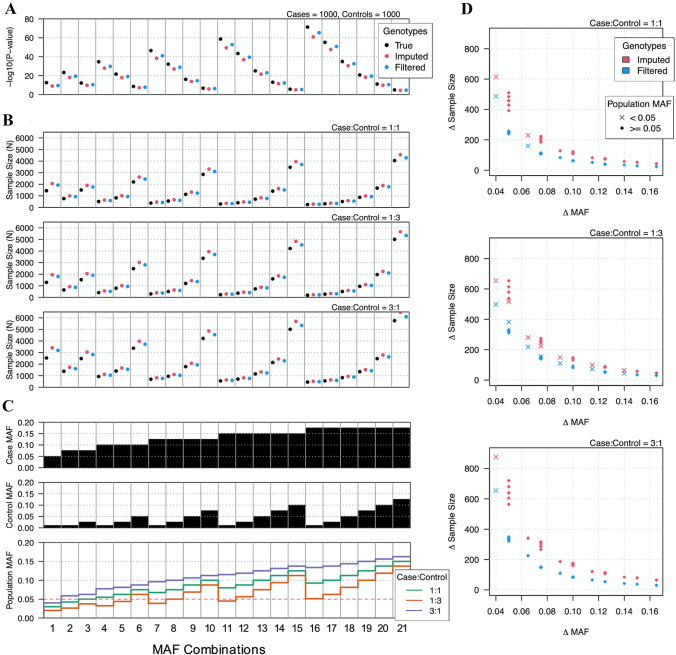
Although DNA array-based approaches for genome-wide association studies (GWAS) permit the collection of thousands of low-cost genotypes, it is often at the expense of resolution and completeness, as SNP chip technologies are ultimately limited by SNPs chosen during array development. An alternative low-cost approach is low-pass whole genome sequencing (WGS) followed by imputation. Rather than relying on high levels of genotype confidence at a set of select loci, low-pass WGS and imputation rely on the combined information from millions of randomly sampled low-confidence genotypes. To investigate low-pass WGS and imputation in the dog, we assessed accuracy and performance by downsampling 97 high-coverage (> 15×) WGS datasets from 51 different breeds to approximately 1× coverage, simulating low-pass WGS. Using a reference panel of 676 dogs from 91 breeds, genotypes were imputed from the downsampled data and compared to a truth set of genotypes generated from high-coverage WGS. Using our truth set, we optimized a variant quality filtering strategy that retained approximately 80% of 14 M imputed sites and lowered the imputation error rate from 3.0% to 1.5%. Seven million sites remained with a MAF > 5% and an average imputation quality score of 0.95. Finally, we simulated the impact of imputation errors on outcomes for case-control GWAS, where small effect sizes were most impacted and medium-to-large effect sizes were minorly impacted. These analyses provide best practice guidelines for study design and data post-processing of low-pass WGS-imputed genotypes in dogs.


Conflict of interest statement

All authors declare no competing interests and that the presented work is original.

Figures

Fig. 1
Fig. 1
Test samples belong to a wide variety of breeds with most breeds likely not found within the imputation reference panel. a Sample membership within each dataset. Reference panel IDs could not always be linked to a publicly available dataset. b Breed membership among each dataset. Reference panel dogs whose IDs could not be linked to a publicly available sample have no breed label. c Breed frequency across each dataset. Using the colors from the Venn diagram in B, bar colors represent the population a specific breed can be found in. Labels to the left of each bar chart identify the 20 most common breeds. Breeds in bar charts are sorted by most to least common
Fig. 2
Fig. 2
Genomic variant positions and their corresponding alleles are consistent across datasets. a Venn diagrams for SNVs and indels showing variants unique and shared across datasets. Datasets include the high-coverage WGS variant sites and low-pass imputed variant sites found across the 97 test samples and variants discovered in Plassais et al. (2019). Variants were identified as shared across datasets if the variant position, reference allele, and alternate allele were identical. b MAF distribution of each variant group from A. Variant groups are indicated by colored circles beneath the bar chart. Groups contain variants which are the intersect between the colored circles and do not contain variants found in the datasets represented by the gray circles. The color of each bar indicates the dataset used to calculate the MAF distribution and the shading level indicates the relevant MAF range. c Sites per sample in each variant group, where variant groups are presented as in B. Sites per sample are measured as the proportion of total sites within the relevant variant group that contain a non-reference allele for a particular sample. Samples have also been divided into two groups based on whether the respective breed also belongs to the Plassais et al. (2019) dataset and is, therefore, likely used in the imputation reference panel
Fig. 3
Fig. 3
Filtering strategies for reducing imputation errors. a Schematic of imputed genotypes. Genotypes are represented as filled in circles, where black circles indicate discordant genotypes and gray circles indicate concordant genotypes. In this example, the genotypes themselves, such as heterozygous and homozygous, are hidden as they are not relevant. Generally, genotype concordance between actual and imputed data remains unknown and other alternative metrics are used to filter out sites that likely contain an abundance of imputation errors. Here, max genotyping probability (GP) is used to assess genotyping confidence. GP below a certain threshold, X, identifies low-confidence genotypes, which are marked with a red cross. Genomic positions that contain greater than a certain number of low-confidence genotypes are filtered out as their low-confidence genotyping rate is above the threshold Y. Here, sites with a low-confidence genotyping rate > 20%, or 1 out of 5 samples, are marked with purple squares. Ideally, sites removed by filtering are enriched for discordant genotypes. b The statistics are used to assess and compare filtering strategies. These include, true-positive rare (TPR), false-positive rate (FPR), false discovery rate (FDR), and keep rate, which is measured as the proportion of genotypes remaining after filtering
Fig. 4
Fig. 4
Performance of filtering strategies for reducing imputation errors. a ROC curve, where genotypes with GP < 0.7 are identified as low confidence (solid line). Numbers above each point along the solid line represent low-confidence rate thresholds for removing sites. These values and their ordering are identical across all four panels. Sites with a total number of low-confidence genotypes greater than or equal to the threshold are removed. Gray dashed lines represent ROC curves for other confidence threshold values. b ROC curve for confidence threshold set at GP < 0.9. c The proportion of variants remaining after filtering genotypes at GP < 0.7 and the corresponding FDR. As in C, the numbers above each point represent low-confidence rate threshold values and gray dashed lines represent curves for other confidence thresholds. d Proportion of variants remaining and their corresponding FDR after filtering at GP < 0.9
Fig. 5
Fig. 5
Imputation accuracy according to minor allele frequency and genotype. a Imputation accuracy according to imputed and Plassais et al. (2019) MAFs for all sites and quality-filtered sites. Imputation accuracy is measured as mean imputation quality score (IQS), an imputation accuracy statistic that accounts for the probability an allele is correctly imputed by chance. The red dotted line indicates a MAF of 0.05. b The number of sites remaining after filtering for MAF > 0.05 and for low-confidence genotypes < 5% as indicated by the “Filtered” label. Bar colors represent imputed sites that were either found or missing from the high-coverage WGS dataset. c Concordance and error rates for all genotypes, expressed as a fraction of the total number of high-coverage WGS genotypes. d Concordance and error rates for genotypes in sites with < 5% low-confidence genotypes and MAFs > 0.05. Rates are expressed as a fraction of the number of high-coverage WGS genotypes that meet the corresponding filtering criteria
Fig. 6
Fig. 6
Imputation accuracy of dog breeds. a Individual dog breed imputation accuracy. Dog breeds are displayed on the Y axis with imputation accuracy on the X axis as non-reference concordance. Accuracy rates are displayed for all sites (left) and sites that remain after quality filtering (right). The shading of each data point indicates imputation accuracy of SNVs within a specific MAF range. Green data points indicate breeds present in the reference panel, while orange points indicate breeds absent from the reference panel. Breeds are ranked according to their median imputation accuracy for all sites. Imputation accuracies are displayed for each member of the breed. b Imputation accuracy of reference and non-reference breeds according to MAF
Fig. 7
Fig. 7
Impact of imputation errors on case–control GWAS. a Significance of case–control GWAS at multiple MAFs. True genotypes are represented by black circles, where the frequency of heterozygous and homozygous variants follow Hardy–Weinberg equilibrium. Red circles represent the outcomes of significance testing on imputed genotypes, while blue circles represent outcomes after filtering imputed genotypes. Note, decreases in significance were due to estimates of errors introduced during the process of imputation. Imputation errors were modeled according to the probability of a given genotype being imputed as any other genotype at any stated MAF. b Power analysis of significance testing for case–control GWAS of true and imputed genotypes. Y axis shows required samples size to reach a statistical power of 0.80. Each individual plot shows different case–control ratios. Power was calculated for a 2 × 2 chi-square test for significance level 5 × 10–8, where effect size was calculated as Cohen’s w. c Case and control MAFs used for each significance test analysis and the combined population allele frequency for each case and control configuration. Panels (ac) are arranged in columns so that results presented in a and b correspond to the MAF configurations and values displayed in (c). d Additional samples required to reach sufficient power for imputed genotypes. Delta sample size is the difference between required sample sizes for true genotypes and imputed or quality-filtered imputed genotypes. Delta MAF is the difference in MAFs between cases and controls. Delta MAF is proportional to effect size

References

    1. Ali MB, Evans JM, Parker HG, Kim J, Pearce-Kelling S, Whitaker DT, Plassais J, Khan QM, Ostrander EA. Genetic analysis of the modern Australian Labradoodle dog breed reveals an excess of the poodle genome. PLoS Genet. 2020;16:e1008956. - PMC - PubMed
    1. Awano T, Johnson GS, Wade CM, Katz ML, Johnson GC, Taylor JF, Perloski M, Biagi T, Baranowska I, Long S. Genome-wide association analysis reveals a SOD1 mutation in canine degenerative myelopathy that resembles amyotrophic lateral sclerosis. Proc Natl Acad Sci. 2009;106:2794–2799. - PMC - PubMed
    1. Bai WY, Zhu XW, Cong PK, Zhang XJ, Richards JB, Zheng HF. Genotype imputation and reference panel: a systematic evaluation on haplotype size and diversity. Brief Bioinform. 2019 doi: 10.1093/bib/bbz108. - DOI - PubMed
    1. Benjelloun B, Boyer F, Streeter I, Zamani W, Engelen S, Alberti A, Alberto FJ, BenBati M, Ibnelbachyr M, Chentouf M, Bechchari A, Rezaei HR, Naderi S, Stella A, Chikhi A, Clarke L, Kijas J, Flicek P, Taberlet P, Pompanon F. An evaluation of sequencing coverage and genotyping strategies to assess neutral and adaptive diversity. Mol Ecol Resour. 2019;19:1497–1515. - PMC - PubMed
    1. Boyko AR, Quignon P, Li L, Schoenebeck JJ, Degenhardt JD, Lohmueller KE, Zhao K, Brisbin A, Parker HG, vonHoldt BM, Cargill M, Auton A, Reynolds A, Elkahloun AG, Castelhano M, Mosher DS, Sutter NB, Johnson GS, Novembre J, Hubisz MJ, Siepel A, Wayne RK, Bustamante CD, Ostrander EA. A simple genetic architecture underlies morphological variation in dogs. PLoS Biol. 2010;8:e1000451. - PMC - PubMed

Publication types

LinkOut - more resources