

A meta-analysis of deep brain structural shape and asymmetry abnormalities in 2,833 individuals with schizophrenia compared with 3,929 healthy volunteers via the ENIGMA Consortium
- PMID: 34498337
- PMCID: PMC8675416
- DOI: 10.1002/hbm.25625
A meta-analysis of deep brain structural shape and asymmetry abnormalities in 2,833 individuals with schizophrenia compared with 3,929 healthy volunteers via the ENIGMA Consortium
Abstract
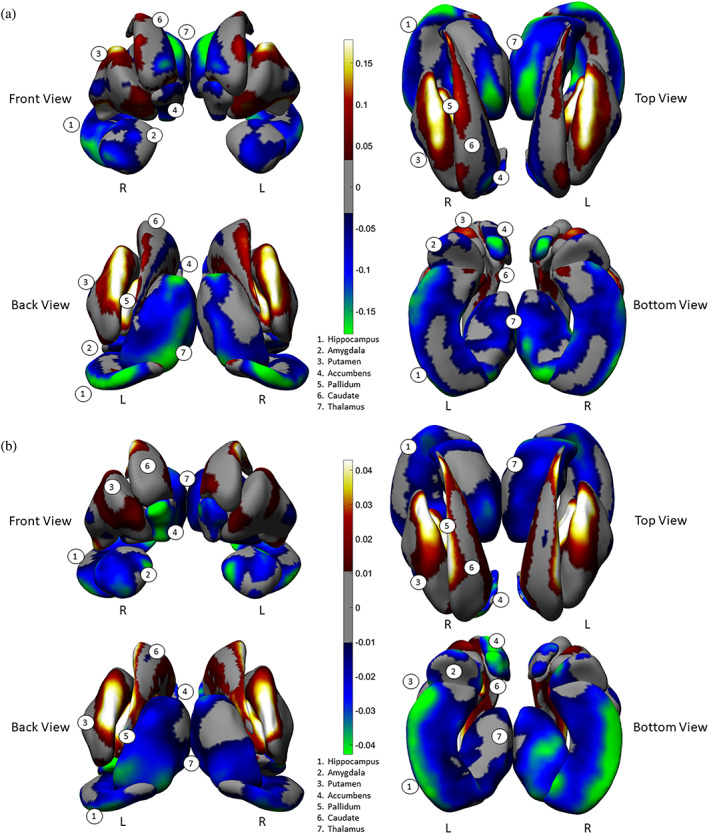
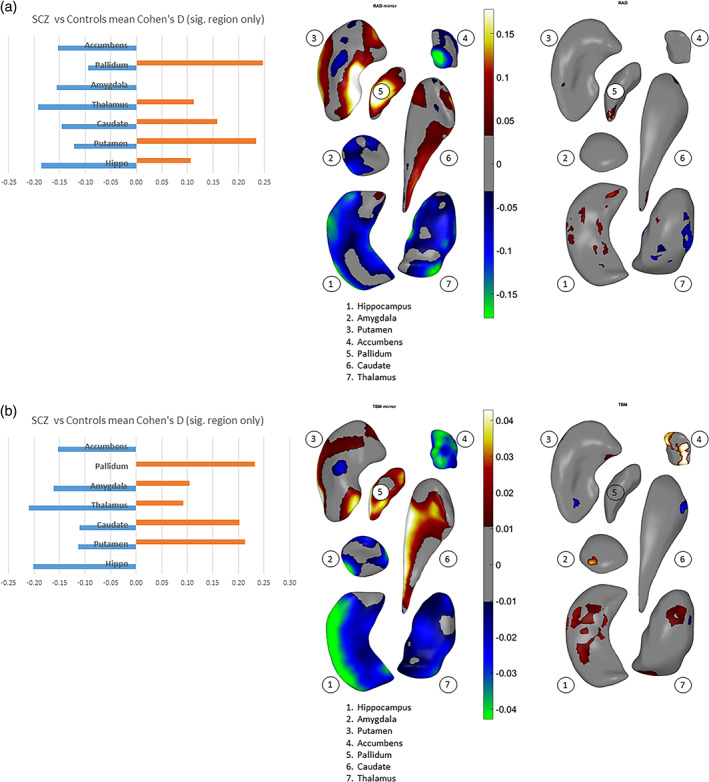
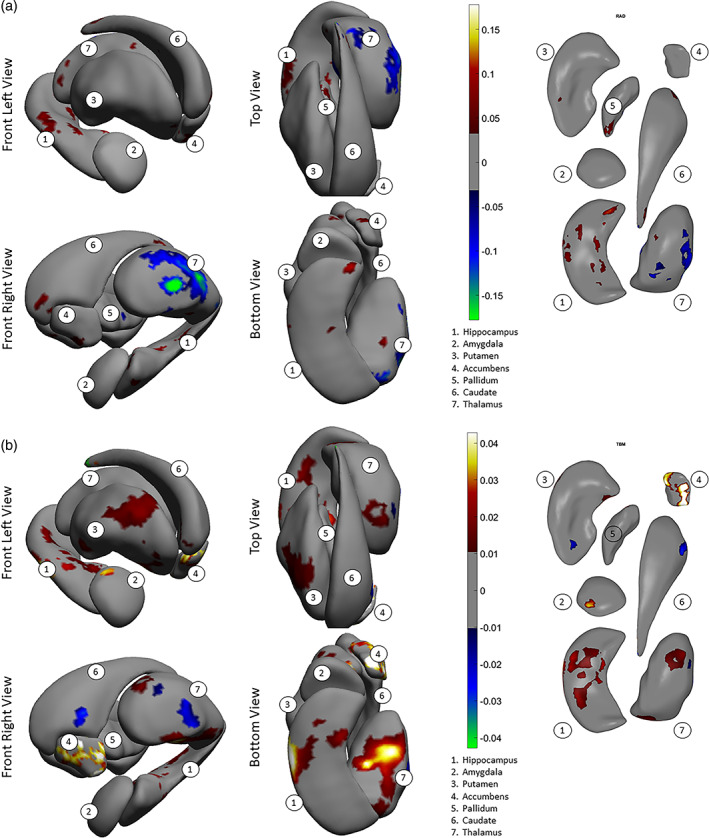
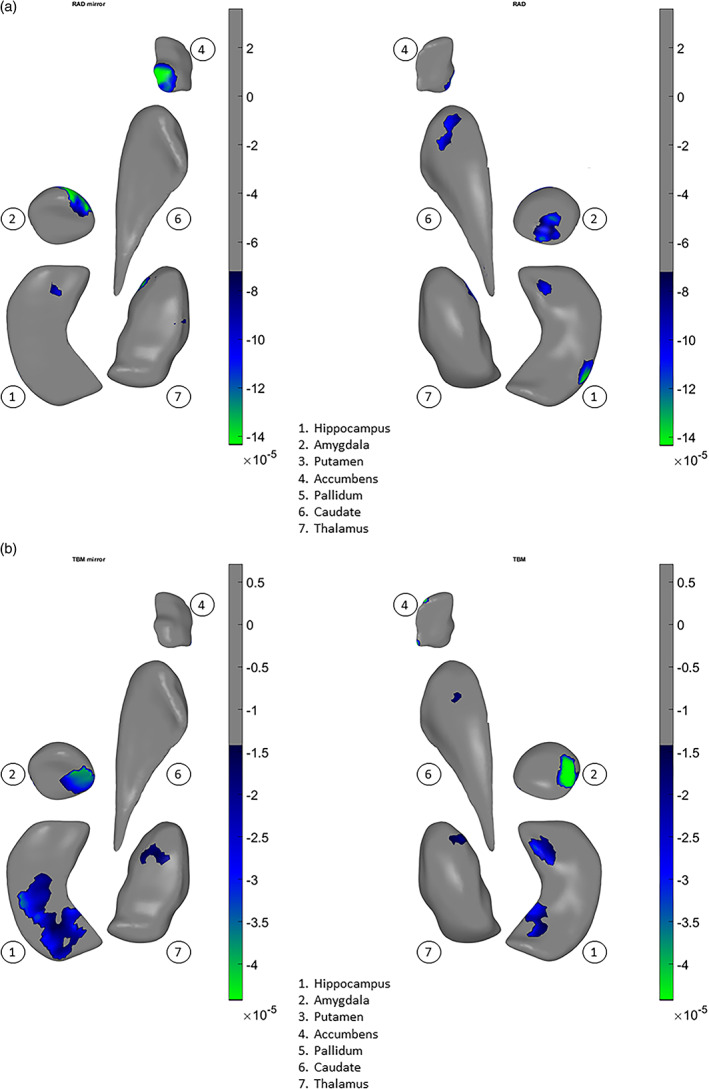
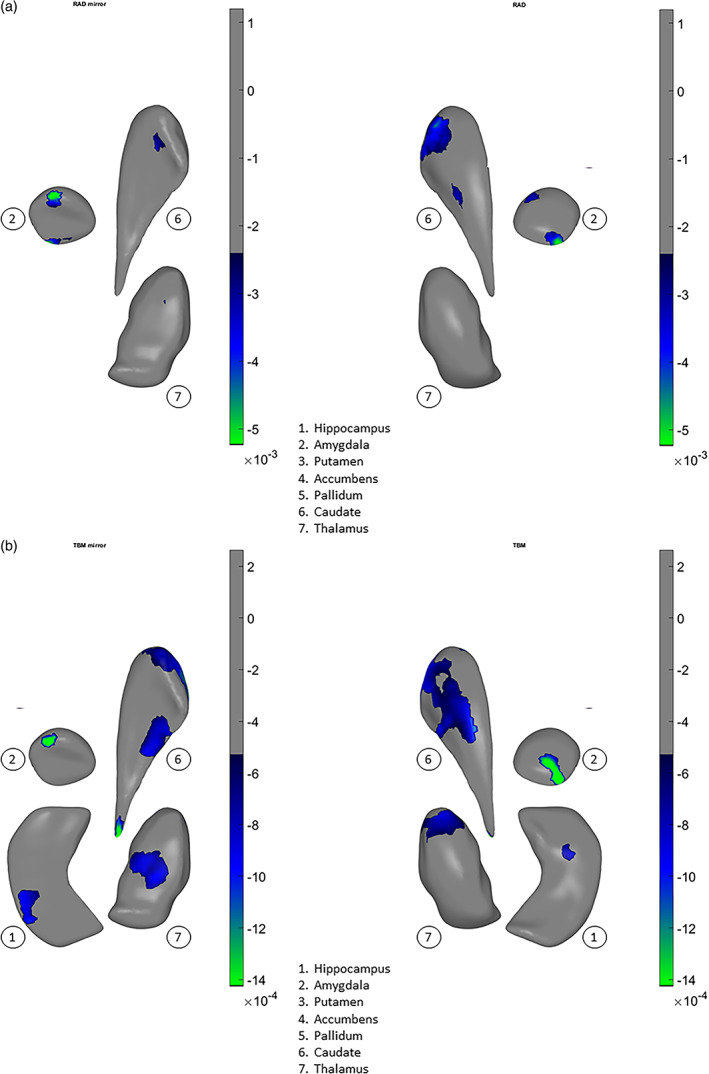
Schizophrenia is associated with widespread alterations in subcortical brain structure. While analytic methods have enabled more detailed morphometric characterization, findings are often equivocal. In this meta-analysis, we employed the harmonized ENIGMA shape analysis protocols to collaboratively investigate subcortical brain structure shape differences between individuals with schizophrenia and healthy control participants. The study analyzed data from 2,833 individuals with schizophrenia and 3,929 healthy control participants contributed by 21 worldwide research groups participating in the ENIGMA Schizophrenia Working Group. Harmonized shape analysis protocols were applied to each site's data independently for bilateral hippocampus, amygdala, caudate, accumbens, putamen, pallidum, and thalamus obtained from T1-weighted structural MRI scans. Mass univariate meta-analyses revealed more-concave-than-convex shape differences in the hippocampus, amygdala, accumbens, and thalamus in individuals with schizophrenia compared with control participants, more-convex-than-concave shape differences in the putamen and pallidum, and both concave and convex shape differences in the caudate. Patterns of exaggerated asymmetry were observed across the hippocampus, amygdala, and thalamus in individuals with schizophrenia compared to control participants, while diminished asymmetry encompassed ventral striatum and ventral and dorsal thalamus. Our analyses also revealed that higher chlorpromazine dose equivalents and increased positive symptom levels were associated with patterns of contiguous convex shape differences across multiple subcortical structures. Findings from our shape meta-analysis suggest that common neurobiological mechanisms may contribute to gray matter reduction across multiple subcortical regions, thus enhancing our understanding of the nature of network disorganization in schizophrenia.
Keywords: schizophrenia; structure; subcortical shape.
© 2021 The Authors. Human Brain Mapping published by Wiley Periodicals LLC.
Conflict of interest statement
One of the authors (TGMvE) has had a research contract with Otsuka Pharmaceutical. One of the authors (AP) has served as a consultant for Boehringer Ingelheim. One of the authors (DJS) has received research grants and/or honoraria from Lundbeck and Sun. One of the authors (DHM) has served as a consultant for Boehringer Ingelheim, Aptinyx, and Greenwich Biosciences. One of the authors (SC) has received grant support from AstraZeneca as co‐investigator, and has served as a speaker for Otsuka Pharmaceuticals. Authors PMT, CRKC, and NJ received a research grant from Biogen, Inc. (Boston) for research unrelated to this manuscript. The remaining authors declare no potential conflict of interest.
Figures
References
-
- Abdolmaleky, H. M. , Gower, A. C. , Wong, C. K. , Cox, J. W. , Zhang, X. , Thiagalingam, A. , … Thiagalingam, S. (2019). Aberrant transcriptomes and DNA methylomes define pathways that drive pathogenesis and loss of brain laterality/asymmetry in schizophrenia and bipolar disorder. American Journal of Medical Genetics. Part B, Neuropsychiatric Genetics, 180(2), 138–149. 10.1002/ajmg.b.32691 - DOI - PMC - PubMed
-
- Akbarian, S. , Bunney, W. E., Jr. , Potkin, S. G. , Wigal, S. B. , Hagman, J. O. , Sandman, C. A. , & Jones, E. G. (1993). Altered distribution of nicotinamide‐adenine dinucleotide phosphate‐diaphorase cells in frontal lobe of schizophrenics implies disturbances of cortical development. Archives of General Psychiatry, 50(3), 169–177. - PubMed
-
- Akbarian, S. , Vinuela, A. , Kim, J. J. , Potkin, S. G. , Bunney, W. E., Jr. , & Jones, E. G. (1993). Distorted distribution of nicotinamide‐adenine dinucleotide phosphate‐diaphorase neurons in temporal lobe of schizophrenics implies anomalous cortical development. Archives of General Psychiatry, 50(3), 178–187. - PubMed
-
- Arnold, S. E. , Franz, B. R. , Gur, R. C. , Gur, R. E. , Shapiro, R. M. , Moberg, P. J. , & Trojanowski, J. Q. (1995). Smaller neuron size in schizophrenia in hippocampal subfields that mediate cortical‐hippocampal interactions. The American Journal of Psychiatry, 152(5), 738–748. 10.1176/ajp.152.5.738 - DOI - PubMed
Publication types
MeSH terms
Grants and funding
- T32 MH073526/NH/NIH HHS/United States
- P50 HD105351/HD/NICHD NIH HHS/United States
- MH098130/NH/NIH HHS/United States
- I01 CX000497/CX/CSRD VA/United States
- R01EB015611/NH/NIH HHS/United States
- U54 EB020403/EB/NIBIB NIH HHS/United States
- U54 EB020403/NH/NIH HHS/United States
- R21 MH097196/NH/NIH HHS/United States
- 072894/2/03/Z/WT_/Wellcome Trust/United Kingdom
- R37MH43375/NH/NIH HHS/United States
- P50 MH071616/NH/NIH HHS/United States
- T32 AG058507/NH/NIH HHS/United States
- 1RC1MH089257/NH/NIH HHS/United States
- R01 EB015611/EB/NIBIB NIH HHS/United States
- MH064045/NH/NIH HHS/United States
- R01 HD050735/NH/NIH HHS/United States
- G0500092/MRC_/Medical Research Council/United Kingdom
- U54EB020403/NH/NIH HHS/United States
- P41RR14075/NH/NIH HHS/United States
- UL1 TR000153/NH/NIH HHS/United States
- R01 DA053028/NH/NIH HHS/United States
- R01 MH116147/MH/NIMH NIH HHS/United States
- U24 RR021992/NH/NIH HHS/United States
- U24RR021992/NH/NIH HHS/United States
- U01 MH097435/NH/NIH HHS/United States
- U24 RR021382A/NH/NIH HHS/United States
- MO1 RR025758/NH/NIH HHS/United States
- 12/IP/1359/SFI_/Science Foundation Ireland/Ireland
- R01 EB020062/EB/NIBIB NIH HHS/United States
- RF1 MH123163/MH/NIMH NIH HHS/United States
- MH 60722/NH/NIH HHS/United States
- 08/IN.1/B1916/SFI_/Science Foundation Ireland/Ireland
- UL1 TR000153/TR/NCATS NIH HHS/United States
- UL1 TR001414/TR/NCATS NIH HHS/United States
- MH085096/NH/NIH HHS/United States
- WT_/Wellcome Trust/United Kingdom
- R21MH097196/NH/NIH HHS/United States
- R01 MH116147/NH/NIH HHS/United States
- S10 OD023696/OD/NIH HHS/United States
- R01EB005846/NH/NIH HHS/United States
- TR000153/NH/NIH HHS/United States
- R01 MH117601/NH/NIH HHS/United States
- R01 MH056584/NH/NIH HHS/United States
- MH019112/NH/NIH HHS/United States
- U24 RR025736/NH/NIH HHS/United States
- R01MH074797/NH/NIH HHS/United States
- R01 MH084803/NH/NIH HHS/United States
- R01 EB020062/NH/NIH HHS/United States
LinkOut - more resources
Full Text Sources
Medical
Miscellaneous
